Peridynamic Solution of Wetness Equation with Time Dependent Saturated Concentration in
ANSYS Framework
C. Diyaroglu1, E. Madenci1, S. Oterkus2 and E. Oterkus2
1Department of Aerospace and Mechanical Engineering
University of Arizona, Tucson, Arizona, USA
2Department of Naval Architecture, Ocean and Marine Engineering
University of Strathclyde, Glasgow, UK
Abstract
The components of Integrated Circuit (IC) devices are susceptible to moisture absorption at different stages of the production environment which can lead to hygrothermal stresses during the surface mounting process. The moisture concentration in electronic packages can be determined based on the wetness approach. If the saturated concentration value is dependent on temperature or time, the analogy between the wetness equation and the standard diffusion equation is not valid and requires special treatment. In this study, an alternative formulation, peridynamics, is utilized for the solution of wetness field equation in the case of saturated concentration varying with time. The formulation is implemented in the commercial finite element software, ANSYS, by utilizing traditional finite elements and solvers to make the computations more efficient. The peridynamic wetness approach is validated by considering various problem cases for absorption and desorption with multi-material systems representative of electronic packages.
Introduction
The components of Integrated Circuit (IC) devices are susceptible to moisture absorption at different stages of the production environment. The differential swelling between the polymeric and nonpolymeric materials, and among the polymeric materials exacerbates the hygrothermal stresses during the surface mounting (solder reflow) process in which the temperature of the IC package increases from room temperature to about 220 Co . Since the temperature at this stage is higher than the glass transition temperature of polymeric materials, their mechanical properties degrade significantly.
The moisture concentration in electronic packages can be determined based on the “wetness” approach [1]. The wetness parameter representing the ratio of the moisture concentration with respect to the saturated concentration value of the material is continuous along dissimilar material interfaces. If the saturated concentration value is not dependent on temperature or time, the wetness equation is analogous to the standard diffusion equation whose solution can be constructed by using any commercial finite element analysis software such as ANSYS. However, the time dependency of saturated concentration requires special treatment under temperature dependent environmental conditions such as reflow process.
The saturated concentration values of most polymer materials in electronic packages are mostly dependent on temperature. As a result, the wetness equation is not directly analogous to the standard diffusion equation.
A finite element model of multi-material systems using wetness approach under transient loading was first proposed by Wong et al. [1] and named as “piecewise normalization” approach. However, it requires several load steps and complex algorithms. In order to achieve computational efficiency and easy implementation, Wong [2] introduced an alternative approach named as “internal source” approach. This approach invokes temperature dependency of
C
sat as an internal source function, and its time dependency is approximated with backward Euler method. However, its solution is highly dependent on number of iterations performed during each time step. Recently, Wong and Park [3] revised the internal source technique, and removed the requirement for iterations.As an alternative approach, peridynamics, can be utilized. Peridynamics [4-7] is a new continuum mechanics formulation originally introduced for problems including discontinuities. Peridynamic formulation can also be extended to other fields including temperature [8,9], moisture [10,11], etc. As the field variable, wetness field can also be chosen. Hence, this study presents a new approach for solution of the governing wetness equation with time dependent saturated concentration. The resulting equations can be solved by using the concept of peridynamics. It is computationally efficient as well as easy to implement without any iterations in each time step. Furthermore, the implementation is achieved by using the traditional elements and solvers available in ANSYS. Numerical results illustrate the accuracy and robustness of this approach for absorption and desorption with multi-material systems representative of electronic packages.
Peridynamic (PD) Wetness Approach
Moisture diffusion process occurs in many different physical phenomena, and it can be described by using the classical (local) formulation as
2
( , )
( )
( , )
m( , )
C t
x
=
D t
∇
C t
x
+
Θ
x
t
(1)operator, and ‘dot’ denotes time derivative. The saturated concentration,
C
sat is defined assat VP
C
=
SP
(2)where
S
is the solubility andP
VP is the ambient vapor pressure. The diffusivity and solubility can be defined through the Arrhenius law as( ) 0 ( ) D E RT t
D t D e
− ⎛ ⎞ ⎜ ⎟ ⎝ ⎠
= (3a)
and ( ) 0 ( ) S E RT t
S t S e ⎛ ⎞ ⎜ ⎟ ⎝ ⎠
= (3b)
in which
D
0 is the diffusivity factor,E
D is the activation energy of the diffusivity,S
0 is the solubility factor,E
S is the activation energy of the solubility, R is the universal gas constant, andT
represents temperature.The moisture diffusion equation, Eq. (1) is only valid for a homogenous domain. Therefore, it is not valid for direct solution of concentration in nonhomogeneous domains because the concentration is not continuous along dissimilar interfaces. In order to remedy this situation, Wong et al. [12] introduced a normalized field variable called “wetness” as
sat
C w
C
= (4)
They showed the continuity of this new field through the interface of dissimilar materials based on the equalization of chemical potentials. Therefore, the moisture concentration can be determined by solving first for wetness. If the source function,
Θ
m( , )
x
t
at material point x has a non-zero value, the second term on the right hand side of Eq. (1) requires a modification asΘ
m( , )/
x
t C
sat. However, this equation is onlyvalid under time independent moisture concentration,
C
satcondition.
If
C
sat is time (temperature) dependent, Eq. (1) can be recast in terms of the “wetness” parameter as [2]2
( ) ( , ) ( ) ( ) ( , ) ( , )
sat sat m
C t w tx =D t C t∇ w tx +Θ xt (5a)
with
( , )
( , )
( )
m
t
w t C t
satΘ
x
=
−
x
(5b)
Within the peridynamic framework, the interaction between material points is nonlocal. Therefore, a material point is influenced by the other material points within its
neighborhood defined by its horizon. As shown by Oterkus et al. [11], the PD form of Eq. (1) can be written as
[
sat( ) ( )]
(
, , , ,)
m( )H
C t w t f w w t dV t
t
∂ ′ ′ ′
= +Θ
∂
∫
x x(6)
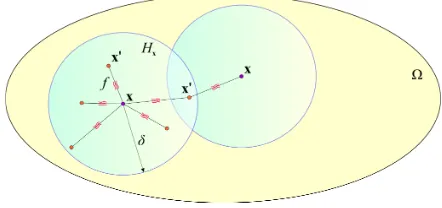
where f is the wetness response function which governs the interaction between material points x and x′. It enables the exchange of wetness between material points that are connected through bonds. In Eq. (6), the parameter
H
xrepresents the domain of influence region for the material point at x as shown in Fig. 1. Its extent is defined by the parameter, δ referred to as the horizon. The response function, f is zero for material points outside the horizon; i.e., x x′− >
δ
. The pairwise response function can be defined as(
, , , ,)
( )w( ) ( )
,t w ,tf w w′ ′ t =d t ′ −
′ −
x x
x x
x x (7)
[image:2.612.334.555.387.491.2]where
d t
( )
is the PD material parameter which is dependent on the material properties and the horizon. This parameter can be determined by equating the PD form of the wetness equation to the classical wetness equation as the horizon size approaches to zero.Fig. 1. Interaction of material point x with its neighboring point, x′
The PD material parameter,
d t
( )
, corresponds to the micro-wetness diffusivity and can be defined as2
2
(1-D)
satDC
d
A
δ
=
,
36
(2-D)
satDC
d
h
π δ
=
,
(8)
4
6
(3-D)
satDC
d
πδ
=
(10)
material points x and x′ is split between these two materials. The segments of this bond are associated with these material points and are denoted by l and l′, respectively. The property of this bond between material points, x and x′ can be approximated as
ˆ l l
m
l l
m m
′
+
= ′
+
′
[image:3.612.49.274.122.287.2](9)
Fig. 2. PD interactions of material points near the interface region.
In discrete form, the integral term involving the response function is replaced by a finite summation; thus, the diffusion equation can be rewritten as
( )
( )( )
(
( ) ( ) ( ) ( ))
( ) ( ) 1, , , , N
k
sat k j j k j k j m k
j w
C f w w t V
t =
∂
= +Θ
∂
∑
x x (10a)with
( ) ( ) sat
m k k
C
w
t
∂
Θ
=
−
∂
(10b)where the displacement
w
( )k andw
( )j are wetness values at material points x( )k and x( )j , respectively. The response function f( )( )k j represents the wetness exchange between material points x( )k and x( )j . The summation rangeN
is the number of family members of material point x( )k . The family of material point x( )k is denoted byH
x( )k as shown in Fig.1.In order to implement the saturated concentration values as boundary conditions, the fictitious boundary layer regions
are created with a depth of
δ
in addition to the actualdimensions of a domain as described by Madenci and Oterkus [13]. During the solution process for each time step, the time
dependency of
C
sat can be approximated with backwardEuler method between the consecutive time steps as
( ) ( ) ( )
( ) ( )
sat sat sat
m k k k
C C t t C t
w w
t t
Δ +Δ −
Θ =− =−
Δ Δ (11)
Also, the PD bond parameter,
d t
( )
is updated in accordancewith Eqs. (2) and (3a). Therefore, the solution to peridynamic wetness equation does not require any iteration during the solution procedure in order to conserve moisture concentration. Numerical implementation of the peridynamic formulation can be accomplished by using standard elements of a commercial finite element software such as thermal mass element and thermal link element. In this study, the commercial finite element software, ANSYS is used for this purpose. The main advantage of such implementation is to be able utilize the efficient solvers of ANSYS and perform implicit time integration in a straightforward manner. Therefore, significantly large time step sizes can be utilized which is especially important for long duration absorption and desorption phases of moisture diffusion analysis.
Numerical results
Absorption case
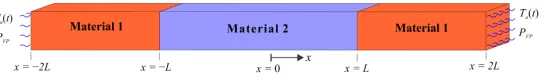
A bar with a length of
4
L
=
4 mm
is composed of two different materials as shown in Fig. 3. Material 2 is confined with material 1. The lateral surfaces of the bar are isolated and the boundary conditions are specified as(
2 , 2
)
sat1C x
=
−
L L
=
C
. The bar is initially at a dry state,1
( ,
0)
2( ,
0) 0
C x t
= =
C x t
= =
before the start of absorption. The time dependent temperature is uniformly distributed along the bar as(
)
( )
25
60 C
aT t
=
+
t
(12)As the time progresses, the temperature changes uniformly but the partial vapor pressure is kept constant as
3207 Pa
VP [image:3.612.316.586.669.709.2]P
=
(P
sat=
P
VP at 25°C) in the absorption process. The time step size is chosen as Δt=2 s and total solution time is 3600 s. The properties of each material are given in Table 1. Note that the materials have the same activation energy.Table 1. Material properties
The initial and boundary conditions in terms of the wetness parameters are specified as
(
2
2 ,
0
)
0
w
−
L x
< <
L t
= =
(13)and
(
2 ,
)
1
w x
=
−
L t
=
andw x
(
=
2 ,
L t
)
=
1
(14)As shown in Fig. 4, the PD model of the bar is discretized with spacing
Δ
x L
=
/100
between the material points, and the horizon size is chosen asδ
=
3.015
Δ
x
. Its uniform cross-sectional area is specified as A=( )
Δx 2. The PD equations are solved implicitly with a time step size ofΔ
t
=
2 s
and total solution time is 3600 s. During solution time steps, the PD bond constants,d
n+1, are updated with new diffusivity values of the next time step, D1,n+1 and D2,n+1. Moreover, the saturated concentrations, Csat n1, +1 and Csat n2,+1, are also updated at each time step.Fig. 4. Numerical discretization of the peridynamic model.
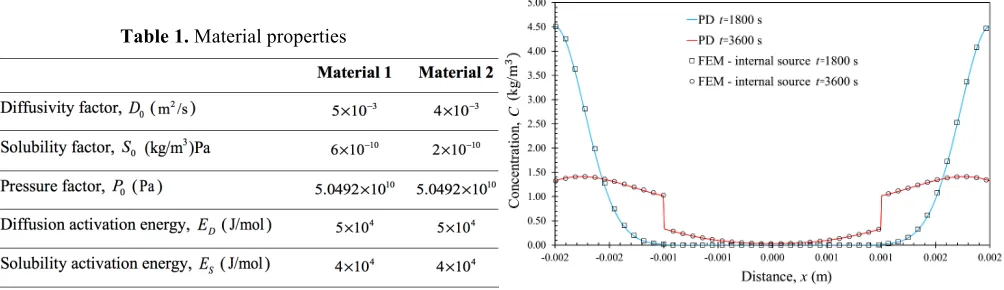
The moisture concentration predictions based on the “internal source” approach and peridynamics are shown in Fig. 5 at time,
t
=
1800 and 3600 s
. As evident in this figure, both methods are in agreement, and produce correct results. However, the PD predictions do not require the additional iteration steps between time steps. As time progresses, the temperature increases while the saturated concentration values of both materials decrease. The concentration levels after 3600 sec of absorption are low compared to the room temperature levels. Please also note that the results with large horizon size do not differ much from the results with more local horizon size (δ =1.05Δx). Therefore, the effect of nonlocality is unimportant for this particular problem.Fig. 5. Moisture concentration along the bar as the time progresses.
Desorption case with equal values of Es
The geometry, and material properties of the bar are the same as that of the previous problem. Activation energy of the vapor pressure is
4
4.1 10 J/mol
VP
E = × (15)
and saturated concentration is calculated from
0 0
S VP
E E
RT sat
C S P e RH
−
⎛ ⎞
⎜ ⎟
⎝ ⎠
= × (16)
The lateral surfaces of the bar are isolated and the boundary conditions are specified as
C x
(
=
−
2 , 2
L L
)
=
0
. The bar is initially fully saturated at 85°C/100% RH. It is subjected to desorption process and the temperature changes uniformly with time as(0.02)
( ) 85
tC
T t
=
×
e
(17)Furthermore, the solubility activation energies are continuous at the interface of materials. The initial and boundary conditions in terms of the wetness parameters are specified as
(
2
2 ,
0
)
1
w
−
L x
< <
L t
= =
(18)and
(
2 ,
)
0
w x
=
−
L t
=
andw x
(
=
2 ,
L t
)
=
0
(19)and peridynamics are shown in Fig. 7 as time progresses. As apparent in Fig. 7, both methods provide comparable and accurate predictions. As the time progresses, desorption takes place and both wetness and corresponding moisture concentration decrease throughout the bar. Moreover, discontinuous concentration is captured throughout the interface.
Fig. 6. Wetness variation along the bar as the time progresses.
Fig. 7. Moisture concentration along the bar as the time progresses.
Desorption case with unequal values of Es
The geometry, boundary conditions and material properties of the bar is the same as that of the previous problem except for the solubility activation energy of material 2. It is modified as 4.50 10 J/mol4
S
E = × . By doing this, the apparent difference between activation energies of solubility and vapor pressure, i.e.
E
S≠
E
VP, is observed for material 2 and the continuity of solubility activation energies at the interface, i.e. ES,1≠ES,2, is not satisfied for this case. Therefore, while the wetness values maintain their continuity at the interface the ratio ofC
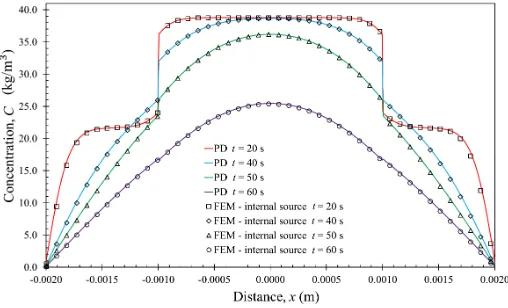
sat values at the interface changes with time.The comparison of moisture concentration predictions based on the FEM “internal source” and peridynamics are shown in Fig. 8 at time t=20, 40, 50 and 60 s. Both methods
[image:5.612.315.569.152.306.2]provide predictions that are in close agreement. To conclude, the PD diffusion equation of motion can effectively capture time dependent effect of material properties under temperature dependent environmental conditions. This new approach is easy to implement and it is computational efficient since load steps are not needed between time steps for the convergence of the results as in the internal source approach.
Fig. 8. Moisture concentration along the bar as the time progresses.
Conclusions
In this study, a new approach based on peridynamics for the solution of wetness field in the case of time dependent saturated concentration is presented. The numerical implementation is done by using the commercial finite element software, ANSYS. Such an approach introduces numerical efficiencies during the solution process. Moreover, the current approach does not require iterations in each time step. In order to demonstrate the capability of this approach, three different cases are considered for a two material system where one of the materials is sandwiched between the other material. Both absorption and desorption cases are simulated by considering equal and unequal activation energies of solubility and vapor pressure. Peridynamic results are compared against the results generated by using internal source approach and a good agreement between two approaches is observed.
References
1. Wong, E. H., Koh, S. W., Lee, K. H. and Rajoo, R., 2002, “Advanced moisture diffusion modeling & characterization for electronic packaging,” In: Proc 52nd ECTC Conference, pp. 1297-1303.
2. Wong, E.H., 2015, “The fundamentals of thermal-mass diffusion analogy,’ Microelectronics Reliability, 55, pp. 588– 595.
[image:5.612.50.293.295.477.2]4. Silling S. A., 2000, “Reformulation of Elasticity Theory for Discontinuities and Long-range Forces,” Journal of the Mechanics and Physics of Solids, Vol. 48, pp. 175-209. 5. Oterkus, E., Barut, A. and Madenci, E., 2010, “Damage Growth Prediction from Loaded Composite Fastener Holes by
Using Peridynamic Theory” 51th
AIAA/ASME/ASCE/AHS/ASC Structures, Structural Dynamics, and Materials Conference, Orlando, FL, Paper No.2010-3026.
6. Oterkus, E. and Madenci, E., 2012, “Peridynamics for Failure Prediction in Composites” 53th AIAA/ASME/ASCE/AHS/ASC Structures, Structural Dynamics, and Materials Conference, Honolulu, HI, Paper No.2012-1692.
7. Diyaroglu, C., Oterkus, E., Oterkus, S. and Madenci, E., 2015, “Peridynamics for bending of beams and plates with transverse shear deformation,” International Journal of Solids and Structures, Vol. 69-70, pp. 152-168.
8. Oterkus, S., Fox, J., and Madenci, E. 2013, “Simulation of
Electro-migration Through Peridynamics,” Electronic
Components and Technology Conference (ECTC), 2013 IEEE 63rd (pp. 1488-1493). IEEE.
9. Amani, J., Oterkus, E., Areias, P. M., Zi, G., Nguyen-Thoi, T. and Rabczuk, T., 2016, “A Non-ordinary State-based Peridynamics formulation for Thermoplastic Fracture,”
International Journal of Impact Engineering, Vol. 87, pp. 83-94.
10. Oterkus, S. and Madenci, E., 2014, “Fully Coupled Thermomechanical Analysis of Fiber Reinforced Composites
Using Peridynamics,” 55th AIAA/ASME/ASCE/AHS/SC
Structures, Structural Dynamics, and Materials Conference-SciTech Forum and Exposition 2014.
11. Oterkus, S., Madenci, E., Oterkus, E., Hwang Y., Bae, J. and Han, S., 2014, “Hygro-Thermo-Mechanical Analysis and Failure Prediction in Electronic Packages by Using Peridynamics,” 64th Electronic Components & Technology Conference, Lake Buena Vista, Florida, USA.
12. Wong, E. H., Teo, Y. C. and Lim, T. B., 1998, “Moisture diffusion and vapor pressure modeling of IC packaging,” Proceedings of the 48th Electronic Components and
Technology Conference, pp. 1372-1378.