Gamma Function
Random ORFs
0 100 200 300
Protein size (aa)
Frequenc
y
Monotonic
Decrease
0 100 200 300
Protein size (aa)
Frequenc
y
Sum of
exponentials
function
Functional genes
0 100 200 300
Protein size (aa)
Frequenc
y
Filtered ORFs
Abundant small ORFs <100aa
Average size Archaea: 283aa Bacteria: 320aa Eukaryota: 472aa
Total Bacteria
64% Fungi
7% Plants
5% Protists
6%
Animals 14%
Archaea 4%
Taxonomic
coverage
Dataset 2
Tiessen et al. 2011
Mathematical modeling and comparison of
protein size distribution in different plant, animal,
fungal and microbial species reveals a negative
correlation between protein size and protein
number, thus providing insight into the evolution
of proteomes
Tiessen
et al
.
R E S E A R C H A R T I C L E
Open Access
Mathematical modeling and comparison of
protein size distribution in different plant, animal,
fungal and microbial species reveals a negative
correlation between protein size and protein
number, thus providing insight into the evolution
of proteomes
Axel Tiessen
1*, Paulino Pérez-Rodríguez
2and Luis José Delaye-Arredondo
1Abstract
Background:The sizes of proteins are relevant to their biochemical structure and for their biological function. The statistical distribution of protein lengths across a diverse set of taxa can provide hints about the evolution of proteomes.
Results:Using the full genomic sequences of over 1,302 prokaryotic and 140 eukaryotic species two datasets
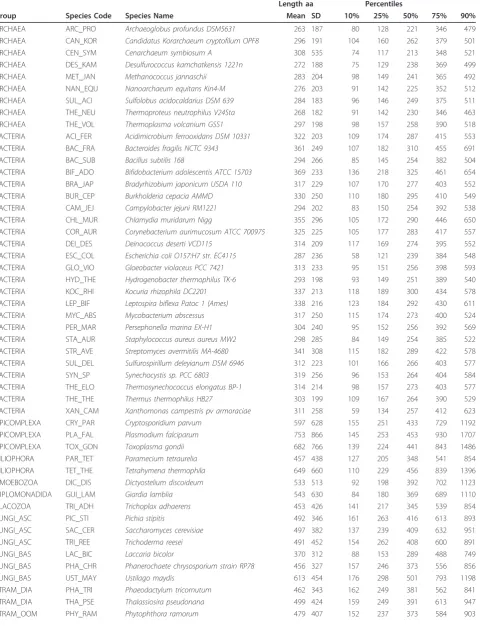
containing 1.2 and 6.1 million proteins were generated and analyzed statistically. The lengthwise distribution of proteins can be roughly described with a gamma type or log-normal model, depending on the species. However the shape parameter of the gamma model has not a fixed value of 2, as previously suggested, but varies between 1.5 and 3 in different species. A gamma model with unrestricted shape parameter described best the distributions in ~48% of the species, whereas the log-normal distribution described better the observed protein sizes in 42% of the species. The gamma restricted function and the sum of exponentials distribution had a better fitting in only ~5% of the species. Eukaryotic proteins have an average size of 472 aa, whereas bacterial (320 aa) and archaeal (283 aa) proteins are significantly smaller (33-40% on average). Average protein sizes in different phylogenetic groups were: Alveolata (628 aa), Amoebozoa (533 aa), Fornicata (543 aa), Placozoa (453 aa), Eumetazoa (486 aa), Fungi (487 aa), Stramenopila (486 aa), Viridiplantae (392 aa). Amino acid composition is biased according to protein size. Protein length correlated negatively with %C, %M, %K, %F, %R, %W, %Y and positively with %D, %E, %Q, %S and %T. Prokaryotic proteins had a different protein size bias for %E, %G, %K and %M as compared to eukaryotes.
Conclusions:Mathematical modeling of protein length empirical distributions can be used to asses the quality of
small ORFs annotation in genomic releases (detection of too many false positive small ORFs). There is a negative correlation between average protein size and total number of proteins among eukaryotes but not in prokaryotes. The %GC content is positively correlated to total protein number and protein size in prokaryotes but not in eukaryotes. Small proteins have a different amino acid bias than larger proteins. Compared to prokaryotic species, the evolution of eukaryotic proteomes was characterized by increased protein number (massive gene duplication) and substantial changes of protein size (domain addition/subtraction).
* Correspondence: [email protected] 1
Departamento de Ingeniería Genética, CINVESTAV Irapuato, Irapuato, CP 36821, Mexico
Full list of author information is available at the end of the article
Background
The biological function of a protein is determined by its tertiary, i.e., three-dimensional, structure, which in turn is influenced by its primary structure, i.e. its amino acid sequence. Besides the given order of amino acids (aa), the total length of a protein is also important for deter-mining the tertiary structure of any polypeptide. The longer a protein is, the more options there are for accommodating multiple secondary structures and fold-ing loops [1-3]. The statistical distribution of the sizes of proteins has been investigated by several groups in the past, although with a limited number of representa-tive taxa or focused on prokaryotes. Comparison of average protein size in the proteomes of 5 archaeal, 15 bacterial and 2 eukaryotic species revealed marked dif-ferences of protein size [4]. A larger study compared also protein sizes in 16 archaeal, 67 bacterial and 5 eukaryotic species and came to a similar conclusion [5]. It is actually well established that eukaryotic proteins are on average, significantly longer than bacterial pro-teins, and these in turn are longer on average than archaeal proteins [4,5]. However, previous studies have not investigated whether there are protein size differ-ences among eukaryotic organisms.
The fact that eukaryotic organisms have larger pro-teins than prokaryotic species has been interpreted as a true evolutionary trend towards an increase of protein size [4,5]. It has been postulated that the evolution of eukaryotic proteins was influenced by processes of fusion of single-function proteins into extended multi-functional and multi-domain proteins [5]. Fusion of domains of given size could be predicted to give rise to peaks of a multiple given size in the protein size histo-grams given the discontinuity of domain sizes and the limited number of different structural domain types. Fusion of domains increases the average size of proteins and this could potentially lead to a respective reduction of the number of individual proteins in the genome.
The evolutionary forces that have shaped protein number and size distributions in modern organisms are unknown. Some groups have tried to find answers based on theoretical models. According to the frequency of stop triplets in the genetic code (= 3/64), the expected size of an open reading frame (ORF) from a random DNA sequence should be on average 64 nucleotides long (~21 aa) [6]. However, since stop codons are biased towards the nucleotides T and A, the expected size also depends on the %GC content of the random sequence, varying between 14 aa (for 35% GC) and 31 aa (for 60% GC) [7]. According to a more detailed analysis of ORF statistics, non-coding DNA sequences are not fully ran-dom, but generate random ORF much longer than theo-retically expected [8]. Nevertheless, a sharp cutoff is found at 100 triplets (~33 aa) [8]. Since most
biologically active proteins are actually much larger than 50 aa, there must be a strong selective mechanism for maintaining the coding capacity of DNA (ORF length).
Two theories have been postulated to explain the rela-tion between protein origin and size distriburela-tion: the starter-set and the random-origin hypotheses. The star-ter-set hypothesis assumes that proteins originated from a small set of starter sequences (functional domains) with lengths of 4 aa, 15 aa or 50 aa which were expanded by gene duplication and modification [9-13]. The premise of this hypothesis is that gene or exon duplication and fusion were essential from the very beginning of protein evolution for producing modern sequences of all organisms, including prokaryotic and eukaryotic species [14]. In contrast, the random-origin hypothesis assumes that proteins emerged first from a very large number of random heteropeptides [15-17]. The random-origin hypothesis assumes that the length
of proteins were initially determined by the“start” and
“end”signals that delimited the primitive genes and that
were distributed randomly along nucleotide sequences. The random-origin hypothesis explains the appearance of large proteins alone by chance [14,18]. The starter set hypothesis assumes that primitive proteins were initially very small (< 50 aa) but biologically active, and by domain joining and gene fusion became gradually larger [14,18].
In order to discriminate between those evolutionary theories, is it important to know the frequency of small proteins in the genomes of different species. It is also relevant to determine the selective advantage of having numerous proteins (gene duplications) or proteins of larger size (biological functionality). Some researchers have started by investigating which is the best theoreti-cal model that underlies protein size distributions. White (1994) examined 1,792 sequences and reported that prokaryotic and eukaryotic protein sets had a simi-lar statistical length distribution that could be described by a gamma distribution with shape parameter equal to two or with a distribution that results from the sum of two exponential distributions [18]. A moderate fit to a gamma-type distribution was also found by [19] whereas [20] postulated a better fit to a log-normal distribution. Some have argued that a log-normal function was more appropriate because it describes distributions that arise from the product of many random independent events [20]. A stochastic model based on multiplicative pro-cesses has also been used to explain protein length dis-tributions [21].
log-normal distribution has been said to be less appropriate [20]. Gamma distributions, on the other hand, result from the addition of random intervals and have been
said to be more reasonablea priori[22].
A simple theory to explain why protein lengths can follow gamma-type distributions [18], assumes that (i) protein sequences have exponentially distributed ran-dom lengths; (ii) there is a length dependence of protein fold stability and potential for biochemical activity which greatly limits the number of small proteins (< 100 aa). This theory assumes that maximal protein size (> 1,000 aa) is limited by the very frequent occurrence of stop codons, whereas minimal size is determined by the more limited biological usefulness of small proteins (< 100 aa) [14,18]. In support of the hypothesis that pro-teins emerged first from random heteropeptides, it has been shown that modern proteins have a 90% chance of having a lengthwise distribution of amino acids that is indistinguishable from the random expectation [14]. Pre-liminary surveys concluded that the abundance of differ-ent amino acids in proteins is not dependdiffer-ent on the protein length or species of origin [23]. This suggest that small and large proteins should have indistinguish-able amino acid composition. It also implies that bacter-ial and animal proteins (or other groups for that matter) should have the same amino acid bias.
In this work we wanted to revise many of these assumptions. We aimed to address the following ques-tions: How does protein size vary in eukaryotic taxa? Which evolutionary forces influence protein number and protein size? Which theoretical function better describes the observed distributions of protein sizes? Is average protein size correlated to the total number of proteins or to the GC content of DNA? How well are small proteins annotated in the genomic releases? Is there an amino acids bias according to protein size? In order to answer those and other similar questions, we analyzed two independent sets of proteomic data.
Results
Construction and curation of protein datasets
We decided to compare the protein size distributions of different taxa in order to examine the factors that deter-mine protein function, stability and evolutionary trends. In order to achieve this, we first had to construct and validate two datasets for this purpose (set 1 and 2). Selection of biological species, automatic filtering and manual curation of the protein data files was a necessary requirement to ensuring the reliability of the statistical analysis that was performed subsequently. Set 1 was biased towards eukaryotes and plant species, whereas set 2 was biased towards prokaryotic species.
For dataset 1, the publicly available sequence genomic files were downloaded (see Additional file 1: Table S1) and
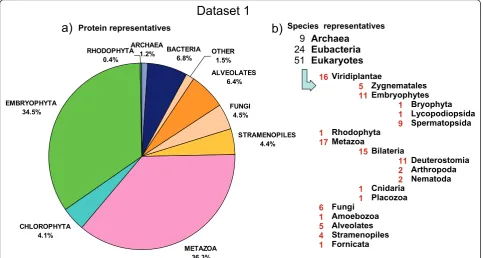
duplicated protein sequences (identical amino acid sequence, or a sequence being an identical subsequence of other) were removed to yield a non redundant (nr) set (see Additional file 1: Table S2). For the prokaryotic group, we selected 9 archaeal species (15,089 nr proteins) and 24 representative bacterial species (85,592 nr proteins). From the eukaryotic group we selected 5 Alveolata species (81,215 nr proteins), one species of each of the following taxa: Amoenozoa, Fornicata, Placozoa (30,171 nr proteins), 6 fungal species (57,501 nr proteins), 4 Stramenopiles spe-cies (55,559 nr proteins) and 16 Eumetazoan spespe-cies (447,717 nr proteins). From photosynthetic eukaryotic organisms, we selected one species of the following taxa Bryophyta, Lycopodiophyta, Rhodophyta (62,737 nr pro-teins), 5 Chlorophyta species (52,062 nr propro-teins), 5 dicot species (200,710 nr proteins) and 4 monocot species (177,801 nr proteins). In total, we obtained 1,266,154 nr proteins (see Additional file 1: Table S2) with a percentage coverage of each taxa as shown in Figure 1, which we con-sidered -for our purposes- to be an acceptable snapshot of the genomic diversity that was available in the public domain at the time of downloading (May 2010).
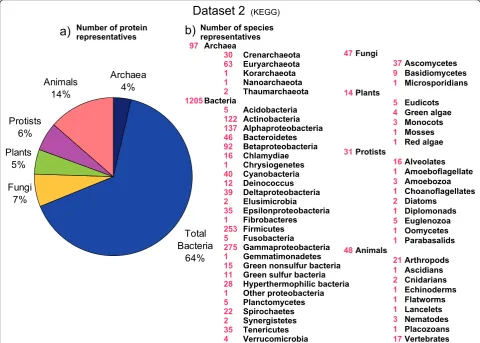
In order to complement our study, we also downloaded all genomes from the KEGG database (downloaded on the 27 of May 2011; http://www.genome.jp/kegg/), which is biased towards prokaryotic genomes, but it also contains many eukaryotic species (see Additional file 1: Table S3). In the second set, we analyzed 1,442 species (97 archaeal, 1,205 bacterial and 140 eukaryotic species), representing 6,169,140 proteins (Figure 2).
Average protein size in different species and lineages
Protein size of functional KO categories across taxonomic groups
Three strategies were followed in order to confirm that average protein size was not derived from genomic arte-facts and data outliers generated by transposons, alter-native spliced proteins and gene family duplications: 1) we performed mathematical modeling for decreasing the influence of outliers (see later sections), 2) we filtered transposon proteins and made a separate analysis of size distribution, and 3) we grouped genes according to functional categories and compared average sizes of dif-ferent taxonomic groups (see below).
For strategy 2 we selected the best annotated plant
genome (Arabidopsis thaliana) as representative
eukar-yotic species. We filtered all proteins that contained par-ticular keywords in the gene annotation (e.g. transposon, transposase, retrovirus, etc.) and made a separate analy-sis of protein size (data not shown). The results con-firmed that transposon related proteins did neither affect the distribution models nor any of the other results (averages, medians and percentiles shown in Table 1).
For strategy 3, the KEGG ontological categories (KO) were assigned to proteins of dataset 2. The average pro-tein sizes of each KO category were plotted for compar-ing taxa (Figure 4). The size differences between
archaeal and bacterial proteins were distributed among many but not all KO categories (Figure 4a). This means that some KO categories of proteins were larger in bac-terial species, but other KO categories were smaller than archaeal proteins. On a global average, archaeal proteins were significantly smaller than bacterial proteins, as pre-viously shown in Table 2. This means that one of the selective forces that shaped size differences between prokaryotic taxa increased the number of proteins of some KO categories (e.g. categories with large proteins). Thus, among prokaryotes, protein size (within the same KO category) did not increase so much through domain addition or gene fusion (Table 1). The 90% percentile of plant proteins is in the range of 649-877 aa, whereas in animals it is in the range of 909-1,125 aa (Table 1).
In contrast, when comparing bacteria and fungi (as eukaryotic representative) the size differences were pre-sent in many KO categories (Figure 4b). Proteins of most KO categories were larger in size in fungi than in bacteria (Figure 4b). This can be interpreted that the average differences of protein size (Table 2) was not an artifact, but it has been caused by a mechanism of gene extension, through domain addition or gene fusion.
Finally, eukaryotic taxa were also compared to each other. Proteins belonging to the same KO category were of variable size in different taxonomic groups, e.g. as
Archaea Eubacteria Eukaryotes 9
24 51
a)
b)
Viridiplantae
Zygnematales Embryophytes
Bryophyta Lycopodiopsida Spermatopsida Rhodophyta
Metazoa
Bilateria
Deuterostomia Arthropoda Nematoda Cnidaria
Placozoa Fungi
Amoebozoa Alveolates Stramenopiles Fornicata 16
5 11
1 1 9 1
17
15
11 2 2 1
1 6
1 5 4 1
ARCHAEA
1.2% BACTERIA6.8%
ALVEOLATES 6.4%
FUNGI 4.5%
STRAMENOPILES 4.4%
CHLOROPHYTA 4.1% EMBRYOPHYTA
34.5%
RHODOPHYTA 0.4%
OTHER 1.5%
METAZOA 36.3%
Species representatives Protein representatives
[image:5.595.57.541.90.348.2]Dataset 1
shown between fungi and protist (Figure 4c). This means that the observed size differences between eukar-yotic groups (see Table 1 and Figure 3) were caused by both evolutionary mechanisms, by gene duplication (increasing the number of large proteins) and by gene fusion (altering average protein size of some selected KO categories).
Protein number and protein average size in different species
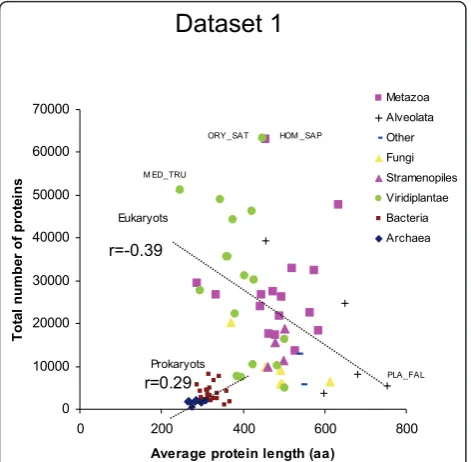
After detecting significant differences in protein length among lineages (Table 1), we studied the relationship between the average protein length and the total num-ber of proteins coded in the genomes. In dataset 1, a low positive correlation between the total number of proteins and the average protein length of each species
was found (Figure 4;r = 0.25, n = 84,p= 0.024).
How-ever, this relationship arouse from the strong difference between prokaryotic and eukaryotic species. When
species of data set 1 were analyzed as two separate king-doms, the number of proteins per genome correlated
positively for prokaryotes (r = 0.25) but negatively for
eukaryotes (r = -0.39) (Figure 5). A similar negative
cor-relation value was found for eukaryotic species of data-set 2 (r= -0.39, n = 140, p= 2 × 10⁻⁶) (Figure 6).
Range of average protein size differences
Plotting average protein sizes showed that the values were quite narrowly distributed for prokaryotic species, but it had a much larger spread in eukaryotes (Figure 4). Protein size of archaeal species were even more nar-rowly distributed than bacterial proteins (Figure 4). Among eukaryotic species, the spread was larger for protists than for animals or fungi (Figure 6). Protist spe-cies have longest or shortest protein sizes, or also the genome with the most numerous genes (Figure 6). This indicates that there is larger diversity of protein number and size among unicellular protists species than among
a)
b)
Number of speciesrepresentatives
(KEGG)
[image:6.595.57.538.90.433.2]Number of protein representatives Archaea Crenarchaeota Euryarchaeota Korarchaeota Nanoarchaeota Thaumarchaeota Bacteria Acidobacteria Actinobacteria Alphaproteobacteria Bacteroidetes Betaproteobacteria Chlamydiae Chrysiogenetes Cyanobacteria Deinococcus Deltaproteobacteria Elusimicrobia Epsilonproteobacteria Fibrobacteres Firmicutes Fusobacteria Gammaproteobacteria Gemmatimonadetes Green nonsulfur bacteria Green sulfur bacteria Hyperthermophilic bacteria Other proteobacteria Planctomycetes Spirochaetes Synergistetes Tenericutes Verrucomicrobia Fungi Ascomycetes Basidiomycetes Microsporidians Plants Eudicots Green algae Monocots Mosses Red algae Protists Alveolates Amoeboflagellate Amoebozoa Choanoflagellates Diatoms Diplomonads Euglenozoa Oomycetes Parabasalids Animals Arthropods Ascidians Cnidarians Echinoderms Flatworms Lancelets Nematodes Placozoans Vertebrates 97 30 63 1 1 2 1205 5 122 137 46 92 16 1 40 12 39 2 35 1 253 5 275 1 15 11 28 1 5 22 2 35 4 47 37 9 1 14 5 4 3 1 1 31 16 1 3 1 2 1 5 1 1 48 21 1 2 1 1 1 3 1 17 Total Bacteria 64% Fungi 7% Plants 5% Protists 6% Animals 14% Archaea 4%
Dataset 2
Table 1 Protein size summary.
Length aa Percentiles
Group Species Code Species Name Mean SD 10% 25% 50% 75% 90%
ARCHAEA ARC_PRO Archaeoglobus profundus DSM5631 263 187 80 128 221 346 479
ARCHAEA CAN_KOR Candidatus Korarchaeum cryptofilum OPF8 296 191 104 160 262 379 501
ARCHAEA CEN_SYM Cenarchaeum symbiosum A 308 535 74 117 213 348 521
ARCHAEA DES_KAM Desulfurococcus kamchatkensis 1221n 272 188 75 129 238 369 499
ARCHAEA MET_JAN Methanococcus jannaschii 283 204 98 149 241 365 492
ARCHAEA NAN_EQU Nanoarchaeum equitans Kin4-M 276 203 91 142 225 352 512
ARCHAEA SUL_ACI Sulfolobus acidocaldarius DSM 639 284 183 96 146 249 375 511
ARCHAEA THE_NEU Thermoproteus neutrophilus V24Sta 268 182 91 142 230 346 463
ARCHAEA THE_VOL Thermoplasma volcanium GSS1 297 198 98 157 258 390 518
BACTERIA ACI_FER Acidimicrobium ferrooxidans DSM 10331 322 203 109 174 287 415 553
BACTERIA BAC_FRA Bacteroides fragilis NCTC 9343 361 249 107 182 310 455 691
BACTERIA BAC_SUB Bacillus subtilis 168 294 266 85 145 254 382 504
BACTERIA BIF_ADO Bifidobacterium adolescentis ATCC 15703 369 233 136 218 325 461 654
BACTERIA BRA_JAP Bradyrhizobium japonicum USDA 110 317 229 107 170 277 403 552
BACTERIA BUR_CEP Burkholderia cepacia AMMD 330 250 110 180 295 410 549
BACTERIA CAM_JEJ Campylobacter jejuni RM1221 294 202 83 150 254 392 538
BACTERIA CHL_MUR Chlamydia muridarum Nigg 355 296 105 172 290 446 650
BACTERIA COR_AUR Corynebacterium aurimucosum ATCC 700975 325 225 105 177 283 417 557
BACTERIA DEI_DES Deinococcus deserti VCD115 314 209 117 169 274 395 552
BACTERIA ESC_COL Escherichia coli O157:H7 str. EC4115 287 236 58 121 239 384 548
BACTERIA GLO_VIO Gloeobacter violaceus PCC 7421 313 233 95 151 256 398 593
BACTERIA HYD_THE Hydrogenobacter thermophilus TK-6 293 198 93 149 251 389 540
BACTERIA KOC_RHI Kocuria rhizophila DC2201 337 213 118 189 300 434 578
BACTERIA LEP_BIF Leptospira biflexa Patoc 1 (Ames) 338 216 123 184 292 430 611
BACTERIA MYC_ABS Mycobacterium abscessus 317 250 115 174 273 400 524
BACTERIA PER_MAR Persephonella marina EX-H1 304 240 95 152 256 392 569
BACTERIA STA_AUR Staphylococcus aureus aureus MW2 298 285 84 149 254 385 522
BACTERIA STR_AVE Streptomyces avermitilis MA-4680 341 308 115 182 289 422 578
BACTERIA SUL_DEL Sulfurospirillum deleyianum DSM 6946 312 223 101 166 266 403 577
BACTERIA SYN_SP Synechocystis sp. PCC 6803 319 256 96 153 264 404 584
BACTERIA THE_ELO Thermosynechococcus elongatus BP-1 314 214 98 157 273 403 577
BACTERIA THE_THE Thermus thermophilus HB27 303 199 109 167 264 390 529
BACTERIA XAN_CAM Xanthomonas campestris pv armoraciae 311 258 59 134 257 412 623
APICOMPLEXA CRY_PAR Cryptosporidium parvum 597 628 155 251 433 729 1192
APICOMPLEXA PLA_FAL Plasmodium falciparum 753 866 145 253 453 930 1707
APICOMPLEXA TOX_GON Toxoplasma gondii 682 766 139 224 441 843 1486
CILIOPHORA PAR_TET Paramecium tetraurelia 457 438 127 205 348 541 854
CILIOPHORA TET_THE Tetrahymena thermophila 649 660 110 229 456 839 1396
AMOEBOZOA DIC_DIS Dictyostelium discoideum 533 513 92 198 392 702 1123
DIPLOMONADIDA GUI_LAM Giardia lamblia 543 630 84 180 369 689 1110
PLACOZOA TRI_ADH Trichoplax adhaerens 453 426 141 217 345 539 854
FUNGI_ASC PIC_STI Pichia stipitis 492 346 161 263 416 613 893
FUNGI_ASC SAC_CER Saccharomyces cerevisiae 497 382 137 239 409 632 951
FUNGI_ASC TRI_REE Trichoderma reesei 491 452 154 262 408 600 891
FUNGI_BAS LAC_BIC Laccaria bicolor 370 312 88 153 289 488 749
FUNGI_BAS PHA_CHR Phanerochaete chrysosporium strain RP78 456 327 157 246 373 556 856
FUNGI_BAS UST_MAY Ustilago maydis 613 454 176 298 501 793 1198
STRAM_DIA PHA_TRI Phaeodactylum tricornutum 462 343 162 249 381 562 841
STRAM_DIA THA_PSE Thalassiosira pseudonana 499 424 159 249 391 613 947
all other taxa. This parallels 16SrRNA, where protists showed the largest amount of diversity among eukar-yotes [25].
GC content of coding DNA and average protein size in different species
We also studied the possible relationship between pro-tein number, size and GC content of the genomes. We therefore measured the gene-based GC content for all species in dataset 2 (see methods). The overall correla-tion coefficient between average protein size and GC
content was barely significant (r = 0.05, n= 1,442;p=
0.048). When analyzed as separate kingdoms, correlation
values were non-significant in Eukaryotes (r = -0.05,n=
140; p = 0.53) and Archaea (r = 0.021; n = 101;p =
0.84) but significant in Bacteria (r = 0.21,n= 1,239; p=
9.7 × 10⁻¹⁴).
Correlation values between protein number and GC
content were: All species (r = 0.17, n= 1,442;p= 3.1 ×
10-11), Eukaryotes (r = -0.05,n= 140;p= 0.53), Archaea
(r = 0.44;n= 101; p = 2.7 × 10⁻⁶) and Bacteria (r = 0.58,
n= 1,239;p= 8.6 × 10-114).
[image:8.595.59.538.101.512.2]These results are in accordance with the hypothesis that protein size in eukaryotic organisms (as compared to prokaryotes) has been under distinct selective pres-sures during the evolution of lineages [26]. The positive correlation found for bacterial species gives support for the theoretical prediction that the length of ORFs increases with the GC content of DNA due to the AT bias of stop codons [7]. It is interesting to note that this
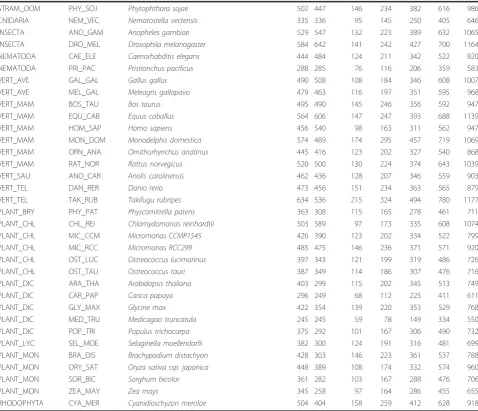
Table 1 Protein size summary.(Continued)
STRAM_OOM PHY_SOJ Phytophthora sojae 502 447 146 234 382 616 986
CNIDARIA NEM_VEC Nematostella vectensis 335 336 95 145 250 405 646
INSECTA ANO_GAM Anopheles gambiae 529 547 132 223 389 632 1065
INSECTA DRO_MEL Drosophila melanogaster 584 642 141 242 427 700 1164
NEMATODA CAE_ELE Caenorhabditis elegans 444 484 124 211 342 522 820
NEMATODA PRI_PAC Pristionchus pacificus 288 285 76 116 206 359 583
VERT_AVE GAL_GAL Gallus gallus 490 508 108 184 346 608 1007
VERT_AVE MEL_GAL Meleagris gallopavo 479 463 116 197 351 595 968
VERT_MAM BOS_TAU Bos taurus 495 490 145 246 356 592 947
VERT_MAM EQU_CAB Equus caballus 564 606 147 247 393 688 1139
VERT_MAM HOM_SAP Homo sapiens 456 540 98 163 311 562 947
VERT_MAM MON_DOM Monodelphis domestica 574 489 174 295 457 719 1069
VERT_MAM ORN_ANA Ornithorhynchus anatinus 445 416 123 202 327 540 868
VERT_MAM RAT_NOR Rattus norvegicus 520 500 130 224 374 643 1039
VERT_SAU ANO_CAR Anolis carolinensis 462 436 128 207 346 559 903
VERT_TEL DAN_RER Danio rerio 473 456 151 234 363 565 879
VERT_TEL TAK_RUB Takifugu rubripes 634 536 215 324 494 780 1177
PLANT_BRY PHY_PAT Physcomitrella patens 363 308 115 165 278 461 711
PLANT_CHL CHL_REI Chlamydomonas reinhardtii 503 589 97 173 335 608 1074
PLANT_CHL MIC_CCM Micromonas CCMP1545 426 390 123 202 334 522 799
PLANT_CHL MIC_RCC Micromonas RCC299 485 475 146 236 371 571 920
PLANT_CHL OST_LUC Ostreococcus lucimarinus 397 343 121 199 319 486 726
PLANT_CHL OST_TAU Ostreococcus tauri 387 349 114 186 307 476 716
PLANT_DIC ARA_THA Arabidopsis thaliana 403 299 115 202 345 513 749
PLANT_DIC CAR_PAP Carica papaya 296 249 68 112 225 411 611
PLANT_DIC GLY_MAX Glycine max 422 354 139 220 353 529 768
PLANT_DIC MED_TRU Medicagao truncatula 245 245 59 78 149 334 550
PLANT_DIC POP_TRI Populus trichocarpa 375 292 101 167 306 490 732
PLANT_LYC SEL_MOE Selaginella moellendorfii 382 300 124 191 316 481 699
PLANT_MON BRA_DIS Brachypodium distachyon 428 303 146 223 361 537 788
PLANT_MON ORY_SAT Oryza sativa ssp. japonica 448 389 108 174 332 574 960
PLANT_MON SOR_BIC Sorghum bicolor 361 282 103 167 288 476 706
PLANT_MON ZEA_MAY Zea mays 345 258 97 164 286 455 655
RHODOPHYTA CYA_MER Cyanidioschyzon merolae 504 404 158 259 412 628 918
correlation applied only for bacterial genomes but not for complex organisms with large genomes. However, other potential explanations, like selection for smaller genes to increase the rate of duplication in genomes under a reductive process cannot be ruled out.
Size anomalies in the protein length histograms of different species
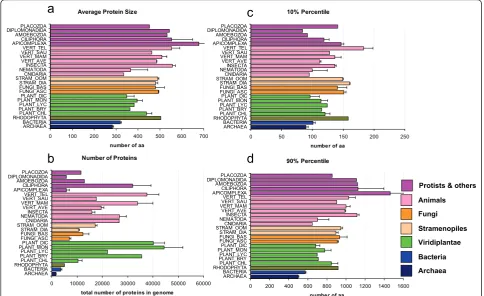
When protein length distributions in different species were compared in more detail, many common features were found (e.g. gamma type distributions), but also Average Protein Size
0 100 200 300 400 500 600 700 ARCHAEA
BACTERIA RHODOPHYTAPLANT_CHL PLANT_BRYPLANT_LYC PLANT_MONPLANT_DIC FUNGI_ASC FUNGI_BAS STRAM_DIA STRAM_OOMCNIDARIA NEMATODAINSECTA VERT_AVE VERT_MAMVERT_SAU VERT_TEL APICOMPLEXACILIPHORA AMOEBOZOA DIPLOMONADIDAPLACOZOA
number of aa
10% Percentile
0 50 100 150 200 250
ARCHAEA BACTERIA RHODOPHYTAPLANT_CHL PLANT_BRYPLANT_LYC PLANT_MONPLANT_DIC FUNGI_ASC FUNGI_BAS STRAM_DIA STRAM_OOMCNIDARIA NEMATODAINSECTA VERT_AVE VERT_MAMVERT_SAU VERT_TEL APICOMPLEXACILIPHORA AMOEBOZOA DIPLOMONADIDAPLACOZOA
number of aa
Number of Proteins
0 10000 20000 30000 40000 50000 60000 ARCHAEA
BACTERIA RHODOPHYTAPLANT_CHL PLANT_BRYPLANT_LYC PLANT_MONPLANT_DIC FUNGI_ASC FUNGI_BAS STRAM_DIA STRAM_OOMCNIDARIA NEMATODAINSECTA VERT_AVE VERT_MAMVERT_SAU VERT_TEL APICOMPLEXACILIPHORA AMOEBOZOA DIPLOMONADIDAPLACOZOA
total number of proteins in genome
90% Percentile
0 200 400 600 800 1000 1200 1400 1600 ARCHAEA
BACTERIA RHODOPHYTAPLANT_CHL PLANT_BRYPLANT_LYC PLANT_MONPLANT_DIC FUNGI_ASC FUNGI_BAS STRAM_DIA STRAM_OOMCNIDARIA NEMATODAINSECTA VERT_AVE VERT_MAMVERT_SAU VERT_TEL APICOMPLEXACILIPHORA AMOEBOZOA DIPLOMONADIDAPLACOZOA
number of aa
Stramenopiles
Bacteria
Archaea Viridiplantae Fungi Animals
a
b
c
d
[image:9.595.56.541.90.386.2]Protists & others
Figure 3Summary of protein number and protein size (set 1). Comparison of the protein length attributes in species from different phylogenetic groups. Species were grouped as indicated in Table 1. a) Average protein size. b) Total number of proteins in genome. c) Average of the 10% percentiles. d) Average of the 90% percentiles. Bars indicate mean values ± standard error (SE). In panels acd the x axis indicates the number of amino acids (aa), whereas in panel b it gives the average number of proteins in those species.
Protein Size (aa)
0 200 400 600 800 1000
0 200 400 600 800 1000 Protist
Fungi
Protein Size (aa)
0 200 400 600 800 1000
0 200 400 600 800 1000 Bacteria
Fu
ngi
Protein Size (aa)
0 200 400 600 800 1000
0 200 400 600 800 1000 Archae
Ba
ct
er
ia
Prokarote vs Prokaryote Prokarote vs Eukaryote Eukarote vs Eukaryote
a) b) c)
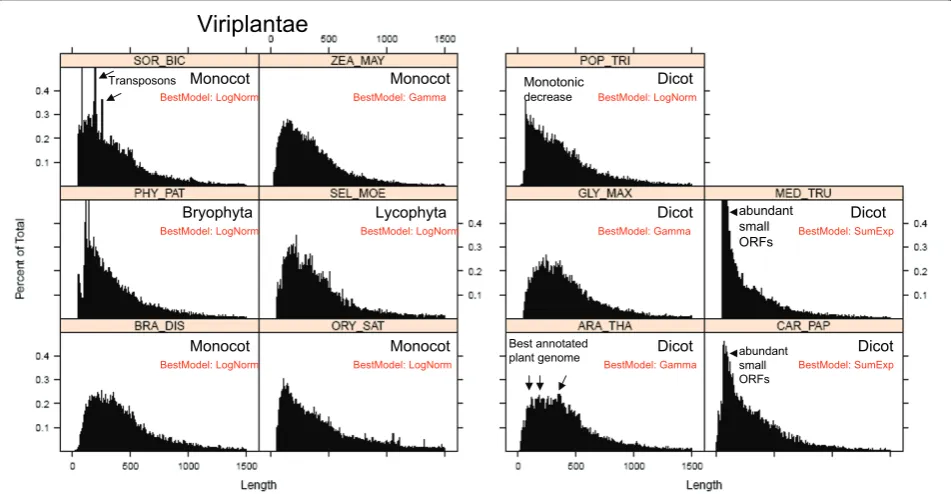
[image:9.595.59.540.529.690.2]some striking differences and anomalies (Figure 7, 8). For example, some proteomes contain several local max-ima, i.e. peaks in the range 200-400 aa (Figure 6, 7, 8, 9). In Arabidopsis thaliana, there was a first peak at 176 aa, a secondary peak at 238 aa, and a third peak at 363 aa (Figure 8). In Sorghum bicolor there were several pro-minent peaks of sizes 51 aa, 83 aa, 191 aa, 196 aa and 254 aa (Figure 8). The presence of several local maxima in some species could suggest that strong selective forces are able to increase the number of proteins of given sizes above the frequency predicted by the theore-tical models. More functional details of those protein peaks will be presented in a follow-up study.
Theoretical fit of protein length distributions
Finding the best fit of protein length distributions to well characterized mathematical models can offer insights about evolutionary trends, selective pressures and con-straints for protein function and structure [27]. Since protein stability is determined in part by length [28,29], the size of proteins has a selective advantage and there-fore, influences the evolution of proteomes in each line-age. One could assume that proteins smaller than 130 aa are less functional or less stable than proteins larger than 200 aa. Indeed, the need to explain the origin of large proteins was one of the major reasons for invoking gene or exon duplication in the starter-set hypothesis [10,30]. If size distributions can be explained by a simple
stochastic model without assuming massive gene or exon duplication; then, the random-origin hypothesis would be supported. If the same model applies for all species, one could also hypothesize that protein size has increased by the same evolutionary process that caused bacterial pro-teins to be larger than archaeal propro-teins.
Therefore it is important to find the model that most accurately describes the protein distribution in each of the selected species. We compared the following theoretical distributions: 1) gamma with fixed shape parameter 2) gamma distributions with no restriction of the shape para-meter, 3) the log-normal distribution, and 4) a distribution resulting from the sum of two exponential random vari-ables. For each theoretical function we estimated all the
parameters (see methods), and we obtained the Akaike’s
Information Criterion (AIC) for each fit for each species of set 1 (Additional file 1: Table S3) and set 2 (data not shown). For the species shown in Figure 7, 8 the model that had the lowest (most negative) AIC value is shown in small red letters. According to the AIC criterion the log-normal model best fits the data for 40 out of 84 species of set 1; the gamma model best fits the data for further 37 species and the sum of exponential model best fits the remaining 7 0
10000 20000 30000 40000 50000 60000 70000
0 200 400 600 800
Average protein length (aa)
Tot
al
num
be
r o
f pr
ot
ei
ns
Metazoa Alveolata Other Fungi Stramenopiles Viridiplantae Bacteria Archaea
r=0.29 r=0.39
PLA_FAL M ED_TRU
Eukaryots
Prokaryots
ORY_SAT HOM _SAP
Dataset 1
[image:10.595.304.538.87.320.2]r=-0.39
Figure 5Relationship between the total number of proteins in a genome and the average protein length (dataset 1). The average protein size (number of amino acids) was plotted against the total number of proteins in the genome of 9 archaeal, 24 bacterial and 51 eukaryotic species.
R2 = 0.1514
0 10000 20000 30000 40000 50000 60000
150 250 350 450 550 650 750
Average Protein Size (aa)
P
ro
te
in
N
um
b
er
Fungi Animals Protists Plants all
ecu tva
mpr pcb
pbe
ptm
tet
pfh
pkn tgo
pfa pvx
[image:10.595.57.293.89.320.2]Dataset 2
Eukaryotes only
Figure 6Relationship between the total number of proteins and average protein length in eukaryotes (dataset 2). The average protein size (number of amino acids) was plotted against the total number of proteins in the genome of 140 eukaryotic species. KEGG three letter code of highlighted species:
Moniliophthora perniciosa(mpr),Plasmodium chabaudi(pcb),
Plasmodium berghei(pbe),Encephalitozoon cuniculi(ecu),
Trichomonas vaginalis(tva),Paramecium tetraurelia(ptm),
Tetrahymena thermophila(tet),Plasmodium vivax(pvx),Plasmodium falciparum HB3(pfh),Toxoplasma gondii(tgo),Plasmodium knowlesi
species (Additional file 1: Table S3). In set 2, the best fit models were: log-normal (601 species), gamma free (699 species), gamma with fixed shape parameter (71 species) and sum of exponential (71 species) (data not shown).
In order to visualize the goodness of the theoretical fits, we plotted the models on top of the real data for a few selected species (Figure 10). In those figures one can easily observe that there are datasets for which the log-normal model fits very well but there are cases that other functions fit better (Figure 10). It can also be seen that although the models explain the sizes very roughly, there are many datapoints that lie outside the fitted models (Figure 10).
The shape parameter of the gamma function
Previous attempts to model protein size distributions had used a gamma distribution with fixed shape
parameter equal to 2 [14,18]. To examine the sound-ness of this assumption, we modeled gamma distribu-tions without the fixed shape parameter restriction, and then analyzed the estimated shape parameter in all species of dataset 1 (Additional file 1: Table S3) and dataset 2 (data not shown). The empirical distribution of the shape parameter for the gamma models had a mean of 2.3 in both data sets (Additional file 1: Figure S1). Using hypothesis testing from normal theory, we determined that the statistical feasibly of a fixed value
of 2 is negligible (p = 7.11 × 10⁻⁹). This means that
gamma models with fixed shape parameter equal to 2 are inadequate for describing protein size distributions. Thus, the shape parameter is not strictly 2 as earlier assumed by [18], but it can vary between the extreme values of 1 and 3 depending on the species (Additional file 1: Table S3).
Chlorophyta
Rhodophyta
Plant_Chl
Plant_Chl
Plant_Chl
Plant_Chl
Plant_Chl
BestModel: LogNorm BestModel: LogNorm
BestModel: LogNorm BestModel: LogNorm
BestModel: SumExp
[image:11.595.58.539.85.464.2]BestModel: Gamma
Modeling of size distribution can detect data outliers
In order to visualize the goodness of the theoretical fits, we plotted the models on top of the real data for a few selected species (Figure 9). In those figures one can observe datasets for which the log-normal model fits well but there are also cases for which other functions (e.g. the sum of exponential distribution) fit better (Figure 10). Although the models explain the sizes roughly, there are some extreme data points that lie outside the fitted curves (see size ~330 aa in Figure 9 MON_DOM and EQU_CAB).
The fitted values of the models can be used to esti-mate theoretical protein sizes based on the idealized functions. For example, the theoretical median size can
be estimated with the meanlog value (μ) of the
log-nor-mal function, whereas the expected value can be
calcu-lated with the meanlog (μ) and sdlog (s) (see methods).
The same general conclusions were obtained when com-paring the theoretical average and median values from the fitted models (data not shown) with the previous conclusions drawn from the arithmetic values (see Table 1 and Figure 3). Thus, the main conclusions from this study are robust and statistically reliable and not an arti-fact of extreme outliers or single size anomalies.
Modeling of size distribution can detect genomic annotation artifacts
Comparison of the fitted models between different spe-cies also allowed us to detect genomic releases that had
an aberrant distribution of protein sizes with very abun-dant occurrence of small ORFs (see Figure 8 MED_-TRU, CAR_PAP and POP_TRI). In those genomes, small proteins of size < 100 aa are more abundant then proteins of size 200 aa. As discussed below, mathemati-cal modeling could be used as a tool for discriminating genomic releases that have a better annotation of small ORFs (see discussion).
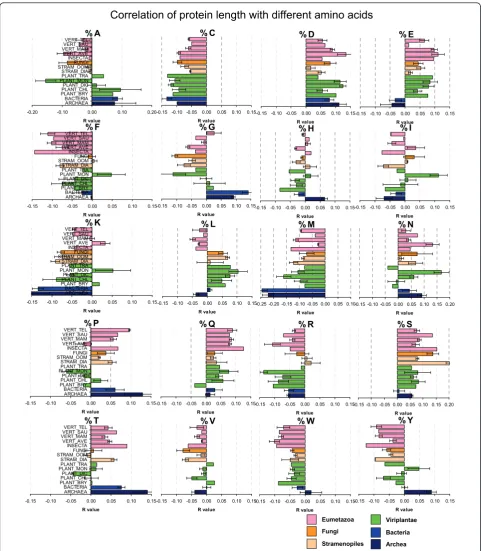
Amino acid bias depending on protein length
In addition to studying the length of proteins, we also investigated the amino acid (aa) composition in both absolute terms (occurrence) and relative amounts (per-centage occurrence). We asked whether protein length has any amino acid bias (e.g. if small/large proteins have more/less of any amino acid). Do small proteins contain more cysteines for stabilizing their structure? Do proteins from plant species have different properties from pro-teins of other phylogenetic groups? In order to answer these questions, we first calculated percentage aa compo-sition of each protein of a species, we then calculated the
Pearson correlation coefficientrof the 20 aa to protein
length (Figure 9). The obtained r values (negative or posi-tive) were then averaged across phylogenetic groups and plotted horizontally with error bars (Figure 9). There were marked differences between prokaryotic and eukar-yotic species. For example, glycine was positively corre-lated to protein length in prokaryotes but not in
Viriplantae
Monocot
Monocot Monocot Lycophyta
Dicot
Bryophyta Dicot
Dicot
Dicot Monocot
Dicot
BestModel: LogNorm BestModel: Gamma
BestModel: LogNorm BestModel: LogNorm
BestModel: LogNorm BestModel: LogNorm
BestModel: LogNorm
BestModel: Gamma BestModel: SumExp
BestModel: Gamma BestModel: SumExp
abundant small ORFs
abundant small ORFs
Transposons Monotonic
decrease
[image:12.595.60.536.90.337.2]Best annotated plant genome
% A
-0.20 -0.10 0.00 0.10 0.20 ARCHAEA
BACTERIA PLANT_BRYPLANT_CHL PLANT_DIC PLANT_MONPLANT_TRA STRAM_DIA STRAM_OOMFUNGI INSECTA VERT_AVE VERT_MAMVERT_SAU VERT_TEL
R value
% D
-0.15 -0.10 -0.05 0.00 0.05 0.10 0.15
R value
% E
-0.15 -0.10 -0.05 0.00 0.05 0.10 0.15
R value
% C
-0.15 -0.10 -0.05 0.00 0.05 0.10 0.15
R value
% F
-0.15 -0.10 -0.05 0.00 0.05 0.10 0.15 ARCHAEA
BACTERIA PLANT_BRYPLANT_CHL PLANT_DIC PLANT_MONPLANT_TRA STRAM_DIA STRAM_OOMFUNGI INSECTA VERT_AVE VERT_MAMVERT_SAU VERT_TEL
R value
% G
-0.15 -0.10 -0.05 0.00 0.05 0.10 0.15
R value
% H
-0.15 -0.10 -0.05 0.00 0.05 0.10 0.15
R value
% I
-0.15 -0.10 -0.05 0.00 0.05 0.10 0.15
R value
% K
-0.15 -0.10 -0.05 0.00 0.05 0.10 0.15 ARCHAEA
BACTERIA PLANT_BRYPLANT_CHL PLANT_DIC PLANT_MONPLANT_TRA STRAM_DIA STRAM_OOMFUNGI INSECTA VERT_AVE VERT_MAMVERT_SAU VERT_TEL
R value
% L
-0.15 -0.10 -0.05 0.00 0.05 0.10 0.15
R value
% M
-0.25 -0.20 -0.15 -0.10 -0.05 0.00 0.05 0.10
R value
% N
-0.15 -0.10 -0.05 0.00 0.05 0.10 0.15 0.20
R value
Correlation of protein length with different amino acids
% P
-0.15 -0.10 -0.05 0.00 0.05 0.10 0.15 ARCHAEA
BACTERIA PLANT_BRYPLANT_CHL PLANT_DIC PLANT_MONPLANT_TRA STRAM_DIA STRAM_OOMFUNGI INSECTA VERT_AVE VERT_MAMVERT_SAU VERT_TEL
R value
% Q
-0.15 -0.10 -0.05 0.00 0.05 0.10 0.15
R value
% R
-0.15 -0.10 -0.05 0.00 0.05 0.10 0.15
R value
% S
-0.15 -0.10 -0.05 0.00 0.05 0.10 0.15 0.20
R value
% T
-0.15 -0.10 -0.05 0.00 0.05 0.10 0.15 ARCHAEA
BACTERIA PLANT_BRYPLANT_CHL PLANT_DIC PLANT_MONPLANT_TRA STRAM_DIA STRAM_OOMFUNGI INSECTA VERT_AVE VERT_MAMVERT_SAU VERT_TEL
R value
% V
-0.15 -0.10 -0.05 0.00 0.05 0.10 0.15
R value
% W
-0.15 -0.10 -0.05 0.00 0.05 0.10 0.15
R value
% Y
-0.15 -0.10 -0.05 0.00 0.05 0.10 0.15
R value
Bacteria
Archea Viriplantae
[image:13.595.57.540.87.639.2]Stramenopiles Fungi Eumetazoa
Figure 9Protein length amino acid bias. Correlation of percentage amino acid composition with protein length were calculated for each
species individually (see Table S4). The pearson correlation coefficientsrwere then averaged according to taxonomic groups. Bars indicate mean
values and standard errors across species of the same taxa. Positive or negativervalues indicate the direction of the correlation (e.g. the amino
eukaryotic proteomes (Figure 9g), whereas the opposite was true for glumatic acid (Figure 9e). The r value was also different for other amino acids (Figure 9). Threonine had a high positive r value in archaea and bacteria, much less in animal species and almost a zero or negative value in plant species (Figure 9). Negative r values were found for cysteine, methionine, lysine, fenilalanine, tryptophan
and tyrosine, whereas positive r values were found for aspartate, glutamate, serine (Figure 9). Positive r values means either that longer proteins tend to have more from that particular amino acid or that short proteins tend to have less from that amino acid. The opposite is true for negative r values. For example, it seems that long proteins have less cysteine as expected, either because it
0 500 1000 1500
0. 0 000 0. 0 020 ARC_PRO Protein length fZ z Log-normal Exponential sums Gamma
0 500 1000 1500
0. 0 000 0 .00 20 BAC_SUB Protein length fZ z Log-normal Exponential sums Gamma
0 500 1000 1500
0. 0 000 0. 001 5 TRI_REE Protein length fZ z Log-normal Exponential sums Gamma
0 500 1000 1500
0. 0 000 0. 0 015 PHA_CHR Protein length fZ z Log-normal Exponential sums Gamma
0 500 1000 1500
0. 0 000 0. 002 0 MON_DOM Protein length fZ z Log-normal Exponential sums Gamma
0 500 1000 1500
0. 0 000 0. 0 020 EQU_CAB Protein length fZ z Log-normal Exponential sums Gamma
0 500 1000 1500
0. 0 000 0. 001 5 OST_TAU Protein length fZ z Log-normal Exponential sums Gamma
0 500 1000 1500
0. 0 000 0. 0 015 MIC_CCM Protein length fZ z Log-normal Exponential sums Gamma BestModel: LogNorm BestModel: Gamma BestModel: Gamma BestModel: LogNorm
BestModel: Gamma BestModel: LogNorm
BestModel: Gamma BestModel: LogNorm
0 500 1000 1500
0. 00 00 0. 001 5 ORY_SAT Protein length fZ z Log-normal Exponential sums Gamma
0 500 1000 1500
0. 0 000 0. 0 015 ARA_THA Protein length fZ z Log-normal Exponential sums Gamma
0 500 1000 1500
0. 0 000 0. 002 0 ZEA_MAY Protein length fZ z Log-normal Exponential sums Gamma
0 500 1000 1500
0. 0 000 0. 001 5 GLY_MAX Protein length fZ z Log-normal Exponential sums Gamma BestModel: Gamma
BestModel: LogNorm BestModel: Gamma
[image:14.595.61.539.85.564.2]BestModel: Gamma
Figure 10Fitting to theoretical distributions. Protein length distributions for 12 typical genomes: Archea (Archaeoglobus profundusARC_PRO),
Bacteria (Bacillus subtilisBAC_SUB), Eumetozoa (Equus caballusEQU_CAB,Monodelphis domesticaMON_DOM), Fungi (Trichoderma reeseiTRI_REE,
Phanerochaete chrysosporiumPHA_CHR) and Viridiplantae (Ostreococcus tauriOST_TAU,Micromonas CCMP1545MIC_CCM,Oryza sativaORY_SAT,
is detrimental for long proteins, or because cysteine helps to stabilize short proteins. The lowest r values were found for histidine and valine (Figure 9), meaning that those amino acids have rather a neutral effect on protein length.
Discussion
The overall goal of the study was to investigate how similar or dissimilar are protein sequences across differ-ent taxa of eukaryotic organisms. In this paper we focused on average protein length, protein number and amino acid compositional bias. We also tested the fit of the length distributions to different theoretical models. We determined the mathematical function that best fits the empirical distribution of protein size in each organism.
Protein length distribution has not been previously understood as a selective traitper se(i.e. it is not a char-acter that is directly selected for in classical evolutionary terms [31]). Individuals are selected for having inherita-ble units (e.g. genes or epigenetic states) whose products (e.g. proteins) confer a selective advantage to their car-riers and progeny. Protein features under direct selec-tion could include many, like the specificity and efficiency of a reaction when the protein is an enzyme, or the thermo-stability of the protein, among others [31,32]. Physicochemical restrictions must also play a role, for example, very small proteins might not fold properly, and the chances to evolve useful proteins are reduced for extreme sizes. Protein size directly affects the number of functions accessible to a polypeptide, and it is also indirectly associated to many features that are indeed under direct selection [31]. The actual shape of the protein length distribution in a particular genome has to be an interplay between mutation, recombination, fusion, fission, deletion, selection, physicochemical restriction and history. The challenge then becomes to explain how these factors have contributed each, to ori-ginate a particular distribution.
There are significant differences of average protein size in different eukaryotic species
Previous studies on the statistical distributions of the lengths of modern protein sequences have focused on prokaryotic species. It was already known that archaeal proteins are on average smaller than bacterial proteins [4,5]. Some preliminary surveys also concluded that pro-teins from eukaryotic species are larger than bacterial proteins. Brocchieri and Karlin (2005) analysed five eukaryotic species [5], whereas Zhang (2000) studied
only two eukaryotic species (Saccharomyces cerevisiae
and Caenorhabditis elegans) [4]. Since the analysis of few species can lead to severe statistical bias due to lim-ited sampling, we considered necessary to analyze
protein length in a much larger and diverse set of eukar-yotic species. We constructed large protein datasets of prokaryotic (set 1 n = 33, set 2 n = 1,302) and eukaryo-tic species (set 1 n = 51, set 2 n = 140), including fun-gal, animal and plant proteomes (Figure 1, 2). We then estimated size differences among all species (Table 1) and confirmed previous reports [4] (see above) that eukaryotic proteins are larger on average than bacterial and archaeal proteins (Figure 3). We show that average protein size could be due to an altered number of pro-teins or to an altered size of propro-teins within a functional KO category (Figure 4).
Furthermore, the large variability of eukaryotic protein length followed some phylogenetic relationships (Figure 3). Plant species had particularly small proteins among all eukaryotes (Figure 3). Simple animal organisms like Nematostella vectensis and Pristionchus pacificus had protein sizes that were similar to plant species (Table 1). We also found that unicellular eukaryotic organisms tend to have larger average sizes than multicelular spe-cies (Table 1). For example, the apicomplexa group has larger proteins than the group of vertebrates, whereas chlorophyta group has less but larger proteins than the other groups of plants (Figure 3). In order to confirm these observations we compared all unicellular eukar-yotes against all multicellular species of dataset 2 and found that the abovementioned differences were
signifi-cant for protein number (p= 9.6 × 10⁻¹²), GC content
(p= 0.0011) and protein size (p= 0.0018).
There are marked peaks but no marked gaps in the protein length distribution curves
After observing the strong size differences among phylo-genetic groups we analyzed the distribution curves to see how smooth and homogenous are proteins distribu-ted in size (Figure 7, 8). We detecdistribu-ted protein bins of 1 amino acid (aa) that were more frequent than expected by the theoretical models (Figure 9). Gaps in the distri-bution curves would have indicated that there are pro-tein sizes that are prohibited by structural or functional reasons. For example stably functional proteins can be formed by the very common structure of an
eight-strandeda/bbarrel (TIM barrel) [33-35], but there are
no reported functional proteins that have five or ninea/
b strands [36,37], and thus one could expect gaps at
given size intervals. Since ~200 aa residues are required
to fully form a TIM barrel (each a/bstrand consists of
observed, which corresponded to data outliers in the fitted models (Figure 9). This can be explained by mas-sive duplication of particular genes. Most noticeably, all mammal species had a very prominent single peak of size ~332 aa in the distribution curves (Figure 9 MON_-DOM and EQU_CAB). In plants, some prominent peaks were due to multiple copies of transposon-encoded pro-teins like the 191 aa peak in Sorghum bicolor (Figure 8). The significant deviations from the idealized functions, and the strong differences of the distributions among dif-ferent organisms, indicates that protein length distribu-tions are strongly influenced by specific selective pressures. One of the evolutionary mechanisms is gene duplication and subfunctionalization leading to large gene families. An example for selective pressure for gene duplication is the need for a large repertoire of olfactory receptors in mammal species [32], leading to large increase of proteins with length = 332 aa (Figure 9).
The theoretical models that best describe the distribution of protein length are the log-normal function and the gamma function with unrestricted shape parameter
Finding the best fit of distributions to known mathema-tical models can offer some useful biological insights. Protein length analyses of modern species not only could provide clues to better explain the origin of primi-tive proteins [14], but it can also provide valuable infor-mation on selective pressures that have prevailed during evolution. A good fit to a gamma function had been previously used to sustain the hypothesis that proteins evolved from random nucleotide sequences [18]. The gamma function with shape parameter 2 describes a probability density function that results from the com-bined action of two independent random variables
expo-nentially distributed with parameters a > 0 andb > 0
respectively. A simple theory for this theoretical distri-bution is that the occurrence of stop codons in a ran-dom nucleotide sequence leads to exponentially distributed protein lengths, whereas selective pressure for protein stability, folding capacity, and potential bio-chemical activity is dependent on sequence length, so that small proteins (< 100 aa) have a limited potential for a useful biological function, and thus are rather dis-carded or negatively selected for [18].
However, the assumption of a fixed shape parameter 2 had to be rejected on statistical grounds (Additional file 1: Figure S1). The lognormal function had a better fit in 48% of the species, making it almost equivalent to the gamma function with free shape parameter. Further-more, the sum of exponential functions had a better fit in only 8% of the species, particularly of recently sequenced genomes with not so long history of curation and manual annotation. It can be concluded from all previous results that the theoretical model that better
describe protein size distribution is the gamma function with unrestricted shape parameter.
Why do genomes have a protein size distribution different from the theoretically expected?
The genetic code allows making some theoretical pre-dictions about average protein size and frequency distri-bution [7,8,38]. Since stop codons can appear stochastically after any start codon, then larger proteins should always be less frequent than smaller proteins. The most frequent protein sizes should be 1 aa in length [7]. However, distributions of well annotated genomes
such asArabidopsis thaliana do not decrease
monotoni-cally but rather increase sharply at about ~80 aa, peak several times in the range of 150-250 aa and then decreases gradually (Figure 7, 8). In most genomes, teins of size 151-250 aa were more frequent than pro-teins of size 51-150 aa and even more than propro-teins of size 1-100 aa (Figure 7, 8). One can interpret this as evi-dence of a selective pressure for the avoidance of pro-teins smaller than 100 aa and the selective advantage of functional proteins of > 250 aa. The characteristic increase of proteins in the range 50-200 aa can be explained with the abovementioned selection force, whereas the monotonic decrease of frequency in the range 500-1,000 aa can be explained by the probable occurrence of stop codons in the coding determining sequence (CDS).
If one considers simple models, the average protein size should be ~21 aa [7]. If one considers more sophis-ticated models explaining the length of random open reading frames (ORFs) in the intergenic regions of yeast [8], random ORFs of ~33 aa can be explained by the mummy and baby ORF theory alone [8,39]. However, the average eukaryotic protein is much larger than 100 aa (Table 1). We assume that the frequent occurrence proteins of size 150-250 aa is due to protein folding sta-bility (for example TIM barrels) that generates a selec-tive pressures avoiding stop codons within exons or genes. We postulate that this force is so strong in eukar-yotic species, that it overcomes the influence of the GC content of DNA on average ORF length as indeed found in prokaryotic genomes.
Since most prokaryotes (archaea and bacteria) lack introns, the fact that eukaryotic proteins are much lar-ger can be explained because proteins usually are encoded in multiple exons [40]. In follow up studies we will analyze how the statistical frequency of stop codons limits the maximal protein length in prokaryotic species that do not have splicing mechanisms.
Limitations for the occurrence of small proteins
genomes but not in others? Is it the result of bioinfor-matic annotation procedures? In the yeast genome, many ORFs < 100 aa are likely non-coding or over annotated [41]. Some genomic annotating algorithms are instructed to ignore small open reading frames with a minimal cutoff of ~33 aa in order to limit the number of false positive ORFs [42]. Some proteomes show clearly such drastic cutoffs in the range of 20-60 aa (Fig-ure 7, 8). Small proteins could have important biological functions, however there is a statistical justification in that smaller proteins are more difficult to predict than larger ones [42]. Therefore, the definition of cut off lim-its the number of false ORF predictions. A cutoff increase from 21 aa to 33 aa might be supported by the mummy and baby ORF theory [8]. Sophisticated mea-sures of nucleotide bias at the DNA level (asymmetry in the composition of the first and the second positions in the codons) can help to detect spurious non-coding ORFs in the yeast genome [41]. However, we propose using additional bioinformatic tools at the protein level, such as mathematical modeling and amino acid bias to exclude false positive small ORFs rather than defining an arbitrary cutoff of protein size. For example, from two equally small proteins, it is more likely to be func-tional the one that contains more %C, %M, %K, %F, %R, %W and %Y and less %D, %E, %Q, %S and %T (Figure 9). The importance of amino acids like C is not surpris-ing, since cisteine bridges stabilize the structure of small proteins.
Biological functionality of small proteins
As previously mentioned, the protein length distribution of most eukaryotic organisms is not monotonically decreasing, but increases from 1-200 aa (see Figure 7, 8). What determines the minimal size of a biologically active protein? Is it the function, the structure or the capacity to be regulated? Finding a biochemical explana-tion for a threshold of small proteins is neither simple nor trivial. An active site of an enzyme typically consists of only 3-5 amino acid residues correctly accommodated in space [1]. If enzymatic catalysis can be carried out by only so few amino acids, then the remaining residues (> 97%) of eukaryotic proteins are maybe only for accom-modating those catalytic residues correctly in space and for spatial filling. The smallest known enzymes are about 10 kDa (~100 aa) in size with some extreme cases like an enzyme of 62 aa that forms a stable homopenta-mer (5 × 62 aa = 310 aa) [43]. Thus it seems that even the smallest enzymes achieve stable folding and regula-tory features only when more than 200 aa residues interact spatially. Proteomic surveys show that the most abundant proteins in SDS-PAGE gels of plant extracts are in the range of 20-60 kDa (~200-600 aa) with very few proteins appearing in the range below 10 kDa (data
not shown). Most enzymes form quaternary structures of several polypeptides, for example the often found di-mers or tetra-di-mers (http://www.expasy.org/).
From the bioinformatic survey of eukaryotic organisms (n = 140) we conclude that the range of 150-250 aa is the optimal length for a biologically active polypetide. Does that represent a waste of resources? Probably not, since a minimal size of > 200 aa might be required for conferring regulatory properties to enzymes and pro-teins. More work and deeper studies are needed to address such open questions on enzymatic function and biological capabilities of small proteins.
What limits the occurrence large proteins in plants?
We found that there are not so many long proteins in plants (Figure 3). But, why? We found that plant pro-teins are on average encoded by less exons than in ani-mal genomes (data not shown). What limits a more frequent appearance of multi-exon genes in plants in comparison to animals? Is there any metabolic efficiency and amino acid composition in plant proteomes? Bio-synthetic cost-minimization of bacterial proteins has been postulated as an explanatory hypothesis for differ-ences in evolutionary fitness [44]. In bacteria, it has been shown that the energetic advantage of using differ-ent amino acids for highly expressed genes can be a substantial proportion of the total energy budget [45]. Is there cost-minimization of amino acid usage in plant proteins? Or is the reason the appearance of more com-plex proteins in animals. Plant genomes have numerous genes, but it seems that the average plant protein is not only smaller but it is also encoded by less exons, thus suggesting that sequence length differences could reflect a difference in protein multi-functionalities between plant and animal proteins. More work is required for the analysis and comparison of the multiplicity of PFAM and Interpro domains in plant and animal pro-teins in order to statistically test such hypotheses.
Is there an universal evolutionary trend towards larger proteins?
steady trend for size increase in all organisms. Some phylogenetic groups had larger proteins while others had smaller proteins, and this is not related to the evo-lutionary time of emergence of those eukaryotic lineages. Most noticeably was the extreme variability of protein size and protein number in protist species (Fig-ure 6). This indicates that protein size can depend greatly on short-term environmental adaptations.
Among eukaryotes, there was an indirect relationship between total protein number and average protein size (Figure 5, 6). It is therefore tempting to speculate that proteins can fuse together, so that many small proteins can become fewer larger proteins. This could be because some organisms have better a adaptation when they have less but more multifunctional proteins (larger size), while other species are better adapted to specific envir-onments, when they have more but less multifunctional proteins (smaller size).
In a nutshell, compared to prokaryotic species, eukar-yotic proteomes have been shaped by distinct evolution-ary forces that have favored massive gene duplication events (increase of protein number) and domain addi-tion (increase of average protein size).
The shape of histograms and the fit to theoretical distributions could be indicative of the efficiency of the bioinformatic procedures for annotating small proteins
As shown in Figure 7, 8, the empirical distribution of protein lengths for many species show the characteristic shape of a log-normal or a gamma function. However, there are some exceptions. For example, the protein size
distribution in Chlamydomonas reinhardtii(CHL_REI)
is monotonically decreasing from 50 aa to 250 aa (best fit to sum of exponentials model) whereas all other algae show a characteristic increase in that range (Figure
7). The same is true for the histogram of Medicago
trunculata(MED_TRU) andCarica papaya (CAR_PAP) in comparison to other dicot species (Figure 8). In com-parison, the histograms of well characterized plant
gen-omes like Arabidopsis thaliana (ARA_THA) and Zea
mays (ZEA_MAY) show a typical gamma distribution
(Figure 8). It seems therefore plausible to suggest that the bioinformatic procedures that were used for anno-tating small proteins in the genomes of CHL_REI and MED_TRU were not as accurate as the procedures that were implemented in other plant species.
Considering these preliminary observations, we would like to speculate on the following: the most crude bioin-formatic procedure simply detects all possible ORFs along the six frames of the genomic DNA sequence. This generates a protein size distribution that is mono-tonically decreasing (Figure 11). In order to filter out false positives, a sharp threshold is generally defined for ORFs smaller than 21-33 aa (randomly expected mean
size). This generates a distribution that is similar as the one observed for MED_TRU (Figure 8). As more sophis-ticated procedures are applied for the detection of ORFs, the size distribution changes from a sum of exponen-tials, to a gamma or a log-normal function (Figure 11). A well annotated proteome will then generate a typical
gamma distribution for protein size as observed for
Ara-bidopsis thaliana, Glycine maxandZea mays(Figure 8). More work is required to optimize bioinformatic pro-cedures for correctly discriminating ORFs of biological active proteins and therefore filtering out false positives and baby ORFs of small size. One strategy would be to measure the nucleotide bias of the first and second codon positions [41]. Another complementary strategy would be to use the amino acid bias information in dependence of protein length and taxonomy (Figure 9) in order to discriminate baby ORFs from mummy ORFs [8]. Comparing the empirical size distribution to a log-normal or gamma function could then indicate how well a genomic release has been annotated.
0 100 200 300 400
0.
0000
0.
0005
0.
0010
0.
0015
0.
0020
0.
0025
0.
0030
0.
003
5
Protein Size (aa)
F
requenc
y
Log Normal
Gamma
Sum Exp
[image:18.595.305.539.86.310.2]Monotonic Decrease
There are some significant amino acid bias depending on protein length and on species
It has been reported that the isoelectric point (pI) of proteins has a bimodal distribution, with very low frac-tions of proteins with pI close to 7.4 [46,47]. When all proteins are analyzed together, there is no correlation between protein size and pI values [46]. When acidic or basic proteins were analyzed separately, the correlation coefficient between protein size and pI was positive (r = 0.15) for the acidic set of proteins and negative (r = -0.25) for the basic set of proteins [[45] There is also a negative correlation between the pI bias of proteins and the genomic GC content [46]. We therefore asked whether protein size is correlated to the occurrence of certain amino acids influencing the pI values.
Previous studies have reported that there is a depen-dence of amino acid frequencies on sequence length [29]. Using a non-redundant set of only 2,275 proteins they found that the frequency of cysteine (C) increases dramatically for sequences shorter than 100 amino acids. It was also reported that arginine (R) and Lysine (K) frequencies increase for short sequences whereas aspartate (D) and glutamate (E) frequencies decrease [29]. In our datasets based on over 1.2 million proteins, we observed that the correlation of protein length with percentage amino acid composition is variable and not as restricted as postulated earlier [29]. Protein length correlates negatively with %C, %M, %K, %F, %R, %W, % Y (Figure 9). Positive correlations where detected for % D, %E, %Q, %S and %T (Figure 9). Rather variable, small or no significant correlations were found for %H, %I, and %V (Figure 9). It is noteworthy to mention that pro-tein size correlated negatively with the basic amino acids (K and R) and positively with the acidic amino acids (D and E). This agrees with previous reports on the bimo-dal pI distribution, where acidic proteins are signifi-cantly longer than basic ones [46].
There are also some strong differences among phylo-genetic groups. In archaea and bacteria, marked differ-ences were found for the amino acids %E, %G, %K, %M as compared to the observed values in other eukaryotic groups (Figure 9). The positive correlation of %G is in accordance to the occurrence of large glycine rich pro-teins in bacterial genomes, a feature that seems specific for bacteria but not for eukaryotes (Figure 9. Thus, pro-karyotic and eupro-karyotic proteins not only are different in size (Table 1 and Figure 2), but have also a different amino acid composition in dependence on protein length (Figure 9).
Interestingly, there were also some differences between plant groups. In monocot plants, protein length correlated negatively with %A, %G, %P. This was not the case in the dicot plant group. The opposite effect was observed for other amino acids where in monocot
plants, protein length correlated positively with %F, %I, %K, %N. The reason for this is also unknown and should be investigated in more detail in follow-up stu-dies. What is clear is that bacterial, animal and plant proteins have not only different average sizes, but have also specific biases towards different amino acids.
Conclusions
In the present study, we demonstrate that proteins of different phylogenetic groups have different mean lengths. Some groups of species (e.g. protists, ciliophora, chlorophyta) have larger proteins than other groups of species (e.g. cnidaria, nematoda, placozoa, metazoa, viri-diplantae). We found variable relationships between pro-tein size, propro-tein number or genomic %GC content. Among eukaryotes, protein number and protein size are negatively correlated (Figure 5, 6). The theoretical model of a gamma distribution with an unrestricted shape parameter can be a valuable tool to study protein evolution and to optimize automatic ORFs annotations.
Plants have usually more proteins in their genomes than animal species, but animal proteins are on average much larger. One possible reason for plants having smaller proteins than most animal species could be that plant proteins are encoded by less exons on average. We speculate that evolutionary forces related to func-tional domains in eukaryotic proteins explain the distri-bution of protein size in eukaryotes, but these hypotheses need to be tested statistically in some fol-low-up studies.
Outlook
A comprehensive understanding of protein size across all taxonomic groups is relevant in the context of syn-thetic biology, which aims to construct minimal gen-omes and organisms. In addition to finding the minimal set of genes that are required to build a living cell (mini-mal number of proteins), it is also important to design synthetic proteins with minimal size (minimal aa usage) that still perform the desired biological function. Multi-domain proteins and multi-functional enzymes could be attractive strategies for synthetic DNA minimization.
Methods
Protein datafiles set 1