Control Design Toolbox for Large-Scale PRVS Wind Turbines
Sergio Dominguez and Prof. W.E. Leithead
Abstract— The trend towards large multi-MW wind turbines has given new impetus to the development of wind turbine con-trollers. Additional objectives are being placed on the controller making the specification of the control system more complex. A new toolbox, which assists with most of the control design cycle, has been developed. Its purpose is to assist and guide the control system designer through the design cycle, thereby enabling faster design. With the choice of control strategy unrestricted, the toolbox is sufficiently flexible to support the design process for the aforementioned more complex specifications.
Keywords: Fatigue loads, feedback, control, pitch,
funda-mental limitations, right half-plane zeros, time delay, band-width
I. INTRODUCTION
In recent years, with the trend towards large multi-MW wind turbines, the role of the control system, and so its design, has become increasingly important. The realisation, that not only the performance of the machine but also the optimisation of the structural design depends on the controller has given research into the control of wind turbines a new impetus as is evident from the recent increase in publications addressing this issue. The extension of the role of the controller to alle-viate structural loads has motivated the exploration of novel control strategies, which seek to maximise load alleviation by exploiting the blade pitch system. Wind turbine controllers are consequently attaining a degree of complexity such that advanced control methods are required. The design of the controller for a wind turbine is no longer a simple task that can be carried out by a non-specialist. The range of existing machines, for instance the variation in the drive-train characteristics, has the consequence that the controller must be tailored for the specific machine being considered if maximum performance and load alleviation are to be achieved. It is no longer advisable to adopt a particular controller and then tune it for different machines. The direct relationship between the dynamics of the machines and the dynamics of the controller and the effect the latter can have in modifying the former, implies that control should be an integral part of the design process of a wind turbine from its earliest stage. The purpose of this paper is not to discuss a general controller for wind turbines, but to introduce a toolbox that enables the control designers within the wind turbine manufacturers to optimise their task.
Sergio Dominguez is with the Kelvin Institute, City Park 368 Alexandra Parade Glasgow G31 3AU, UK. e-mail:
Prof. W.E. Leithead is the Director of the Industrial Control Centre, University of Strathclyde. 50 George St, G1 1QE Glasgow, UK. e-mail:
The design of a control algorithm has four stages; construc-tion of suitable dynamic models of the wind turbine, design of the set of controllers required to cover the operational en-velope, determination of a suitable realisation that addresses the implementation issues (including the non-linear aspects) and evaluation and performance assessment of the controller. The design cycle is thus extensive and includes several well-defined stages for which different specific skills are required. At the University of Strathclyde, in collaboration with the Kelvin Institute (KI), a new toolset has been developed which assists with three of the above stages of control design. Incorporating a particular implementation structure for the controller, the Control Design Toolbox guides the control designer through the following aspects: the construction of dynamic models for a particular wind turbine using generic models requiring only the assignment of suitable physical parameter values; the design of the set of linear controllers over the operational envelope with sufficient flexibility to cater for any control strategy that the designer might choose; the interfacing with some of the most commonly-used wind turbine simulation packages to facilitate rapid prototyping and tuning of the controller.
The organisation of this paper follows the aforementioned stages of the control design process: Section II describes the
model embedded in the Control Design Tools c(CDT);
Sec-tion III defines the facilities of theCDTrelated to the design
of the linear controllers for the different operating modes; Section IV deals with the non-linear design aspects of the controller; Section V describes the set of tools dealing with controller implementation issues and the implementation of the controller in programmable form and its debugging; SectionVI discusses the tools which interface with the aero-elastic packages on which the controller performance might be evaluated and the post-processing capabilities included for this purpose; lastly, Section VII draws some conclusions from this paper and outlines some future research lines.
II. MODELLING
parameter files used for FLEX1 and Bladed2, which makes the construction of the simulation model straight-forward when one of these models is available. The simulation model assists with solving the non-linear aspects of the controller implementation. It serves as a test-bed for controller designs. In addition, the simulation model enables the sensitivity and dependence of dynamic behaviour on physical parameters to be investigated. It, thus, supports a more complete in-vestigation of the control design task and enables greater insight and understanding of it to be developed. Nevertheless, a rule of parsimony must be maintained since the analysis of non-linear systems becomes increasingly difficult the more detailed they become.
The simulation model for a wind turbine has a very different role to a full aero-elastic package. Only those aspects of the structural dynamics of direct relevance to the control system design task are included. For example, it can not be used to assess the fatigue of components absolutely. When the control specification includes a fatigue aspect, only a relative assessment is required or practical. Hence, only basic models of the relevant dynamics are used. The controller design process is often iterative involving the investigation of several candidate designs. Once this process nears completion, a fuller assessment using a detailed aero-elastic model becomes appropriate and necessary.
As alluded to above, the analysis of a non-linear dynamic system is not easy. The linearisation of the control simulation model is employed to assist with this analysis. It consists of a set of linear dynamic models, each valid in the neighbour-hood of some operating point. They provide a bridge between the simulation model and the control model.
III. LINEARDESIGN
A. System Identification
A fundamental part of the modelling process is the validation of the model against the real system. However, this is a difficult and laborious process for which, in the context of validating the models for a real wind turbine, there is as yet no clear procedure. The KI, building on previous experience of wind turbine System Identification, see [1], has developed
a procedure for system identification based on FLEX and
Bladed. The models embedded in the CDT can, thus, be
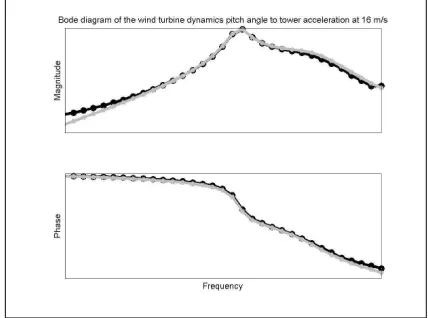
adjusted to be a very accurate representation of the models included in these two widely accepted aero-elastic simulation packages. The procedure exploits frequency-domain system identification methods [2]. Although it has currently only been applied to the afore-mentioned aero-elastic packages, there is no a priori reason why it should not be applied to a real machine. Some identification results are shown in Figures 1 and 2, which depict the dynamics from pitch angle to tower speed and generator speed obtained from both the
1FLEX is an aero-elastic package developed at Delft University and is
one of the most widely used packages used for wind turbine design and evaluation
2Bladed is an aero-elastic package developed at Garrad-Hassan and is
one of the most widely used packages used for wind turbine design and evaluation
[image:2.595.311.525.103.262.2]linear models and from applying the system identification procedure to the aero-elastic packages. The close agreement is clear.
[image:2.595.312.525.316.477.2]Fig. 1. Comparison of the dynamics from pitch angle to tower speed for the identified FLEX dynamics and theCDTlinear model
Fig. 2. Comparison of the dynamics from pitch angle to generator speed for the identified FLEX dynamics and theCDTlinear model
B. Fatigue estimation via linear transfer functions
certain characteristics that reduce the effectiveness of these methods.
It is well known that the integral of the power spectral density
(PSD) provides a rough estimate of fatigue [7], [8], which,
while not providing accurate estimates of absolute fatigue damage, is quite useful in assessing the relative influence of different controllers on fatigue. If a frequency domain signal is the product of a transfer function times another frequency
domain signal, then the PSD for the first signal, is the PSD
for the second signal scaled by the squared magnitude of the transfer function; that is, for the situation depicted in Figure 3, the spectra are related by
Sy=|G(jω)|2·Sx (1)
x(t)
-G(s) y(t)
-Fig. 3. Block diagram including disturbances
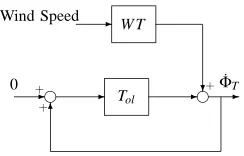
The frequency domain output for a closed-loop system is the frequency domain output for the open-loop system scaled by a transfer function; for example, when a feedback loop is used to actively regulate tower loads, the tower speed is modified by the tower feedback loop sensitivity function, see Figure 4.
0 -+
f - Tol -f
-˙
ΦT
Wind Speed - W T
?+
[image:3.595.308.529.53.241.2]6 +
Fig. 4. Block diagram including disturbances
This simple rescaling of PSDs can be exploited to provide
quick and direct estimates of loads arising from different controllers, e.g. the tower loads, and thereby, assist controller
tuning. This procedure is included and automated in theCDT
having proved in practice to be a good guide to controller tuning.
C. Estimation of RMS values of output variables
Parseval’s Theorem [9] states that the integral of thePSD of
a frequency domain signal is equal to the variance of the corresponding time domain signal. Hence, when the spectral density function is available, an estimate of the variance of the corresponding time domain signal can be determined by following the above procedure; for example, the variance for the generator speed or electrical power obtained by a particular controller. Once again, these estimates are not to be used as absolute measures of performance, but as relative measures. This procedure is also included and automated in
the CDT .
Rotor Speed
Torque
Torque−Rotor Speed
T
0
T1 T
qset
ωmin ωset
1st Constant Spd. region
Cpmax Tracking region
2nd Constant Spd. region
Fig. 5. Below rated classical strategy
D. Control Limitations
As previously reported, see [10], the achievable closed-loop bandwidth of the pitch control algorithm becomes more restricted as the size of the wind turbine increases. These unavoidable restrictions are due to the presence of right half-plane zeros in the dynamics connecting generator speed to pitch angle. In [10], a procedure for estimating the maximum achievable bandwidth for any particular wind turbine is developed. This procedure has been included within the
CDT . Because it requires only a small number of physical
parameters, the procedure provides useful guidance regarding the controller performance at an early stage of the design cycle.
E. Linear Controller Design
The availability of linear models obviously facilitates the design of linear controllers. Assuming that the non-linear aspects and implementation issues are resolved through the realisation adopted for the controller, only local linear controllers for a specific set of wind speeds remain to be designed. The design of these local linear controllers can then be addressed without further reference to the wind turbine context. In general, the individual controllers for wind turbines are quite low order, and in most cases a simple
PIcontroller, in combination with some filters to mitigate
par-ticular frequency related features, is effective. Consequently, the design of the linear aspects of the controller tends to be straightforward. A generic realisation for the controller, that resolves the non-linear aspects and implementation issues,
is incorporated within the Integrated Control Platform (ICP)
described below.
The linear design process for the controller is supported in
theCDTby the inclusion of a dedicated linear control design
interface to MATLAB and the wind turbine control models. This interface permits a flexible choice of controller struc-ture, thereby, avoiding unnecessary restrictions on controller design. A snapshot of the linear control design interface
[image:3.595.95.217.391.469.2]control system feedback structure, a comprehensive choice of plant input and output variables is available through the GUI with the individual control elements entered using the dialogue boxes to the left of Figure 6. The usual control design and analysis options are available, open and closed-loop analysis, sensitivity analysis, frequency domain plots, time domain plots, etc: all options are readily accessible from the Control Design GUI for any combination of control system inputs and outputs that might be of interest. When designing the individual control elements, the modification to the open loop dynamics, that would arise from changes to the controller parameters, can be explored through an interactive menu with a pole/zero drag-and-drop facility.
IV. NON-LINEARDESIGN
A. Gain scheduling
In above rated conditions, when the wind turbine is being pitch controlled, the aerodynamic torque can be separated into two components. The first component is a function of the wind speed and the second is a function of the blade pitch angle and rotor speed. This separation enables a global linearisation of the aerodynamic non-linearity by means of a non-linear gain in the controller independent of wind speed. A linear control design undertaken at a specific wind speed is, thereby, valid for all above rated wind speeds.
The CDT includes a tool that, given the wind turbine plant
dynamics for the different wind speeds, determines the above linearising non-linear gain. Assuming that the controller maintains an almost constant rotor speed in above rated conditions, the dependence of this gain on rotor speed can be ignored. Its inclusion in the controller is, formally at least, very similar to classical gain scheduling yet is globally linearising. Nevertheless, it is not sufficient just to include this linearising gain in the controller. Its location is important to ensure accurate compensation of the non-linear dynamics of the rotor. Moving its position can cause a marked de-terioration in performance. The linearising gain is correctly implemented within the ICP to ensure precise cancellation of the non-linearity over the whole above rated operating range, thereby preserving the relevance of the linear analysis.
B. Operational curves
A fundamental aspect of the control design task is the choice of operational strategy for the wind turbine. The chosen strategy in essence defines the overall control objective; that is, the controller must cause the wind turbine to follow the strategy. The most typical operational strategy for PRVS machines, at which this tool is directed, is similar to that depicted in Figure 5. This simple strategy is currently stan-dard in the industry and its description can be found in a number of sources, see for example [11]. However, modified versions of it are extant such as the reduction in the controller set-point at high wind speeds.
As seen from Figure 5, the operational strategy can be defined with respect to the set of switching points in the torque-speed plane. Outcomes that arise directly from the definition of this strategy are the ideal power curve for the
wind turbine, the steady state operating points and loads and the energy capture that is, of course, dependent on the
site wind speed distribution. TheCDTincorporates this basic
strategy as the default strategy but it can be modified when required. It is straightforward to input all the parameters necessary to specify the operational strategy and obtain the corresponding outcomes. The outcomes are made available during system performance analyse, Section VI, to enable automatic comparison of these theoretical measures of per-formance to those obtained from evaluating the perper-formance of the controller by means of the aero-elastic packages.
C. Annual Power and Energy Capture curves
Given the wind turbine aerodynamic characteristics, the oper-ational strategy and the wind distribution of the site at which the machine is located, the nominal annual power and energy capture curves to benchmark the controller performance are
readily obtained using theCDT. The post-processing analysis
capability to provide comparable results from the aero-elastic packages simulations is discussed in Section VI.
D. Switching
The simulation model supports the implementation and rapid testing of different switching strategies. Measurement of the performance of different switching strategies is not trivial.
Within the CDT two measures of performance are used,
the ITSE and the ITE. These two measures of performance
measure the speed at which the controlled system attains steady state in response to a step change. Therefore, in order to measure switching performance, the system must be subject to a wind speed step input that causes a change in operating region of the wind turbine, e.g. from below rated to above rated. Whereas the ITSE penalises more the long term deviations from the equilibrium state, the ITE penalises more the initial overshoots. Hence, a trade-off between both measures of performance might be necessary on a case-by-case scenario basis. The traditional form of these measures, widely used in the control literature to measure switching systems, need a small adjustment to work in this context due to the controllers for the wind turbine being type 1.
V. IMPLEMENTATION
A. Integrated controller platform
Ideally, the non-linear and linear design aspects of the wind turbine controller would be undertaken separately. To achieve this, one approach is to make use of a platform within which generic solutions to the non-linear design issues, that render the wind turbine control difficult (gain-scheduling, switching and rate constraints), are embedded. The individual linear controllers would be designed independently for insertion into the platform without any contingencies, in particular, without loss of performance from unexpected interactions. Just such a platform is the integrated controller platform
(ICP) developed by the KI. It is integrated into theCDT.
TheICPis sufficiently flexible to accommodate a broad range
ICP
Controller Strategy Non-linear Aerodynamics
Switching Strategy
Rate Constraints
Linear A/R
[image:5.595.310.527.51.223.2]Linear B/R
Fig. 7. Integrated controller platform
the control strategy, which is an input into the ICP, see
Section IV-B. Once the wind turbine details and the operating strategy are specified, the individual linear controllers for the different operating regions, can be determined using the Control Design GUI, see III-E. These linear controllers are
external inputs to theICP, see Figure 7, and can be designed
independently using any preferred design tool.
B. Implementation aids
Once the controller is fully designed within the context of the
CDTthe final step is to fully test it in an aero-elastic
environ-ment. These environments normally permit simulation with the controller implemented externally in .dll form or coded in a programming language of choice. In order to ease the transition from the Simulink [12] development environment
to the aero-elastic environment3, the CDT enables direct
testing of the code for the controller under Simulink using a MATLAB [14] s-function. It can thereby be checked that the implementation of the controller in code produces the same
results as the implementation in Simulink blocks.4
VI. PERFORMANCE ANDPOST-PROCESSING
A. Rain-flow counting
As mentioned before, the rain-flow counting algorithm is generally recognised to provide the best estimates of fatigue damage. A MATLAB rain-flow counting algorithm running
based on the WAFO, see [15], is included in theCDTgiving
the capability not only of estimating the life-time fatigue damage from a given simulation, but of comparing the per-centage reduction in fatigue from running the simulation with different controllers or configurations of the wind turbine. Estimates of the contribution of every wind speed to the overall fatigue damage are also provided.
B. Level-crossing/binning
When dimensioning gearboxes, fatigue is not the main driver. Rather it is the time the input torque to the gearbox stays at the different load levels. A tool to quickly analyse the input loads to the gearbox and, therefore, give a first estimate of the effect of different controllers on the gearbox, is available
within theCDT .
3MATLAB Real Time Workshop enables automatic code generation from
Simulink models [13]
4An interface to have the controller in Simulink running under the
aero-elastic packages FLEXand BLADED is under development, although not fully functional
0 1000 2000 3000 4000 5000 6000 7000 8000
5 6 7 8 9 10 11
Wind Speed (m/s)
Example of Binning
0 1000 2000 3000 4000 5000 6000 7000 80002
4 6 8 10 12 14
[image:5.595.37.271.51.135.2]Bin number
Fig. 8. Example of wind binning
C. Dynamic curves
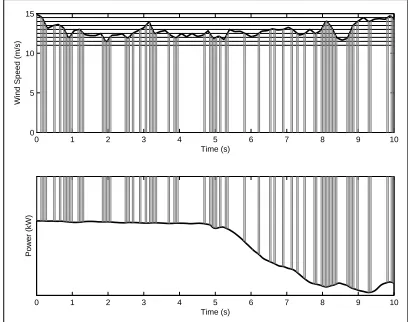
To assess the performance of a wind turbine relative to wind speed, according to [16], the measurements should be
collated in 0.5m/s wind speed bins, as depicted in Figure 8.
By binning the wind in this way and determining the value of the measure to analyse while the wind is in the different bins, see Figure 9, the performance curves for a particular
measurement, for example generated power or Cpmaxtracking
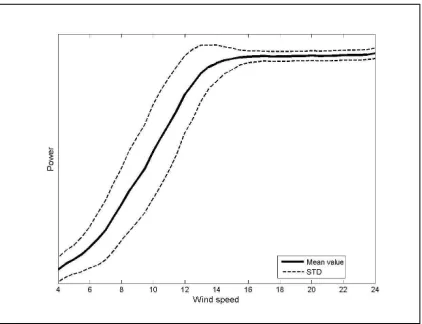
efficiency, consisting of the average and standard deviation with respect to wind speed, are obtained.Dynamic
perfor-mance curves are provided by theCDT, an example of which
can be seen in Figure 10.
0 1 2 3 4 5 6 7 8 9 10
0 5 10 15
Time (s)
Wind Speed (m/s)
0 1 2 3 4 5 6 7 8 9 10
Time (s)
Power (kW)
Fig. 9. Example of power binning
These performance curves, obtained from simulations run with different control strategies, are a reliable source of information regarding the comparative behaviour of the con-trollers when implemented on the actual machine.
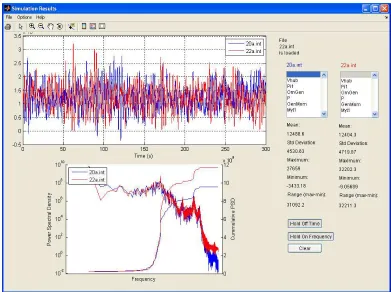
D. Data Analysis GUI
To enable theCDTto be a self-contained tool, it has the
[image:5.595.316.520.422.583.2]Fig. 10. Dynamic power curve
three different runs from the aero-elastic package, is included
in theCDT. Since there is a strong frequency domain aspect
to the wind turbine behaviour [17], it is always useful to have
PSDs available. Accordingly, the graphical interface at all
times depicts the time series, thePSDand the cumulativePSD
for the chosen signals. The commonly required statistics for these signals are also displayed automatically. The imported data is also made available in the MATLAB workspace so that all the signal processing and analytic capability of the MATLAB environment can be exploited.
E. Parameter optimisation using MATLAB
One of the most time consuming aspects of controller design is tuning the different controller parameters. Given the excess of processing power available today, it seems appropriate to develop computer-based automatic tuning procedures. To do this the measures of performance, on which tuning is to be assessed, must first be defined. Whether standard deviation of
generator speed, tower fatigue, the Kopt to obtain maximum
below rated energy capture or some other alternative, the task of determining the controller parameters which optimises the
measures of performance is straightforward in theCDT. The
CDT incorporates a procedure that automatically executes
a particular simulation run, or a batch of simulation runs, of the preferred aero-elastic package (Flex or Bladed), read the output, calculate the measures of performance chosen, and subsequently modify the controller values in order to improve on these performance measures. The procedure does not require user intervention and the optimisation continues until the improvement is within a specified tolerance. The
optimisation routine included in the CDT is valid for most
circumstances but, given the full integration of theCDT with
MATLAB, it is straightforward to change that optimisation routine to be any included in the MATLAB Optimisation Toolbox [18].
VII. CONCLUSIONS
The aim of this paper is not to offer yet another tool in an already over crowded market. From the authors expe-rience, the control designer often needs to use a variety of
tools from different sources. In addition, different companies use different aero-elastic packages. It seemed pertinent to incorporate all necessary tools for the control designer in a single independent framework and to make that framework compatible with any of the aero-elastic packages commonly
used. The CDT is just such a framework. Furthermore, the
fact that it is coded in Matlab makes it simpler for the control designer to embed in-house developments as extensions to this tool.
The CDT uses a set of well-tested solutions to some of the
issues faced by the wind turbine control designer, whilst leav-ing room for modifications, improvements and adjustments
to meet the specifics of any turbine when necessary. TheCDT
is, thereby, designed to be an aid to the control engineer.
Future Work
As the scope for the role of control changes, so the scope and sophistication of these tools evolves. One of the utili-ties, now under development at the KI, most demanded by
control designers is an interface for Bladed and FLEX with
Simulink to speed up the controller development by enabling controllers to be implemented in the aero-elastic environment in block diagram form.
A tool to directly parametrise the linear models within the
CDT directly from the Bladed parameter files is also under
construction. Unfortunately due to the extent of individual
manufaturers have modifiedFLEX and created different
ver-sions of flex parameters files, implementing such a tool
to extract the parameters from the FLEX parameter files is
not possible. However, for a particular version of FLEX, a
FLEXcomponent files parser that would extract the necessary
parameters is trivial.
REFERENCES
[1] W. Leithead, , F. Hardan, and D. Leith, “Identification of aerodynamics and drive-train dynamics for a variable speed wind turbine,” (Madrid), EWEC, July 2003.
[2] H. Rake, “Step response and frequency response methods,” Automat-ica, vol. 16, pp. 519–526, 1980.
[3] Risø, Guidelines for Design of Wind Turbines. second ed., 2002. [4] T. Dirlik, Application of computers in fatigue analysis. PhD thesis,
University of Warwick, 1985.
[5] A. Halfpenny, “A frequency domain approach for fatigue life estima-tion from finite element analysis,” (Dublin), Internaestima-tional Conference on Damage Assesment of Structures, 1999.
[6] T. van Engelen, “Frequency domain load calculation for offshore wind turbines (TURBU),” EWEC, November 2004.
[7] T. Engelen, P. Schaak, and C. Lindenburg, “Control for damping of the fatigue relevant deformation modes of offshore wind turbines,” Tech. Rep. ECN-RX-03-037, Energy Research Center of the Netherlands, June 2003.
[8] D. Quarton, “A theoretical investigation of the impact of control systems on fatigue of wind turbines,” tech. rep., Garrad-Hassan, October 1989.
[9] A. Papoulis, Sistemas Digitales y Analogicos, Transformadas de Fourier, Estimacion Espectral. Boixareu, 2 ed., 1986.
[10] S. Dominguez Ruiz and W. Leithead, “Size related performance limitations on wind turbine control systems,” in EWEC, (Greece, Athens), EWEA, 2006.
[11] T. Burton, D. Sharpe, N. Jenkins, and E. Bossanyi, Wind Energy Handbook. Wiley et sons., 2002.
[12] The Matworks, Simulink: Simulation and Model-Based Design, 6th ed., 2006.
[15] P. Brodtkorb, P. Johannesson, G. Lindgren, I. Rychlik, J. Rydn, and E. Sj, WAFO - A Matlab toolbox for analysis of random waves and loads. 10th International Polar and Offshore Engineering Conference, Seattle, 2000.
[16] I. 61400-12:1998, “Wind turbine generator systems. Part 12: Wind power performance testing.” International Standard, February 1998. [17] D. Quarton, M. Wastling, A. D. Garrad, and U. Hassan, “The
calcu-lation of wind turbine loads. a frequency or time domain problem?,” tech. rep., Garrad Hassan and Partners Ltd. UK, 1990.
Fig. 6. Control Design GUI
[image:8.595.93.484.408.700.2]