City, University of London Institutional Repository
Citation
: Acarali, D., Rajarajan, M., Komninos, N. ORCID: 0000-0003-2776-1283 and
Zarpelao, B. (2019). Modelling the Spread of Botnet Malware in IoT-Based Wireless Sensor
Networks. Security and Communication Networks, 2019, 3745619.. doi:
10.1155/2019/3745619
This is the published version of the paper.
This version of the publication may differ from the final published
version.
Permanent repository link:
http://openaccess.city.ac.uk/21380/
Link to published version
: http://dx.doi.org/10.1155/2019/3745619
Copyright and reuse:
City Research Online aims to make research
outputs of City, University of London available to a wider audience.
Copyright and Moral Rights remain with the author(s) and/or copyright
holders. URLs from City Research Online may be freely distributed and
linked to.
City Research Online:
http://openaccess.city.ac.uk/
[email protected]
Research Article
Modelling the Spread of Botnet Malware in IoT-Based Wireless
Sensor Networks
Dilara Acarali ,
1Muttukrishnan Rajarajan,
1Nikos Komninos ,
1and B. B. Zarpelão
21School of Mathematics, Computer Science and Engineering, City, University of London, UK 2Computer Science Department, State University of Londrina, Brazil
Correspondence should be addressed to B. B. Zarpel˜ao; [email protected]
Received 5 December 2018; Revised 9 January 2019; Accepted 15 January 2019; Published 3 February 2019
Academic Editor: Angel M. Del Rey
Copyright © 2019 Dilara Acarali et al. This is an open access article distributed under the Creative Commons Attribution License, which permits unrestricted use, distribution, and reproduction in any medium, provided the original work is properly cited.
The propagation approach of a botnet largely dictates its formation, establishing a foundation of bots for future exploitation. The chosen propagation method determines the attack surface and, consequently, the degree of network penetration, as well as the overall size and the eventual attack potency. It is therefore essential to understand propagation behaviours and influential factors in order to better secure vulnerable systems. Whilst botnet propagation is generally well studied, newer technologies like IoT have unique characteristics which are yet to be thoroughly explored. In this paper, we apply the principles of epidemic modelling to IoT networks consisting of wireless sensor nodes. We buildIoT-SIS, a novel propagation model which considers the impact of IoT-specific characteristics like limited processing power, energy restrictions, and node density on the formation of a botnet. Focusing on worm-based propagation, this model is used to explore the dynamics of spread using numerical simulations and the Monte Carlo method to discuss the real-life implications of our findings.
1. Introduction
IoT networks are increasingly becoming a feature of our digi-tal landscape. These networks consist of devices with sensing capabilities designed to collect data on the environment, which is then forwarded via sink nodes to be processed. This data can then be used to learn about customers, improve efficiency, or supplement services. IoT sensor networks are characteristically different to conventional networks. Sensor devices are low powered and often use batteries as their primary source of energy. Therefore, energy efficiency is a priority. These power restrictions mean that devices have limited processing capabilities, which often results in poor security. Sensor networks also tend to be dense. This is due to the requirements of data collection (i.e., the types of data desired and the coverage needed). These unique characteris-tics have an influence on the propagation of malware and the development of potential botnet threats.
In 2016-17, the Mirai botnet was able to gain traction and, as a result, grabbed public attention with a series of high-profile, large-scale DDoS attacks [1]. Using a relatively simple propagation approach, Mirai was able to quietly spread to
many devices, estimated to be around 600,000 at its peak [2]. This provided a large pool of bots to draw from, resulting in DDoS attacks with a huge force of 620 Gbps against a security blog [1, 3] and 1.1 Tbps against a French Internet provider [1], both in 2016. The events around Mirai demonstrate the prominent threat of botnets in the IoT space. To make matters worse, Mirai’s source code was made public, and multiple spinoffs and copycats have already been reported including Persirai [1], BrickerBot [1], and HideNSeek [4].
Propagation is typically a difficult process to detect and to observe. This is because different vulnerabilities emerge across different technologies, various services or functions can serve as propagation vectors, and we collectively lack experience with widespread implementation of new tech-nologies like IoT or IPv6. Consequently, the initial propa-gation process tends to be revealed in hindsight, only after an existing infection has been identified. Therefore, we use modelling approaches based on our understanding of the technology and experience with historic attacks to predict propagation dynamics and to explore influential factors.
We apply this approach by building IoT-SIS, a model
of botnet propagation through IoT-based wireless sensor
networks, focusing on the unique characteristics of IoT that
differentiates it from other types of network.IoT-SISitself
is based on epidemiological concepts and uses theSIS
(Sus-ceptible, Infected, Susceptible) paradigm as its foundation. In conducting this research, we hope to better understand how botmasters may approach IoT networks and what factors are most influential from a defensive perspective. This includes a consideration of the botmasters requirements, such as the need to balance the acquisition of new bots with the need to sustain the existing bot population. This topic is not currently well studied, and we hope to address this with the following contributions:
(i) A novel SIS-based model, called IoT-SIS, of
IoT-based worm propagation and botnet formation (ii) An in-depth exploration of the relationships between
various factors (such as bot activity, node hardware, and deployment scheme) via simulations
(iii) An analysis of the model using the Monte-Carlo simulation method
The paper is organised as follows: Section 2 provides a background on epidemiological modelling, IoT, and known IoT-based botnets. Section 3 defines the model and describes the parameters, with rationale for each choice. In Section 4, we outline our simulation setup and present our results. Section 5 discusses our findings and makes suggestions for defence and future work. Examples of related work are presented in Section 6, and we conclude in Section 7.
2. Background
2.1. Epidemic Modelling. The medical field of epidemiology is
the study of disease incidence in populations, used to analyse spread dynamics and to measure potential immunisation strategies. Based on the work of Kermack and McKendrick [5], epidemic principles are used to mathematically model the outbreak of infectious diseases where scientific experi-mentation is not feasible or ethical [6], allowing researchers to predict possible impact factors in transmission dynamics, which then feeds into the development of public health policies [6]. Epidemic modelling was introduced to cyberse-curity by Kephart and White [7] in their study of computer viruses, where they used populations of computer systems, substituted malware for diseases, and based contact on network communication graphs. This has developed further to apply to various types of malware, including botnets where such models allow us to consider the factors impacting the size of bot populations.
Epidemic models consist of states or compartments, cou-pled with some transition conditions that determine when a node moves from one state to another. These models are sometimes referred to as compartmental models, as the total population is divided amongst a number of compartments based on their current status [6]. States (or compartments) are designed to abstractly describe the current role played by nodes, encapsulating any behaviours and characteristics that may be associated with that role. The number of states reflects the number of possible roles that nodes may take. The
system is then measured by considering rates of change and calculating the number of nodes within each compartment over time. In compartmental models, transitions are typically defined as a system of differential equations, commonly featuring elements such as the rates of contact, infection, recovery, births, and deaths.
The most basic epidemic model is SI, consisting of the
Susceptible (S) and Infected (I) states. ‘Susceptible’ describes
a vulnerable individual who has not yet been infected, whilst ‘Infected’ tends to denote an individual who is both a carrier and a propagator of the pathogen. Nodes would
then transition fromStoI at the rate of infection. TheSIR
model adds the Recovered (R) state to represent individuals
who have been healed and subsequently gained immunity.
Nodes will transition from I to R at the rate of recovery.
An alternative is SIS, where recovered nodes do not gain
immunity but instead return to their previous susceptible
status. Finally, theSEIR model adds the Exposed (E) state
to denote infected individuals who are either asymptomatic or not able to pass on the pathogen until they transition
into the I state. This is used where the incubation period
of diseases needs to be considered. Basic versions of the epidemic models are generally deterministic but may include probabilistic elements. Stochastic versions of these models tend to use Markovian Processes or stochastic differentials [6].
In this work, the model incorporates probabilistic ele-ments to more accurately represent the likelihoods of contact and infection. Additionally, we based our approach on the
SISformat. This is because IoT malware often runs in the
RAM and is not persistent, meaning that rebooting can clean the sensor of an infection. However, the node does not gain immunity. Meanwhile, devices which are recovered via patching are likely to fall victim to the same malware again because bots frequently receive updates containing new exploits. Hence, in both scenarios, it is realistic to consider recovered nodes susceptible to reinfection rather than permanently immune.
2.2. IoT Sensor Networks. IoT sensor networks consist of
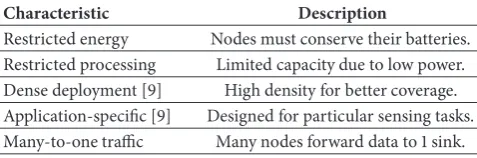
wireless sensor nodes, which are small devices equipped with the ability to sense the environment and to perform small computations [8]. Devices form a wireless sensor network (WSN) to collaboratively sense and respond to the environment [8] and also to communicate with IoT-enabled devices like routers, allowing access to the wider infrastructure for data retrieval and processing. WSNs are made up of sensor nodes and sink nodes. Sink nodes act as a hub for data collection and as a gateway for the WSN [9]. Users may observe the IoT-based WSN directly, via a local IP-based network, or remotely over the Internet and can send commands via sink nodes [9]. The defining characteristics of WSNs are summarised in Table 1.
Table 1: Key characteristics of IoT sensors in WSNs.
Characteristic Description
Restricted energy Nodes must conserve their batteries. Restricted processing Limited capacity due to low power. Dense deployment [9] High density for better coverage. Application-specific [9] Designed for particular sensing tasks. Many-to-one traffic Many nodes forward data to 1 sink.
[9]. The processor also manages sleep cycles, used by nodes to conserve power. Typically, the most energy-consuming function is the exchange of data, with the degree of energy required increasing exponentially the further the data needs to travel [9]. Hence, node density and deployment patterns must be considered carefully.
The IoT stack is structured similarly to the TCP/IP stack with 5 horizontal layers defining end-to-end communication from the physical medium (layer 1) up to the application (layer 5). It also includes additional vertical ‘planes’ [9], representing processes which must be managed at each layer. These are (a) Power (i.e., the sharing of power between node functions), (b) Mobility (i.e., the tracking of nodes), and (c) Tasks, (i.e., communication, message detection, and sensing activities). Protocols at each layer must address the 3 vertical processes [8].
For the botmaster, these processes may highlight areas of vulnerability. For example: (a) high-power consumption on infected nodes can result in node death, (b) node mobility can be exploited to join WSNs in Sybil-style attacks, and (c) task schedules may be manipulated to steal information. For captured nodes, these processes also need to be considered as part of the botnet’s maintenance. In the Power plane, the botmaster must limit bots’ activity levels to avoid power depletion as this would hurt their propagation gains. In the Tasks plane, this may involve the cancellation of scheduled tasks or the disabling of services. Meanwhile, in the Mobility plane, GPS tracking on mobile nodes may reveal new targets. There are currently several IoT communication stan-dards available; in this work, we focus on 6LoWPAN (IPv6 over Low-Power WPAN) and RPL (Routing Protocol for Low-Power and Lossy Networks) [10] which are designed specifically for LLNs (Low-Power and Lossy Networks) (i.e., constrained networks) such as IoT-based WSNs [10]. Based on the IEEE 802.15.4 network standard, they provide IPv6-based routing functionality [8] to connect sensor networks to IP networks. The migration to IPv6 is necessary due to the massively increased number of Internet-connected devices in need of unique identifiers [8]. 6LoWPAN runs on low-energy sensor devices and adds an interface layer to allow compatibility between the IP-based routing and the lower IEEE 802.1.5.4-based layers [8].
RPL arranges nodes into DoDAGs (Destination-orien-tated Directed Acyclic Graphs) to enable routing. In these graphs, nodes form parent-child relationships, anchored by a root node which is the edge router connecting the WSN to the IP network. Parent-child relationships are based on an OF (Objective Function), a user-defined metric for route
optimisation [11]. The neighbour representing the optimum path towards the root is hence selected as the preferred parent. Consequently, IEEE 802.15.4 also allows nearby nodes to have P2P-based communication.
2.3. IoT Botnets. Mirai caused widespread disruption during
2016 and 2017 with a series of large-scale DDoS attacks. According to [2], 65,000 devices were infected in 20 hours, and the botnet achieved a peak size of 600,000 nodes [2]. Mirai uses worm-based propagation, which is characterised by periods of scanning for vulnerable devices, reportedly targeting IoT-enabled cameras, routers, printers, and video recorders during its “rapid scanning phase” [1, 2]. The malware sends TCP SYN messages to random IPv4 addresses on ports 23 and 2323. For successful connections, it then tries to access the device using a dictionary attack based on 62 commonly used default logins credentials. If successful, the logins and the device IP are recorded on a server which then triggers a loader to download the malware on to the target [2]. Mirai sometimes kills existing processes [2], which may be a defence against other malware or a method of preserving energy. Antonakakis et al. [2] noted that Mirai’s scanning rates and subsequent infection rates were lower than that of other known worms such as Code Red or Blaster, suggesting that limited device capacity may be the cause.
After Mirai’s source code was made public, several deriva-tives have been reported [1]. One such derivative is the worm-based bot Persirai. Discovered in April 2017, it reportedly uses port 81 and known exploits to gain access to password files on IoT webcams before targeting routers via UPnP exploits [1]. BrickerBot, also identified in April 2017, uses default SSH logins and known exploits to permeate IoT devices, before corrupting firmware and generally debasing devices to make then unusable [1]. More recently, BitDefender reported a botnet called HideNSeek, detected in January 2018 [4]. Suggested to be in its expansion phase, it propagates by randomly scanning the IP space with SYN connections on ports 23, 2323, 80, and 8080 [4], and when a connection is established, attempts a Mirai-style dictionary attack.
The IoT botnets observed to date find victims by scanning the network, target similar open ports, and use exploits or weak credentials for penetration. Overall, they are charac-terised by their simplicity, using worm-based propagation for the majority of infections. This suggests that IoT is not yet well understood by users and is hence lacking the required security measures. Whilst the choice for simple propagation methods may be related to device limitations, this also makes IoT an attractive target for botmasters despite device constraints. If nodes’ power and other resources are well managed, the botnet can quickly infect many low-capacity devices, resulting in a sizable attack force. This was demonstrated in the case of Mirai [1] and will likely be seen in its derivatives as well.
3. Proposed Model
We developed IoT-SIS, a novel propagation model to
S
IR
IL
IP
dthB+ dthR
dthB+ dthL
dthB+ dthP
dthB R
L
[image:5.600.73.269.74.222.2]P
Figure 1: Flow diagram of proposedIoT-SISmodel with states and key transitions.
that there is an existing infection and seeks to measure how quickly and widely this might spread. Note that we specifically focus on battery-powered IoT devices in order to understand the impact of energy consumption in this context. For simplicity, we make the following assumptions:
(1) a static network, i.e., nodes have no mobility, (2) a
deterministic deployment layout, i.e., static and predefined,
(3)node homogeneity, i.e., nodes consist of similar devices
with the same functionality and properties [9], and (4)a
mesh topology, i.e., nodes are connected directly to many other nodes, unlike in a star topology. We do not consider the source of infection, or the impact of sleep cycles (the schedules of which will be different for each scenario).
IoT-SISis based on theSISparadigm from
epidemiol-ogy. Given a population of nodesN, a set of compartments
represent possible node states. Then, differentials are added to describe the rates of change between the proportional
node populations. SusceptibleS nodes are free of malware
but vulnerable to infection; this is the default state of nodes.
InfectedInodes are carriers who can transmit the infection.
Given a series of time-steps represented byt, the number of
nodes within each state is a fraction ofNsuch that
𝑁 = 𝑆 (𝑡) + 𝐼 (𝑡) = 𝑁𝑆 +𝑁𝐼 (1)
Successful contacts, followed by successful transmission
events, cause nodes to pass from S to I. The I nodes are
categorised based on the nature of the infection event which led to their transition. The model is illustrated in Figure 1 and mathematically defined by the following system of differentials:
𝑑𝑆
𝑑𝑡 = −𝛽𝑅𝑆𝐼 − 𝛽𝐿𝑆𝑙𝑜𝑐𝐼 − 𝛽𝑃𝑆𝑛ℎ𝑏𝐼 − 𝑑𝑡ℎ𝐵𝑆 + 𝛼𝐼 (2) 𝑑𝐼𝑅
𝑑𝑡 = 𝛽𝑅𝑆𝐼 − 𝛼𝐼𝑅− 𝑑𝑡ℎ𝐵𝐼𝑅− 𝑑𝑡ℎ𝑅𝐼𝑅 (3) 𝑑𝐼𝐿
𝑑𝑡 = 𝛽𝐿𝑆𝑙𝑜𝑐𝐼 − 𝛼𝐼𝐿− 𝑑𝑡ℎ𝐵𝐼𝐿− 𝑑𝑡ℎ𝐿𝐼𝐿 (4) 𝑑𝐼𝑃
𝑑𝑡 = 𝛽𝑃𝑆𝑛ℎ𝑏𝐼 − 𝛼𝐼𝑃− 𝑑𝑡ℎ𝑃𝐼𝑃− 𝑑𝑡ℎ𝑃𝐼𝑃 (5)
where
(i)Sis the total susceptible population.
(ii)𝑆𝑙𝑜𝑐is the fraction ofSin the local network (of a node).
(iii)𝑆𝑛ℎ𝑏 is the fraction of S in the neighbour set (of a
node).
(iv)Iis the total infected population,𝐼 = 𝐼𝑅+ 𝐼𝐿+ 𝐼𝑃.
(v)𝐼𝑅 is the fraction of I nodes infected via random
scanning.
(vi)𝐼𝐿is the fraction ofInodes infected via local scanning.
(vii)𝐼𝑃is the fraction ofInodes infected via P2P.
(viii)𝛽Ris the random scanning-based infection rate.
(ix)𝛽Lis the local scanning-based infection rate.
(x)𝛽Pis the P2P-based infection rate.
(xi)𝑑𝑡ℎ𝐵is the death rate due to standard activities.
(xii)𝑑𝑡ℎ𝑅is the death rate driven by random scanning.
(xiii)𝑑𝑡ℎ𝐿is the death rate driven by local scanning.
(xiv)𝑑𝑡ℎ𝑃is the death rate driven by P2P communication.
(xv)𝛼is the recovery rate.
Nodes are lost from theSstate at the rate of infection.
Infections may be based on random scanning (R), local
scanning (L), or P2P communication (P). Nodes transition
into theIsubset which aligns with their infection type. Nodes
are lost from theIstate at the rate of recovery and transition
back intoS. We also consider death rates. Nodes may die of
‘natural causes’ at the benign death rate𝑑𝑡ℎ𝐵. Nodes may die
due to malicious activity at the malicious death rates. These parameters are described in more detail in the following subsections.
3.1. Network Structure & Population. Conceptually, the
net-work is made up of multipleM interconnected WSNs. The
total populationNis divided amongst these WSNs:
𝑁 = 𝑊𝑆𝑁1+ 𝑊𝑆𝑁2. . . 𝑊𝑆𝑁𝑀 (6)
These WSNs may be connected directly, via IP-based infrastructure networks, or via the Internet. For simplicity, we do not define a separation between these connectivity types and assume that infection type is more relevant. Hence, the model view encompasses the collection of WSNs. We do consider the type of infection associated with the different connectivity types as follows:
(i)Inter-WSN: traffic is routed over layer 3, with targets found via random scanning.
(ii)Intra-WSN:traffic is routed over layer 3, with targets found via local scanning.
(iii)Between neighbours: traffic is exchanged via P2P
over layer 2, with targets based on P2P relationships.
This means that each infection method has a different
attack surface, consisting of different proportions of the S
access to all ofS, whereas with local scanning it can only
reach the proportion ofSwhich is local to it. Similarly, this
node can only reach its direct neighbours if it uses P2P-based propagation. This is detailed further in the coming sections.
We assume that the population has a finite number of nodes; i.e., there are no births into the system. Nodes may be removed from the population via deaths, either ‘naturally’ due to standard end-of-life or wear-and-tear or as a direct
result of bot infections. Natural deaths occur in bothSand
I populations, whilst bot deaths only occur within the I
population.
3.2. Infection Rates. There are 3 infection rates, each
repre-senting a different propagation method. For each, the
in-fection rate𝛽is
𝛽 = 𝑐𝑜𝑛𝑡𝑎𝑐𝑡 𝑟𝑎𝑡𝑒 × 𝑃𝑡𝑟𝑎𝑛𝑠𝑚𝑖𝑠𝑠𝑖𝑜𝑛 (7)
where 𝑃𝑡𝑟𝑎𝑛𝑠𝑚𝑖𝑠𝑠𝑖𝑜𝑛 is the transmission probability (i.e., the
infection probability per contact). This is sampled from
a Poisson distribution, where 𝜆 is the mean number of
successful transmissions of the infection per contact per time
for a singleInode. Hence, it is the proportion of total contacts
per time which lead to infection. The Poisson distribution is applicable where events are discretely measured, and where event occurrence is rare per given period [13]. Transmissions can be counted discretely as individual events and, given a wider network of WSNs, should be relatively rare.
Further-more, the probability of anInode causing an infection does
not change over time, and previous successful or unsuccessful attempts do not impact the chances of future attempts [13].
Additionally, any increase in the number of infections
is caused by the growth of theI population rather than an
increase in the infection rate. Hence, transmission events are independent. Given the scanning rates of known botnets, we can estimate the proportion of contacts which result in
successful transmissions and, hence, estimate a value for𝜆.
The total I population is split into 3 subsets to match the
infection methods: random scanning, local scanning, and P2P. Note that these sets represent how the nodes became
infected, but anyInode may perform any kind of infection.
Theoretically, a worm-based bot malware may use 1, 2, or all 3 of these infection types. Random scanning of the IP address space has been observed frequently in worm-based propagation, e.g., Mirai [2]. Meanwhile, HideNSeek reportedly changes its behaviour if the infected IP is within the same LAN as the infecting source node [4]. When local, a TFTP connection is used to download the malware from the source node. Otherwise, it must be downloaded remotely [4]. Additionally, HideNSeek is described as a P2P botnet [4]. IEEE 802.15.4 allows P2P communication between neighbour nodes. Meanwhile, users often are not aware of the full functionality of their IoT devices. This means that it is feasible that IoT-targeting bots will further exploit P2P as a contact vector.
3.3. Propagation Mechanisms. Scanning-based propagation
requires nodes to make connections to remote nodes which
they then attempt to gain access to. However, connection attempts may be unsuccessful because the IP does not correspond to an active node, the target device is not running targeted services, or due to simple network error. Hence, the random-scanning contact rate is defined:
𝑐𝑜𝑛𝑡𝑎𝑐𝑡𝑠 𝑝𝑒𝑟 𝑡𝑖𝑚𝑒 = 𝑠𝑐𝑎𝑛𝑠 𝑝𝑒𝑟 𝑡𝑖𝑚𝑒 × 𝑃𝑠𝑢𝑐𝑐𝑒𝑠𝑠 (8)
where the 𝑃𝑠𝑢𝑐𝑐𝑒𝑠𝑠 is the probability of connection success,
sampled from a Poisson distribution with 𝜆 defined as
the mean number of connection events. Random-scanning
behaviour will target the whole S population, including
remote WSNs, and hence it is feasible to assume that this will result in some unsuccessful connections. In contrast, we would expect more local scans to be successful and most P2P connections to be successful. Therefore, this is reflected in the definitions of the infection rates.
3.4. Subsets of S Population. Given a network space made
up of multiple WSNs, random scanning relies on routing to scan the entire IP address space and hence targets the whole
S population (i.e., allS nodes across all the WSNs). Local
scanning is similar but targets the local IP address space (i.e., within a single WSN). Directly connected neighbours use P2P, and hence P2P-based propagation targets only a node’s neighbour set. In short, each infection method has access to a
different proportion of the availableSpopulation. Whereloc
is the mean number of nodes in 1 average WSN, we define
𝑆𝑙𝑜𝑐 as the fraction of the total Spopulation within a local
network. This determines the attack surface of local scanning.
Similarly, where𝑛ℎ𝑏is the mean number of nodes within the
neighbour set of 1 average node,𝑆𝑛ℎ𝑏 is the fraction of the
totalSpopulation which makes up the attack surface of P2P
infections.
We find the fraction of Nwithin each WSN (assuming
that all WSNs are of the same size) and then take that percent
of the currentSpopulation to find the final 𝑆𝑙𝑜𝑐value. This
means that the target population accessible via local scanning
is always capped. Similarly, we find the fraction ofNwithin
each neighbour set and then take that percent of the current
Spopulation to find𝑆𝑛ℎ𝑏. The mean size of a P2P neighbour
set will be a function of the node distribution scenario, the average node transmission range, and the total nodes per WSN.
3.5. Deployment Setups & Neighbour Sets. Before RPL
arran-ges nodes into DoDAGs for routing and IP connectivity, each node can form layer 2 P2P relationships with neighbours who are within its transmission range. Hence, each node has a P2P neighbour set associated with it. We make the following assumptions:
(i) All nodes have the same transmission range.
(ii) Nodes are uniformly distributed (i.e., equally spaced).
For a uniform distribution, the node density (per unit of space) is defined by (9). Given the node transmission range, the number of neighbours per node is given by (10).
𝑑𝑒𝑛𝑠𝑖𝑡𝑦 = 𝑡𝑜𝑡𝑎𝑙 𝑛𝑜. 𝑜𝑓 𝑛𝑜𝑑𝑒𝑠
𝑑𝑒𝑝𝑙𝑜𝑦𝑚𝑒𝑛𝑡 𝑎𝑟𝑒𝑎 (9)
𝑛𝑜. 𝑜𝑓 𝑛𝑒𝑖𝑔ℎ𝑏𝑜𝑢𝑟𝑠 = 𝑑𝑒𝑛𝑠𝑖𝑡𝑦 × 𝑡𝑟𝑎𝑛𝑠𝑚𝑖𝑠𝑠𝑖𝑜𝑛 𝑟𝑎𝑛𝑔𝑒 (10)
3.6. Deaths. We assume that the energy spent on sensing
and processing is negligible in comparison to the energy spent on sending and receiving transmissions. Hence, we focus only on the energy consumed for communication in this model. Significantly, this will be directly impacted by the propagation activities of bot-infected nodes. Excluding random errors or physical tampering, nodes deaths are caused primarily by power depletion. All nodes consume energy when sending/receiving traffic which is part of their normal operation. Hence, the benign (i.e., ‘normal’) death rate depends on the normal contact rate of nodes.
If we assume that bot nodes send and receive additional traffic, then the contact rate of infected nodes should be
higher than for S nodes. Therefore, alongside the normal
contact rate, we also introduce a malicious contact rate. Death rate caused by malicious behaviour then depends on the malicious contact rate. Propagation can be attributed to this additional traffic, and subsequently the infection rate depends on the malicious contact rate as well. Hence, bot nodes should die at standard rate plus the malicious rate.
Node death rate (dths) is dependent on the amount of
trans-mitted data, the transmission distance, and the characteristics of the node as follows:
𝑝𝑜𝑤𝑒𝑟𝑚𝑠𝑔= 𝜇 × 𝑚𝑒𝑎𝑛 𝑚𝑒𝑠𝑠𝑎𝑔𝑒 𝑠𝑖𝑧𝑒 × 𝑑𝑖𝑠𝑡𝑎𝑛𝑐𝑒 (11)
𝑝𝑜𝑤𝑒𝑟𝑡𝑖𝑚𝑒= 𝑝𝑜𝑤𝑒𝑟𝑚𝑠𝑔× 𝑐𝑜𝑛𝑡𝑎𝑐𝑡 𝑟𝑎𝑡𝑒 (12) 𝑛𝑜𝑑𝑒 𝑙𝑖𝑓𝑒𝑠𝑝𝑎𝑛 = 𝑡𝑜𝑡𝑎𝑙 𝑏𝑎𝑡𝑡𝑒𝑟𝑦 𝑐𝑎𝑝𝑎𝑐𝑖𝑡𝑦 × 𝑝𝑜𝑤𝑒𝑟𝑡𝑖𝑚𝑒 (13)
𝑑𝑡ℎ𝑠 = 1
𝑛𝑜𝑑𝑒 𝑙𝑖𝑓𝑒𝑠𝑝𝑎𝑛 (14)
where the𝜇is the mean power needed to transmit 1B of data
1m in distance,𝑝𝑜𝑤𝑒𝑟𝑚𝑠𝑔is the power required per message,
𝑝𝑜𝑤𝑒𝑟𝑡𝑖𝑚𝑒is the power consumed per time, anddistancerefers to how far apart nodes are spaced, defined by
𝑑𝑖𝑠𝑡𝑎𝑛𝑐𝑒 = 𝑑𝑒𝑝𝑙𝑜𝑦𝑚𝑒𝑛𝑡 𝑎𝑟𝑒𝑎𝑛𝑜. 𝑜𝑓 𝑛𝑜𝑑𝑒𝑠 (15)
Given the mesh setup of the sensor network, nodes should always forward traffic to an immediate neighbour, regardless of whether the destination node is nearby or in a remote WSN. Hence, exchanging data with an immediate neighbour will consume as much power as exchanging data with a remote node. As benign and malicious activities have separate death rates, there may also be different contact rates and message sizes associated with them. Since the infected death rate is the inverse of the infected lifespan, a longer lifespan should result in a lower death rate and vice versa. If an
I node performs no malicious activity (malicious contact
rate=0), it lives out the normal lifespan. If anInode performs
no normal activity (benign contact rate=0), it lives out the
infected lifespan. If anInode performs both types of activity,
its lifespan is shortened, proportional to the contact rate of each traffic type. Therefore, bot nodes are more likely to die earlier. Note that each infection type has its own death rate, driven by the relevant contact rate.
3.7. Recovery. The recovery rate𝛼depends on the behaviours
of network defenders, including how active they are in their monitoring and how effective they are at identifying and
cleaning I nodes. Hence, it is plausible for us to control
the recovery rate directly to determine what level and type of engagement is necessary to effectively mitigate botnet spread. For instance, we can increase or decrease recovery rate to observe the impact of faster or slower interventions.
Therefore, 𝛼 can be estimated by the user of the model.
Since all the nodes in a single WSN will be serving the same purpose, it is plausible to assume that they are of the same hardware and running the same software [14]. Hence, a single patch type should address infections caused by a single worm strain.
4. Simulations
4.1. Setup. Our aim was to test the population dynamics
and parameter relationships in the model under different conditions. To achieve this, we ran a series of manual numerical simulations with different input values from which we gained an understanding of these relationships. This was followed by a formal Monte Carlo simulation to generate a range of outputs and to understand the likelihoods of these outcomes based on our starting assumptions.
Botnets have particular requirements. For instance, they usually need to collect as many bots as possible to have a sufficient attack force. They then need to be able to sustain that population over time in order to launch successful campaigns. To address this, the model principally covers 2 planes: space and power. The spatial aspects of IoT-based bot propagation relate to the infection types and their corresponding attack surfaces. This determines the reach of the infection. The power aspects are addressed through the contact rates and the death rates. This determines the power depletion applied on the nodes. This setup also aligns with 2 defining characteristics of IoT networks, which are dense node deployment and limited power availability. Based on the model’s 2 planes, we predicted the following:
(i) There is a significant relationship between infection rate and malicious death rate.
(ii) Power dynamics will be different for dense infected networks vs. sparse infected networks.
(iii) There is a relationship between propagation attack surface, the bot count, and the spatial distribution of bots.
The model itself is programmed as an R script [15].
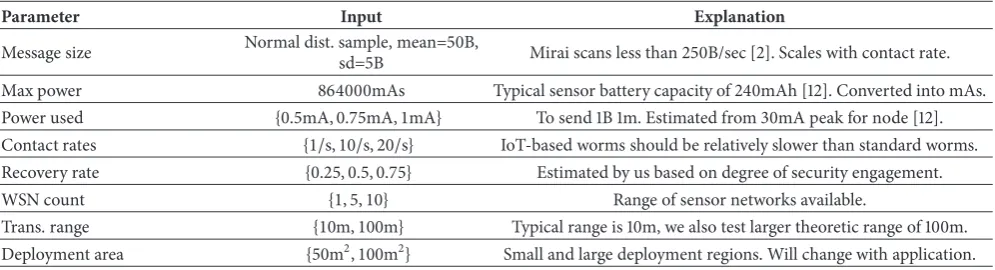
Table 2: Inputs for the Monte Carlo simulation.
Parameter Input Explanation
Message size Normal dist. sample, mean=50B,sd=5B Mirai scans less than 250B/sec [2]. Scales with contact rate.
Max power 864000mAs Typical sensor battery capacity of 240mAh [12]. Converted into mAs. Power used {0.5mA, 0.75mA, 1mA} To send 1B 1m. Estimated from 30mA peak for node [12]. Contact rates {1/s, 10/s, 20/s} IoT-based worms should be relatively slower than standard worms. Recovery rate {0.25, 0.5, 0.75} Estimated by us based on degree of security engagement.
WSN count {1, 5, 10} Range of sensor networks available.
Trans. range {10m, 100m} Typical range is 10m, we also test larger theoretic range of 100m. Deployment area {50m2, 100m2} Small and large deployment regions. Will change with application.
allowing for complex operations and making our process
eas-ily repeatable by others. The script uses thedeSolvepackage
[16] to solve the differential equations in the model system
and the MonteCarlopackage [17] to run the simulations.
Table 2 summarises our input ranges. Due to the costly nature of running Monte Carlo simulations, and the number of parameters included in the model, the input range for the Monte Carlo process must be limited, whilst keeping the values meaningful. Our approach here is inspired by [18]. The aim is to include high and low values to cover a wide-enough range of possible outcomes. The Monte Carlo outputs were averaged over 100 iterations, and each run of the model goes through 100 time-steps. The results of a relationship analysis and simulations are detailed in the next subsection.
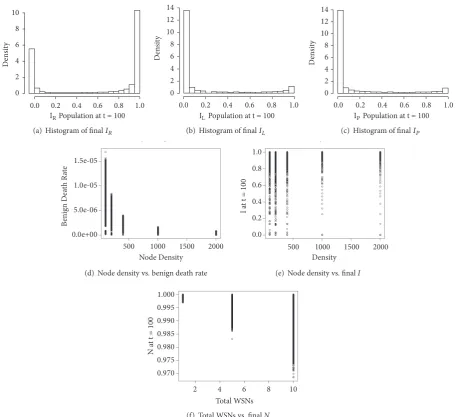
4.2. Results. Figures 2(a), 2(b), and 2(c) show the Monte
Carlo histograms for the sizes of the infected populations at the final time step. As expected, random scanning has the largest impact on the network due to having the largest attack
surface. Hence, the𝐼𝑅population is capable of consuming the
whole network. The simulation also showed that𝐼𝑅becomes
negative if no infections are taking place, due to the consistent
death rate. Meanwhile, the𝐼𝐿and𝐼𝑃populations have a more
modest impact due to their capped attack surfaces.
Using only random scanning (resulting in𝐼 = 𝐼𝑅) allows
the infection to spread throughout the S population, with
higher peak infections thanks to there being no other I
subsets. This mimics the dynamics of typical worm-based propagation. Meanwhile, local scanning on its own (resulting in𝐼 = 𝐼𝐿) struggles to have a significant impact if its attack
surface is too limited. Hence, 𝐼𝐿 requires (a) an increased
contact rate, (b) a large transmission probability, or (c) fewer WSNs (i.e., individual WSNs must be large enough).
Similarly, using only P2P (resulting in𝐼 = 𝐼𝑃) leads to
a more extreme version of the𝐼𝐿scenario, as 𝐼𝑃 is capped
even more. Hence, 𝐼𝑝 also requires (a) increased contact
rate, (b) increased transmission probability, and (c) fewer WSNs, but it can also be boosted by reducing the size of the deployment area or increasing the node transmission range (i.e., neighbour sets must be large enough).
Larger message sizes require more power to transmit and hence drive up the death rate. Meanwhile, increasing nodes’ battery capacity can increase nodes’ lifespans and hence decrease the number of deaths per time. A larger deployment
area decreases the overall density of nodes, increasing the distance data must be sent over and consequently causing
more deaths. Figure 2(d) depicts this, where𝑑𝑡ℎ𝐵decreases
as density increases. Meanwhile, higher density results in a
higher probability of a large finalIpopulation, as illustrated
in Figure 2(e).
A larger deployment area also decreases𝑆𝑛ℎ𝑏, leading to
a smaller𝐼𝑃population as the available peer nodes are
min-imised. Meanwhile,𝑆𝑛ℎ𝑏 grows with the node transmission
range and allows𝐼𝑃to reach higher peak values thanks to the
expanded attack surface. A greater number of WSNs shrinks
𝑆𝑙𝑜𝑐and𝑆𝑛ℎ𝑏, as well as the density of each WSN. This pushes
up the distance between neighbouring nodes, which in turn consumes more power to transmit data. This results in higher
death rates, and a smaller finalN, as Figure 2(f) illustrates.
Conversely, dense node deployment results in lower death rates as data is transmitted over shorter distances. The sizes of the infected populations are also impacted.
Increasing or decreasing the contact rate has a corre-sponding impact on the associated death rate. A larger benign
contact rate pushes up𝑑𝑡ℎ𝐵leading to more deaths overall.
For bot contact rates, changes also influence the associated
infection rate. Given N, the I population is distributed
amongst the 3 infected subpopulations depending on𝛽and
the number of availableSnodes. Hence, when 1
subpopula-tion increases in size, the others shrink proporsubpopula-tionally. The overall impact of increasing contact rates is a sharper increase
in infections, followed by a sharper decline in theIpopulation
due to a larger number of deaths; i.e., theIpopulation is not
sustained. This is demonstrated in Figure 3(a), where a higher contact rate pushes up the death rate until the population becomes depleted.
The capped propagation methods are more sensitive to
drops in contact rate since they are already handicapped.𝐼𝐿
and𝐼𝑃populations may overcome this handicap and surpass
𝐼𝑅if their corresponding infection rates become very large.
Figure 3(b) demonstrates this effect for 𝐼𝑃, with increasing
contact rates across 5 simulations (in ascending order so
thatsim#1 used a contact rate of 5/s andsim#5 of 1,000/s).
Meanwhile, changes to𝑃𝑡𝑟𝑎𝑛𝑠𝑚𝑖𝑠𝑠𝑖𝑜𝑛only impact infection rates
and not death rates because it changes the proportion of contacts which result in infections (whilst the contact rate
10 8 6 4 2 0
De
n
si
ty
0.0 0.2 0.4 0.6 0.8 1.0
)2Population at t = 100
(a) Histogram of final𝐼𝑅
10 12 14
8 6 4 2 0
De
n
si
ty
0.0 0.2 0.4 0.6 0.8 1.0
)LPopulation at t = 100
(b) Histogram of final𝐼𝐿
10 12 14
8 6 4 2 0
De
n
si
ty
0.0 0.2 0.4 0.6 0.8 1.0
)PPopulation at t = 100
(c) Histogram of final𝐼𝑃
1.5e-05
1.0e-05
5.0e-06
0.0e+00
B
en
ign
Dea
th
R
at
e
500 1000 1500 2000
Node Density
(d) Node density vs. benign death rate
Density
500 1000 1500 2000
1.0 0.8 0.6 0.4 0.2 0.0
I a
t t = 100
(e) Node density vs. finalI
10 8 6 4 2 1.000 0.995 0.990 0.985 0.980 0.975 0.970
N a
t t = 100
Total WSNs
[image:9.600.71.530.68.485.2](f) Total WSNs vs. finalN
Figure 2: Histograms and parameter relationships from the Monte Carlo simulation.
peak values faster, whilst the downward slope caused by deaths remains constant.
5. Discussion
5.1. Implications for Malicious Actors. Our findings have a
number of real-world consequences. In this section, we analyse the simulation results to identify how botmasters may achieve better propagation results.
We considered propagation methods with access to
differ-ent proportions of theSpopulation in order to get a
macro-scopic view of a larger sensor node population. (Conversely, if the model scope was at the local or neighbour level, we would have a microscopic view of those populations.) In doing so, we found that local and neighbour set infections tend to remain endemic and do not have significant impact on the larger population, unless the attack force or node density is very large. In parallel, these factors also impact power usage and hence the network lifetime. All of this means that a
lower contact rate with further reach is more potent than a higher contact rate with a shorter reach. This is significant for botmasters, who will prefer a propagation method which achieves the largest increase (with the widest spread) in the shortest time.
0.00030
0.00020
0.00010
0.00000
Dea
th
R
at
e f
o
r R
0 100 200 300 400 500 600
Contact Rate for R
(a) Contact rate forRvs. death rate forR(𝑑𝑡ℎ𝑅)
1.0
0.8
0.6
0.4
0.2
0.0
)0
P
opu
la
ti
on
0 5 10 15 20
Time
sim#1
sim#2
sim#3
sim#4
sim#5
(b)𝐼𝑃whereP’s contactrate= {5, 50, 100, 500, 1000}
Figure 3: Plots showing the impact of contact rates in numerical and Monte Carlo simulations.
More aggressive propagation campaigns will consume more energy, such that an overaggressive strategy may become inefficient as nodes die at a rate equal to or greater
than the rate of infection. A slow decline in theIpopulation
means that the botnet population is steady. Hence, botmasters are likely to gain a larger botnet via random scanning when they can keep contact rate at a reasonable level. Botmasters may try to maximise the contacts-to-infections ratio (via the transmission probability) to maintain a larger number of bot nodes without driving up death rates. Furthermore, propagation messages should remain small to consume less energy during transmission. This will also be relevant for continuous C&C traffic.
Node density plays a central role in network lifetime. Denser networks were shown to consume less energy at the individual node level to send and receive data. This, combined with the larger number of possible bots, makes dense WSNs more desirable targets for botnet formation. WSNs with a lot of activity may be attractive if node hardware is of a higher specification to deal with this (e.g., higher battery capacity or larger transmission range). If the WSN only contains average nodes, however, a highly active network will probably be undesirable for botmasters as network lifetime will be compromised. A possible solution to this would be the addition of bot functionality which cancels scheduled tasks to reduce power depletion.
5.2. Implications for Defensive Actors. Now that we have
discussed our results from the botmaster’s perspective, we go on to consider how our findings can provide insight for defenders and improve the security of IoT networks.
When implementing WSN-based security provisions, individual nodes do not usually possess the processing power or energy capacity for host-based detection. Therefore, a network-based mechanism is required. The simulation results
showed that propagation dynamics can change at different community levels (i.e., inter-WSN vs. intra-WSN vs. between neighbours). Therefore, it may be beneficial to add network monitors at each level to identify small-scale spread or endemics sooner. This could form the basis for an IoT-specific variation of the defence-in-depth security paradigm.
In reflection of theIoT-SISmodel’s outputs, detection
approaches should prioritise instances of random-scanning behaviour, as this was shown to increase the chance of an epidemic. This type of scanning can be characterised by a pattern of probing behaviour (to identify the presence of a worm) combined with a large number of outgoing connections and the indiscriminate selection of destination IPs. Furthermore, detection methods would benefit from considering slower scanning as we identified that keeping contact rate minimal can result in better bot node retention. Slow scanning rates can also be used as an obfuscation method by botmasters.
Alongside the data they collect from the environment, sensors also generate and share telemetry data which describes a node’s status (e.g., current engagement, current location, role in the current topology, and power levels) as well as various details on its communications with other
nodes. The IoT-SIS model demonstrated that nodes are
likely to deplete their finite power resources more quickly when they become bots. Hence, telemetry data can be used to monitor nodes’ battery levels, delays in the execution of scheduled tasks (aimed to conserve power), or patterns of anomalous communication behaviour caused by botnets’ reliance on automation.
message lengths, connection durations, various timestamps, power levels, and, where relevant, GPS coordinates. Since bot traffic is repetitive and systematic by nature, detection can be achieved in encrypted networks through pattern identification in this telemetry data.
When developing immunisation schemes to deal with ongoing epidemics, a common approach is to minimise the frequency of contacts between infected and susceptible nodes to reduce the number of new infections. However, we found that propagation can be more successful if the contacts-to-infections ratio is maximised instead of the contact rate which may (a) cause more node deaths and (b) reveal bots’ presence to defenders. To reduce the number of successful infections, defenders should focus on securing individual nodes via proper login credentials (changed periodically), updated and fully patched software, and the disabling of unnecessary services. This is aimed at reducing the trans-mission probability, and experience shows that such simple steps could mitigate existing IoT worms like Mirai [2]. We believe that this approach is more pragmatic than blocking connections or taking nodes offline which can have a negative impact on routing and network convergence. Additionally, immunisation and recovery efforts should be applied across all potentially targeted WSNs for effective mitigation, as random scanning was shown to be able to drive the bot malware successfully across multiple WSNs for wide-scale coverage. Hence, immunisation must be equally widespread in its scope.
We should consider dense networks of high-grade sen-sors to be particularly desirable for botmasters. P2P com-munications should be well controlled and monitored to ensure that compromises to the local network have limited impact. In extreme cases (and where functionality is not affected), P2P may even be disabled entirely. This may be particularly relevant for home environments consisting of few or individual sensors (rather than a set of collaborative sensors).
Our results suggest that multiple small but dense WSNs (with minimal P2P contact) are better at preventing bot epidemics. In our model scenario, the denser the network, the lesser the energy used by individual nodes (causing fewer node deaths) and the smaller the attack surface (capping the reach of the malware). However, in real-life, this should be considered in the context of the features of the given network, including its application and the protocols used, in order to avoid generalisations which overlook the particularities of different scenarios. Furthermore, the suggestion to use small, dense WSNs needs to be balanced with the routing performance and application requirements specific to each scenario.
Since propagation is a difficult process for detection in real-time, as part of our future work, we would like to explore how propagation models such as ours can be aligned with real-life networks and measurements of traffic to create an application framework. The framework would aim to help users yield meaningful predictions and to aid early detection. Furthermore, we have taken a simplified macroscopic view of IoT networks in this model. However, research suggests that sink nodes are more vulnerable to power depletion due
to their role as a gateway for all incoming/outgoing traffic. Hence, in our future work, we would like to consider the role this plays in botnet propagation.
6. Related Work
6.1. Existing Propagation Models. Malware propagation is a
difficult but significant process to observe and measure to be able to effectively tackle the threat of cybercrime. Hence, there is a range of literature on the subject, and despite most of it dealing with malware in conventional and mobile networks, there has been a push in recent years to expand this into the analysis of WSNs and IoT. Proposed models tend to follow the state-based transition approach provided by epidemiology given its clear definitions and simple structure—a trend that this work also follows. WSN-based models focus on particu-larities of the environment, like node mobility, transmission range/radius, topological variances impacting node density, and energy usage, alongside more typical factors like user awareness and recovery rates. The following is a selection of existing research chosen to demonstrate the state-of-the-art and to provide context for our work.
Wang et al. [14] designed a state-based model to observe worm propagation in WSNs with mobile actuators. The authors suggest that actuators can increase the speed of worm spread if successfully compromised. The model probabilisti-cally estimates node states to “microscopiprobabilisti-cally compute the prior probability” of individual sensor infections via directly
connected neighbours [14]. Nodes may be susceptible (S),
contagious (C), or infected (I) and are deployed with an
infected mobile actuator moving randomly amongst them.
The infection’s spatial distribution is defined based onInode
locality. This includes the identification of S nodes with
and without infected neighbours. The energy consumed by the network is calculated based on a percentage increase in consumption in individual nodes after infection. The model was simulated and compared to others and reportedly produced different results for different node density values. Overall, the authors report that the inclusion of an infected mobile actuator improved worm propagation across the test scenarios, including high and low-density cases. The mobile worm was also found to increase energy consumption when compared to similar static worms.
Ji et al. [19] focused their work on Mirai’s architecture to study its propagation patterns. They based their propagation
model on the SIRformat, with N defined as the total IoT
population, Sas IoT nodes with weak logins, I as infected
nodes, andRas immune nodes. The online device count is
Smultiplied by the rate that devices come online𝛼, whilst the
infection count is the product of𝛼andI. The attack surface
is the product of𝛼and (𝑁 − 𝑃), wherePis the portion of the
address space to be ignored. The authors state that because Mirai bots did not infect targets directly (using the loader instead), the model should assume that IoT devices do not cause secondary infections. They also suggest that increase
in theIpopulation will increase traffic load for the network.
Hence, they propose that the infection rate will decrease as
I grows. Using simulations based on estimates of the US
steadily for a time before slowing down, due to the depletion of ‘easy’ targets.
Singh et al. [20] studied worm propagation in WSNs
using the SEIRV model, where E denotes nodes which
are infected but not infectious, who transition into the
infectious stateI, andV denotes vaccinated nodes who are
permanently immune. Nodes are uniformly distributed with
a transmission range of r, and the transmission region of
individuals is calculated based on this. The authors use the
basic reproductive number R0to define equilibrium points
and then to evaluate the system’s stability at these points. Through this approach, they define thresholds for both the transmission radius and the density and then use these to test different values for these 2 parameters. They were then able to demonstrate the relationships between the thresholds and the equilibrium points; i.e., epidemics fail when the radius or density is less than the threshold and are successful otherwise. Gardner et al. [21] developed the IoT-BAI (IoT Botnet
with Attack Information) model, based on the SEIRS
for-mat. The model is grounded on the propagation dynamics of Mirai-like malware and considers the impact of user behaviours, specifically in relation to increased awareness following a publicised attack. Nodes may transition into
theRstate from any other state, and the rates of recovery
increase for a finite period following an attack. Hence, there are 2 sets of recovery rates; one during propagation (“Botnet Growth Phase”) and one during the increased awareness period (“Botnet Reduction Phase”) [21]. The IoT-BAI model does not consider deaths but does incorporate a constant birth rate to reflect the growth of the IoT device population [21]. Based on their simulations, the authors suggest that the constant stream of new devices makes the IoT network increasingly vulnerable. Meanwhile, greater user awareness triggers the Botnet Reduction Phase sooner and increases the time between epidemics, theoretically reducing botnet impact.
Mishra et al. [22] created theSEIRS-Vmodel (where
S-Vrepresents susceptible nodes who have received a
vaccina-tion) to study the propagation of worms in WSNs. The model
includes births (A) as well as deaths. Two separate death rates
are defined: 𝜇 for standard hardware/software failures and
𝜀for device failures caused by worm infections. Birth and
death rates are such when there is no malware, the population size can be estimated as the ‘carrying capacity’, which is
defined byA/𝜇. There are also separate rates for recovery and
vaccination and, consequently, there are separate immunity periods associated with each. The authors use MATLAB for simulations and show that greater emphasis on recovery and vaccination can significantly mitigate the scale of infections
by absorbing moreSnodes into theRandS-Vcompartments.
Hence, susceptibility of nodes to future infections is reduced. They also stress the expansive applications of WSNs in various areas of industry and healthcare, highlighting the need for effective malware defences.
Feng et al. [23] used theSIRSmodel to consider worm
propagation in WSNs with a focus on nodes’ transmission radius, energy consumption, and the network density. The model assumes a uniform distribution of nodes in a 2D space,
and nodes may recover from both S and I states. Nodes
may die in each compartment due to power depletion at the defined death rate, whilst some recovered nodes may probabilistically become susceptible again. Based on the
reproductive ratio 𝑅0, the authors define a threshold for
the transmission radius such that for a value lower than
this threshold and with𝑅0 ≤ 1, the worm cannot survive.
Similarly, they define a threshold for node density such that
for a value lower than this and with 𝑅0 ≤ 1, a
“worm-free equilibrium” is maintained [23]. Through numerical simulations they consequently demonstrate that a smaller transmission radius or lower network density can mitigate worm propagation.
Jerkins et al. [24] used the principles of epidemic mod-elling to boost the security of IoT devices via
“inocula-tion epidemics” using theSI/NS(Susceptible,
Infected/Non-vulnerable, Susceptible) model. They aimed to use a process
similar to malware propagation (via theSISmodel) to identify
vulnerable nodes and patch them. A ‘vaccine’ is developed by reverse-engineering captured malware, specifically focusing on the infection vectors and exploits used. The vaccine then propagates like a worm using the same methods to deliver a patch, thus giving nodes immunity against that
malware. In the model,Ndenotes nodes which are ‘infected’
by the vaccine. Separate infection rates are defined for the malware and the vaccine, such that an epidemic fails when the vaccination rate is greater than the infection rate, and
vice versa. Additionally, nodes may reboot at a rate of𝛽forI
nodes and𝜃forNnodes, such that an epidemic fails if𝛽 > 𝜃.
Through simulations, they demonstrated that increasing the number of nodes which are vaccinated against the malware mitigates its propagation and diminishes its overall impact.
6.2. Comparison to the Proposed Model. Each of these works
approaches the study of WSN-based worm propagation in a different way. Wang et al. [14] focus specifically on the mobile actuator scenario, demonstrating how the IoT space may present unique vulnerabilities and exploitation opportunities. Ji et al. [19] provide a specialised model for the Mirai botnet, driven by a need to understand the propagation of this prevalent threat. Singh et al. [20] and Feng et al. [23] focus
on defining𝑅0-based thresholds, using the epidemic-based
metric to determine the limits of spread. Both Gardner et al. [21] and Mishra et al. [22] emphasise recovery, considering the impact of user behaviours and vaccinations, respectively. Meanwhile, Jerkins et al. [24] presented a novel approach by appropriating epidemic processes for defence.
proposed model considers a wider range of behaviours by incorporating observations from Mirai’s descendants as well. We believe that this expands the models applicability as a result. Furthermore, the scenarios used by the related works are based on standard wireless sensor nodes, whereas our model is designed specifically with IoT-based sensors in mind the difference being that IoT devices have constant Internet connectivity.
These papers also have vague or abstract definitions of scanning behaviour, assuming a standard approach across all bot instances. An exception to this is Ji et al. [19], who consider the attack surface to be defined based on the infection rate and omitted portions of the IP address space.
Meanwhile, theIoT-SISmodel defines 3 separate and clearly
defined scanning behaviours, along with the corresponding attack surfaces that become available with each method. This is justified based on observed bot behaviours. Mirai is known to engage in random, global scanning (omitting certain known IP ranges) [1, 2], and HideNSeek was observed to scan locally, changing its methods when source and target nodes were in the same LAN [4]. Finally, sensor nodes have P2P connectivity, which is a well-established botnet propagation method in conventional networks, and so should be considered in the IoT context as well.
We found that death rates were used inconsistently across existing propagation models, with varying levels of importance placed on this transition. Ji et al. [19] and Gardner et al. [21] did not consider death rates, despite their empirical focus on Mirai. Mishra et al. [22] and Feng et al. [23] did incorporate death rates, with the former being somewhat similar to our work because separate death rates are included for both normal and malicious processes. However, neither of these works is in the context of botnets, and hence they do not consider the effect of deaths on botnet formation. We address this and additionally provide a definition of the death rate based on node characteristics and communication behaviours. Furthermore, the proposed method aims to explore the relationship between deaths and propagation activity by relating energy depletion to scanning behaviours via contact rates. The rationale is that contact frequency determines the amount of node energy consumed for communication, whilst also determining the number of
possible infections based on contacts betweenSandInodes.
We believe that this has not been demonstrated before. By making the model specific to IoT-based botnets and incorporating different types of scanning and deaths, we were able to identify some dynamics which, to our knowledge, have not been presented in the existing literature. Simulations
of theIoT-SISmodel showed that the propagation method
and the available attack space impact the spatial distribution of bot nodes, such that methods limiting spread to nearby nodes tend to cause intra-WSN endemics rather that epi-demics. We also found that driving the malware to propagate faster/harder causes nodes to consume more of their finite energy, thereby endangering the longevity and consistency of the botnet. Based on this, we were able to determine that propagation strategies in IoT networks are more effective if the transmission probability can be maximised instead of the contact rate.
Therefore, this paper sits alongside existing works (such as those discussed here) by providing a general model of worm-based botnet propagation in WSNs to explore the key characteristics of IoT networks at a macroscopic level. Our model is not based on a specific scenario, a specific malware strain, or aimed at deriving particular measurements. Instead, we explore the factors at play in botnet formation. We believe that there is a need for this kind of approach due to the unique features of botnets that set them apart from other types of malware and the unique features of IoT networks which give rise to different environments and scenarios to those of conventional networks.
7. Conclusions
In this paper, we have developed the novelIoT-SISbotnet
propagation model focused on IoT sensor networks and explored how the IoT-specific characteristics may impact bot-net formation. We were able to improve our understanding of the botnet threat amongst sensor devices and to explore the relationships between network density, node power, scanning behaviours, and attack surface size for different scanning methods. Our simulations showed that dense networks allow better distribution of activity, resulting in longer lifespans for individual bots, and that aggressive propagation approaches can be counterproductive in procuring nodes. We also showed that scanning rates and transmission probability must be increased significantly in order to overcome capped
Spopulations. In the continuation of this research, we hope to
explore ways to improve the accuracy of propagation models and to better align compartmental models with network-based traffic analysis. In future models, we aim to look more closely at particular IoT-specific phenomena, including the rapid power depletion of sink nodes, the use of encryption, and the impact of mobility.
Data Availability
No data were used to support this study.
Conflicts of Interest
The authors declare that they have no conflicts of interest.
References
[1] C. Kolias, G. Kambourakis, A. Stavrou, and J. Voas, “DDoS in the IoT: Mirai and other botnets,”IEEE Computer Society, vol. 50, no. 7, pp. 80–84, 2017.
[2] M. Antonakakis, T. April, M. Bailey et al., “Understanding the Mirai Botnet,” in Proceedings of the USENIX Security Symposium, pp. 1092–1110, 2017.
[3] G. Kambourakis, C. Kolias, and A. Stavrou, “The Mirai botnet and the IoT Zombie Armies,” in Proceedings of the IEEE Military Communications Conference, MILCOM 2017, pp. 267– 272, IEEE, October 2017.
.bitdefender.com/2018/01/new-hide-n-seek-iot-botnet-using- custom-built-peer-to-peer-communication-spotted-in-the-wild/.
[5] W. O. Kermack and A. G. McKendrick, “A contribution to the mathematical theory of epidemics,” inProceedings of the Royal Society of London. Series A, Containing Papers of a Mathematical and Physical Character, vol. 115, no. 772, pp. 700–721, 1927. [6] L. J. Allen, F. Brauer, P. Van den Driessche, and J. Wu,
Mathematical Epidemiology, vol. 1945, Springer, 2008. [7] J. O. Kephart and S. R. White, “Directed-graph epidemiological
models of computer viruses,” inComputation: The Micro and the Macro View, pp. 71–102, World Scientific, 1992.
[8] M. Kocakulak and I. Butun, “An overview of Wireless Sensor Networks towards internet of things,” inProceedings of the Com-puting and Communication Workshop and Conference (CCWC), pp. 1–6, IEEE, 2017, 7th Annual.
[9] J. Zheng and A. Jamalipour, Wireless Sensor Networks: A Networking Perspective, John Wiley & Sons, 2009.
[10] IETF, “RPL: IPv6 Routing Protocol for Low-Power and Lossy Network,” 2018. https://tools.ietf.org/html/rfc6550.
[11] T. IETF, “Objective Function Zero for the Routing Pro-tocol for Low-Power and Lossy Networks (RPL),” 2018. https://tools.ietf.org/html/rfc6552.
[12] G. Nikolic, T. Nikolic, M. Stojcev, B. Petrovic, and G. Jovanovic, “Battery capacity estimation of wireless sensor node,” in Pro-ceedings of the IEEE 30th International Conference on Microelec-tronics (MIEL), pp. 279–282, IEEE, 2017.
[13] K. Kato and W. M. Bart,Encyclopedia of Research Design, SAGE Publications, Inc, 2012.
[14] T. Wang, Q. Wu, S. Wen et al., “Propagation modeling and defending of a mobile sensor worm in wireless sensor and actuator networks,”Sensors, vol. 17, no. 1, p. 139, 2017.
[15] The R Project, The R Project Statistical Computing, 2018. https://www.r-project.org/.
[16] CRAN, “deSolve: Solvers for Initial Value Problems of Differential Equations,” 2018. https://cran.r-project.org/web/ packages/deSolve/index.html.
[17] CRAN, “MonteCarlo: Automatic Parallelised Monte Carlo Sim-ulations,” 2018. https://cran.r-project.org/web/packages/Mon-teCarlo/index.html.
[18] S. Karsten, G. Rave, and J. Krieter, “Monte Carlo simulation of classical swine fever epidemics and control: I. General concepts and description of the model,”Veterinary Microbiology, vol. 108, no. 3-4, pp. 187–198, 2005.
[19] Y. Ji, L. Yao, S. Liu, H. Yao, Q. Ye, and R. Wang, “The study on the botnet and its prevention policies in the internet of things,” inProceedings of the 2018 IEEE 22nd International Conference on Computer Supported Cooperative Work in Design (CSCWD), pp. 837–842, Nanjing, China, May 2018.
[20] A. Singh, A. K. Awasthi, K. Singh, and P. K. Srivastava, “Modeling and analysis of worm propagation in wireless sensor networks,”Wireless Personal Communications, vol. 98, no. 3, pp. 2535–2551, 2018.
[21] M. T. Gardner, C. Beard, and D. Medhi, “Using SEIRS Epidemic Models for IoT Botnets Attacks,” inProceedings of the DRCN 2017 - Design of Reliable Communication Networks 13th Interna-tional Conference, pp. 1–8, 2017, Proceedings of VDE.
[22] B. K. Mishra and N. Keshri, “Mathematical model on the transmission of worms in wireless sensor network,” Applied Mathematical Modelling, vol. 37, no. 6, pp. 4103–4111, 2013. [23] L. Feng, L. Song, Q. Zhao, and H. Wang, “Modeling and stability
analysis of worm propagation in wireless sensor network,”
Mathematical Problems in Engineering, vol. 2015, Article ID 129598, 8 pages, 2015.
International Journal of
Aerospace
Engineering
Hindawiwww.hindawi.com Volume 2018
Robotics
Journal ofHindawi
www.hindawi.com Volume 2018
Hindawi
www.hindawi.com Volume 2018
Active and Passive Electronic Components
VLSI Design
Hindawi
www.hindawi.com Volume 2018
Hindawi
www.hindawi.com Volume 2018
Shock and Vibration
Hindawi
www.hindawi.com Volume 2018
Civil Engineering
Advances inAcoustics and VibrationAdvances in Hindawi
www.hindawi.com Volume 2018
Hindawi
www.hindawi.com Volume 2018 Electrical and Computer Engineering
Journal of
Advances in OptoElectronics
Hindawi
www.hindawi.com Volume 2018
Hindawi Publishing Corporation
http://www.hindawi.com Volume 2013
Hindawi www.hindawi.com
The Scientific
World Journal
Volume 2018
Control Science and Engineering
Journal of
Hindawi
www.hindawi.com Volume 2018
Hindawi www.hindawi.com
Journal of
Engineering
Volume 2018
Sensors
Journal of Hindawiwww.hindawi.com Volume 2018 Machinery
Hindawi
www.hindawi.com Volume 2018
Modelling & Simulation in Engineering
Hindawi
www.hindawi.com Volume 2018
Hindawi
www.hindawi.com Volume 2018
Chemical Engineering
International Journal of Antennas and Propagation International Journal of
Hindawi
www.hindawi.com Volume 2018 Hindawi
www.hindawi.com Volume 2018
Navigation and Observation International Journal of
Hindawi
www.hindawi.com Volume 2018