Resource
Inspiring leaders to
improve children’s lives
Schools and academies
Performance beyond expectations
Principal investigators: Andy Hargreaves and Alma Harris
Contents
Acknowledgements ...3
1 Introduction ...4
2 Criteria of performing beyond expectations ...6
3 Case study descriptions and indicators ...10
4 Leading beyond expectations ...35
5 The F15s of performing beyond expectations ...44
6 Five fallacies of change and turnaround ...70
7 Implications for school leaders ...76
Appendix 1: Coding framework ...78
Appendix 2: Interview schedule ...82
References ...83
Acknowledgements
We are grateful to the Specialist Schools and Academies Trust and the National College for School Leadership for sponsoring this project; for supporting the team through the peaks and troughs that come with a project as complex, demanding and unprecedented as this; for believing that this was a project worth doing and that could be done; and for appreciating that there would be important findings and insights to share with school and system leaders about performance beyond expectations.
1 Introduction
“The greater danger for most of us lies not in setting our aim too high and falling short;
but in setting our aim too low and achieving our mark.”
Michelangelo
“Aim for the sky and you’ll reach the ceiling; aim for the ceiling and you’ll reach the floor.”
Bill Shankly, former manager of Liverpool Football Club 1913–81
1.1. In 2007, a transatlantic research team directed by Professor Andy Hargreaves of Boston College in the United States, and Professor Alma Harris, now of the London Institute of Education, sought and secured funding from the National College for Leadership of Schools and Children’s Services and the Specialist Schools and Academies Trust in England to undertake an unprecedented, firsthand research study of organisations that perform above expectations in business, sport and education. The health sector was also included in the initial plan but was later withdrawn. As far as the researchers could determine, no study on such a scale using firsthand data in public and private sector organisations across a range of personnel beyond the chief executive officer (CEO) had ever been conducted or published before.
1.2. The study explores how organisations in the private and public sector can achieve exceptionally high performance, given their history, size, client base and previous performance. It probes what it means to exceed expectations, the different definitions of performing beyond expectations that exist and prevail, and the leadership practices within organisations that enable these organisations to excel and outperform others.
1.3. The study addressed three key research questions:
— What characteristics make organisations of different types successful and sustainable, far beyond expectations?
— How does sustainability of performance beyond expectations in leadership and change manifest itself in education compared with other sectors?
— What are the implications for schools and school leaders?
1.4. We found that leading an organisation far beyond expectations entails an arduous yet inspiring journey. It is to be engaged in an epic narrative where organisational leaders and players:
— strive to reach a clear and compelling destination in relation to an unwanted or underestimated
departure point
— establish solid underpinnings and creative pathways as well as clear indicators of progress for reaching
the desired destination
— cultivate and co-ordinate everyone’s capabilities to embark on and complete the challenging journey
together
— develop the drive that maintains momentum and provides the steering and direction that ensures the
1.5. Leading and performing beyond expectations is evident in many fields. It is, for instance, the subject of some of the greatest narratives of history, politics, religion and literature – Moses in Exodus, Henry V at Agincourt, Frodo Baggins of Middle-earth, Dorothy on the Yellow Brick Road to Oz, and Barack Obama in the US presidency among them. In all of them, an unlikely and sometimes reluctant leader, who emerges from beneath or comes from beyond, gathers and galvanises a group of oddly assorted individuals with unrealised talents and capabilities. They set out from humble and sometimes humiliating beginnings on a treacherous yet sometimes thrilling journey, overcoming many obstacles, towards a distant and improbable destination, which offers almost unimaginable prospects of safety, security and success beyond measure for themselves and their wider community. This extraordinary leadership is also evident in business, sport and education.
1.6. This research is based on extensive literature reviews of performance beyond expectations in business, sport and education and on detailed case studies of 18 organisations, in multiple sectors, across 5 countries and 3 continents. We recorded and transcribed more than 220 interviews. After extensive analysis, we wrote original case study reports of between 8,000 and 16,000 words each to be approved by the participating
organisations according to the ethical protocols of the participating universities1. These reports also drew on
the collection and analysis of extensive archival, documentary and website data such as mission statements, programme information, press articles, financial performance data, published rankings on various indices, and official histories of and research studies on the organisations in question. Except in one geographically remote instance, at least two of the nine research team members conducted the case studies to strengthen claims of validity. Details of the project’s methodology are provided in Appendix 1.
1.7. The 18 case studies in this unique project provide a disciplined and diverse sample of organisations that exceed expectations. They stretch from large multinationals, through national and regional organisations, to relatively small companies, primary schools and sports teams. Some are mainstream, globally known brands. Other are alternative and innovative icons in their sectors. In some instances, the histories of the
organisations extend back over a century – they have clearly been ‘built to last’2. In other cases, the sample
includes essential and influential new entrants on the innovative terrain of their sector’s landscape – internet companies, co-operatively owned industries and privately run public sector organisations, for example.
1.8. The nine education case studies comprise two local authorities (Tower Hamlets and Walsall), a strategic partnership of one school improving with the support of another (Central Technology College in Gloucestershire), two secondary schools (Grange Secondary in Oldham and John Cabot Academy in Bristol), three primary schools (Kanes Hill in Southampton, and Limeside and Mills Hill in Oldham) and a multi-site special education centre (West Oaks North-East Specialist Inclusive Learning Centre in Leeds).
2 Criteria of performing beyond expectations
2.1. Not all the organisations in our sample are ones we first contacted or investigated in the preliminary stages of this research. Many organisations – some of them extremely well-known brands such as a leading premier league football club and a national medical organisation of worldwide renown – had to be rejected because they did not meet the criteria of the research. On closer scrutiny, some were perhaps peak performers but not especially above expectations given their extremely high levels of investment and support. Some were merely striving to perform above expectations but had not yet succeeded in doing so. In other cases, the official performance of the organisations in question was ethically compromised.
2.2. Each was eventually included only because of clear evidence that it met one or more of three clear performance criteria, demonstrating:
— sequential performance beyond expectations over time through revival or awakening after previous poor
performance, or attainment of high success following unheralded early beginnings
— comparative performance beyond expectations in relation to high levels of achievement compared with
peers
— contextual performance beyond expectations as evidenced in strong records of success despite various
indicators of relatively weak investment, limited resource capacity or very challenging circumstances
2.3. All the case studies included had to meet standards of organisational responsibility or ethical
performance beyond expectations in their treatment of workers, clients and the community. In more detail, these criteria involve sequential, contextual, comparative and ethical performance beyond expectations.
2.3.1. Sequential performance beyond expectations
Many of the case studies selected had faced bankruptcy, relegation, takeover, closure or public and professional ignominy after damning reports and disastrous results, yet they had turned around to achieve not only solvency and survival but also impressive levels of success. Fiat Motors, M&S, Scott Bader, Burnley Football Club, Hull Kingston Rovers, Walsall local authority, Tower Hamlets local authority, Grange Secondary School, Central Technology College, and Kanes Hill and Limeside primary schools all achieved remarkable revivals. In some cases, the declines and recoveries of coasting organisations that had been trading on past reputations, or that had experienced then recovered from unexpected performance dips, were less dramatic but nonetheless real. Cricket Australia, John Cabot Academy and Mills Hill Primary School all exemplify this sort of awakening.
2.3.2. Contextual performance beyond expectations
This was not feasible given the scope of the study. It is worth mentioning, however, that in comparison with other turnaround companies that often hire and fire at will, Fiat Motors turned around with a heavily unionised Italian workforce where dramatic improvements were attained, initially without closing a single factory (although, in 2010, the management has suggested this might be necessary).
2.3.3. Comparative performance beyond expectations
Organisations that perform above expectations often do so in relation to similarly placed peers, or after having improbable origins – frequently receiving awards and accolades for doing so. Through exceptional innovation and sustainable growth, these organisations outperform most or all of their counterparts over long periods of time. While almost all the organisations in this study fit this criterion to some degree – such as the schools that receive outstanding inspection reports, or the sporting organisations that do far better than their wealthier peers – the organisations for which this peer factor is the primary criterion of performing beyond expectations include Dogfish Head Craft Brewery, which endured an uneven start-up and went on to outperform most other US microbreweries; Shoebuy.com, which survived the dotcom bust and global economic collapse to win entrepreneur of the year awards and become the seventh largest internet shopping site; and Kilkenny Hurling, which attained consistently high levels of trophy-winning achievement compared with its peers, without any additional levels of investment that might otherwise explain its advantage.
2.3.4. Ethical performance beyond expectations
In addition to these criteria of performing beyond expectations, we have taken scrupulous care to exclude organisations that have questionable records of ethical integrity. The project has no interest in investigating and thereby elevating organisations that perform above expectations by ethically problematic means. Therefore, we have excluded retail organisations with records of possible labour exploitation in the
developing world; energy companies with clear histories of avoiding responsibility for lowering their impact on environmental pollution; sports clubs under non-transparent, anonymous ownership; or schools and local authorities that manufacture the appearance of improvement by manipulating test score results through measures such as concentrating disproportionate attention on borderline students who will produce quick lifts in measured performance at the expense of the rest.
2.3.4.1. While we have ruled out the most obviously ethically problematic cases on the grounds discussed above, we also acknowledge that the ethical criteria for inclusion and exclusion are not always clear-cut. Like other criteria for performance beyond expectations, these too are open to argument and debate in some instances. One school in this study had a strategic partner that introduced an effective yet publicly controversial behaviour management strategy, which was criticised for treating the most severe cases of misbehaviour using complete isolation of offending students from their peers. Schools, like two of those in this study, which improve results in examination passes through students taking high numbers of art and technology courses, are defended by their advocates on the grounds that they concentrate on the curriculum that suits the interests and learning styles of their students, yet they are criticised by opponents for ignoring core subjects and concentrating on easier options.
2.3.4.2. Several of our sports teams struggle with developing a successful approach to promoting racial diversity on and off the field. In the business sector, not everyone might be comfortable with including a case study of an organisation that produces alcoholic beverages. And in the aftermath of a global financial collapse, no one can be completely certain that the companies in this study will be able to maintain their high standards of corporate social responsibility in avoiding the exploitative labour practices sometimes adopted by lower-priced competitors, or in maintaining the safety standards of the auto industry, which
have been breached by competitors when they have tried to produce too quickly or expand too fast3. Ethical
integrity is not a one-time accomplishment but a continuing struggle and quest, and sometimes a matter of argument and debate.
confidence. Retaining only those cases of performance beyond expectations in the sample that survived the research period would provide no assurance they would still survive one or two years later. Jim Collins’ book How the Mighty Fall, written after the global economic collapse of 2007-08, points out that some of the companies that have gone into precipitous decline were once the very companies Collins picked out as
improving in Good to Great or described as being ‘built to last’4.
2.4.1. During the course of this project, some organisations have undergone remarkable and unexpected transformations as a result of external events largely beyond their control. On the day of our site visit in Turin, it became publicly apparent that in the midst of a global recession, Fiat Motors would merge with and possibly take over Chrysler Motors. Not only does this mean that in some respects it is now another organisation altogether, but the fate of the merger is not a foregone conclusion – indeed, the CEO’s annual report in April 2010 indicated that progress had fallen short of turnaround targets at that point. Cricket Australia lost the Ashes to England for the second time in four years, after dominating the international series for a decade before. Burnley Football Club was included because it sustained solid status in the English championship league despite inferior levels of support compared with most of its peers. In the midst of this study, it then improbably exceeded even these expectations by being promoted into the premiership. Yet after an initial run of very promising results, its inspirational manager and management team were headhunted in mid-season by a similarly placed but wealthier competitor – a move that then plunged the club into a reverse trajectory of decline within a matter of months. And two of the study’s high-performing and dramatically turned-around schools were closed and converted into city academies because of a wider social cohesion agenda in one case, and in the other after failing by one per cent (the equivalent of less than one pupil) to meet the government’s newly defined floor targets for A*–C grade passes at GCSE.
2.5. Finally, what counts as performance beyond expectations, and who has the authority to award its status, are often not fully clear and are frequently contested on ethical, professional and technical grounds. Some sports teams put financial stability and sustainability over achieving the highest league position at any price, while competitors risk indebtedness to enhance their league position. Some companies celebrate being sector leaders in profits and growth, while others prefer to be a trusted brand leader or high performer on criteria of corporate social responsibility as long as their market position is strong enough. Existing leaders are often inclined to single out and celebrate high performance for which they can claim responsibility, whereas new leaders seeking organisational or political leverage are more inclined to point to evidence or indicators of failure and underperformance as an impetus for enhancing their authority to initiate remedial measures that will underpin their reputation for bringing about effective change and eventual success. In order to maintain momentum, private and sporting organisations often keep setting new targets for growth, profits, share returns or league standings after existing ones have been met. In the public sector, the strategy also includes altering (sometimes suddenly) the measures or methods themselves – what count as floor targets for examination passes or being designated as a school that is ‘hard to shift’, for example. In all these cases, performance beyond expectations is often subject to technical, professional and political debate and controversy.
2.6. This study highlights four key insights about performance beyond expectations and criteria to measure it.
— Criteria for performance beyond expectations are multiple. They can relate to past performance,
surrounding circumstances or the performance of comparable peers, and on different criteria in each of these cases. There is no single factor that prevails above all others as a gold standard for performance beyond expectations.
— Criteria for performance beyond expectations are controversial and contested. There is often
disagreement about and struggle over which are the most important criteria, and who has the right to define and impose them.
— Performance beyond expectations can be explained but not predicted. Only hindsight is an exact social
science. Criteria for performance beyond expectations, such as the ways in which examination passes are calculated, may be changed, external crises like an economic collapse may intrude, and one kick or strike of the ball can separate stellar success from years of decline in sport.
— In research studies conducted in real time rather than just in hindsight, understanding how performance
2.7. Whether they outperform in relation to their peers, their conditions of operation, or their previous selves, all organisations in this study clearly meet some or all of the criteria for performing beyond expectations on multiple and verifiable indicators of success (Table 1).
2.8. The findings in this research report are based on valid and reliable data derived from a rich set of case studies from within three sectors. The remainder of this report is structured into a further five sections, plus appendices. In section 3, each case study is described, covering its key characteristics, its performance trajectory over time including dips and peaks, and a set of precise, objective indicators of how it performs beyond expectations. Sections 4 and 5 investigate what explains performance beyond expectations. Section 4 gives a brief review of research literature on this subject, and section 5 explains why the 18 organisations in this project perform beyond expectations. There are 15 key factors or F factors, which explain performance beyond expectations and how high-performing leaders secure exceptional performance. At least three examples – one from each sector – are used to support the argument in relation to each of the factors. Section 6 sharpens our analysis and its implications by clarifying what performing beyond expectations does not mean and does not involve. It does this by addressing five common fallacies of change and improvement, which are challenged by the project findings. The final section sets out some implications for school leaders arising from our findings.
Performing beyond expectations
Sequential Contextual Comparative
Revival Awakening
Fiat motors
M&S
Shoebuy.com
Digfish Head
Scott Bader
Burnley Football Club
Cricket Australia
Hull Kingston Rovers
Kilkenny Hurling
Tower Hamlets LA
Walsall LA
Grange School
John Cabot Academy
Central Technology College
West Oaks SILC
Kanes Hill Primary School
Limeside Primary School
Mills Hill Primary School
[image:9.595.96.507.128.531.2]Note: LA = local authority
3 Case study descriptions and indicators
3.1. This section provides an overview of the 18 case studies and the indicators that justify their selection. We found it easiest to access the nine educational sites, which are all in England. They are accustomed to being researched, familiar with the sponsors, and usually cognisant of the professional and published work of the research directors. Obtaining access to business and sports sites was much more challenging. The research team had no established academic credibility with these sectors and few or no networks on which they could draw. There are not many precedents of multiple case studies using firsthand data in sport or business. Single case studies of leading organisations in business and sport tend to go to trusted insiders, hired consultants or high-profile journalists. Sports and business organisations also have to pay attention to guarding their secrets of innovation or training methods, and to managing their image, especially at times of scandal and controversy concerning matters such as player disputes or factory shutdowns. Access to non-educational organisations therefore took many months and usually more than a year to achieve in the face of suspicion from and rejection by many eligible organisations. We eventually had to halt our research in the health sector after extremely time-consuming difficulties with the sector’s ethical review process, which reached a critical point during a national crisis on performance management and duties of care in one health trust.
3.1.1. Despite these obstacles, we were ultimately able to access a wide range of case study sites in business, sport and education, which met the project criteria for performing beyond expectations. This section introduces the background to and performance trajectory of each site and provides clear indicators of how, in what ways and to what extent the case studies do indeed demonstrate performance above expectations.
3.2. Business
The business sector case studies comprise a wide range of five company types: an international auto
manufacturer, a global retail giant, a leading internet shopping site, a craft (real ale) brewing company and a co-operatively owned chemical manufacturer.
3.2.1. Fiat Auto
53.2.1.1. Fabbrica Italiana Automobili Torino (Fiat) has come a long way from the brink of bankruptcy in 2004 when up to 200,000 jobs worldwide were at stake. As one of Ernest Hemingway’s fictional characters put it, the slide towards bankruptcy happened ‘gradually and then suddenly’. Founded in 1899, Fiat had built a classic and honourable reputation throughout most of the 20th century. It was arguably the pioneer of the European car industry. Its creator, Giovanni Agnelli, a former cavalry officer, became the king-like head of a family and corporate dynasty, which ruled Fiat in a regal and patrician style for more than 100 years. The Agnelli family was practically regarded as Italian royalty. For many decades, it was believed that what was good for Fiat Motors was also good for Italy as a nation.
3.2.1.3. When Gianni Agnelli passed away in January 2003, Fiat was not just in decline. It was in crisis. The company had posted losses for three successive years. A dizzying succession of four CEOs in three years failed to produce any indications of turnaround. Even Turin’s mayor felt that Fiat was “a badly run company”.
3.2.1.4. In 2004, an Italian-born Canadian, Sergio Marchionne, took over the reins at Fiat to become the first CEO ever to run the company from outside the influence of the Agnelli family. By 2004, Fiat had become a rudderless organisation in dire financial straits after 17 straight quarters in deficit. Marchionne had inherited what he later described as a ’laughing stock’, even a ‘cadaver’. With doom and gloom still on his side, Sergio Marchionne persuaded US General Motors to pay Fiat $2 billion to withdraw from a partnership with it. By as soon as 2006, he had returned the company to profitability, and by 2008, before the global economic collapse, Fiat’s bottom line was solidly in the black.
3.2.1.5. Fiat’s remarkable performance beyond expectations falls into six domains: financial performance (such as revenue and share value), market share compared with other auto manufacturers, previous performance, honours and awards, indicators of customer satisfaction, and progress in social responsibility. Indicators include:
— 17 quarters in succession of being continuously in the red, followed from 2006 by 2 straight years in the
black, ending only with the collapse of the global economy in 2007 and 2008
— moving from a €1.6 billion loss in 2004 to a profit of €1.6 billion per annum by 2008 – just 20 per cent
short of the €2 billion that Marchionne first predicted when he took over the failing company in 2004
— an increase of about 10 per cent in European market share from 6.6 per cent to 7.2 per cent between
2008 and 2009, despite this period following the global economic downturn and a 3-year period of continuous growth in European market share before the 2008 downturn; market share also continues to grow in Italy and Latin America (where it stands at almost 25 per cent in Brazil); Italian market share has increased from 24 per cent to 33 per cent in 5 years
— the Fiat Group having 5.14 per cent of UK market share in the first 8 months of 2009 – its greatest
percentage of shares since May 2001
— a tripling of share value between 2004 and 2007 and, after the global downturn and drop in share values
across the market, an annual doubling of share value again between August 2008 and 2009
— increases in customer satisfaction levels (as measured by the Customer Satisfaction Index), for instance,
by almost 25 per cent between 2005 and 2006
— awards and honours that include European car of the year 2008 for the Fiat Cinquecento, best city car
for the same model in BBC’s Top Gear awards (2007), Brazilian car of the year for the Fiat Grando Punto (2008) and the internationally juried Autobest award for the Fiat Linea (2008); other awards have been given in areas as diverse as best van of the year and best diesel engine
Figure 1: Fiat’s percentage of worldwide sales, 1998–08
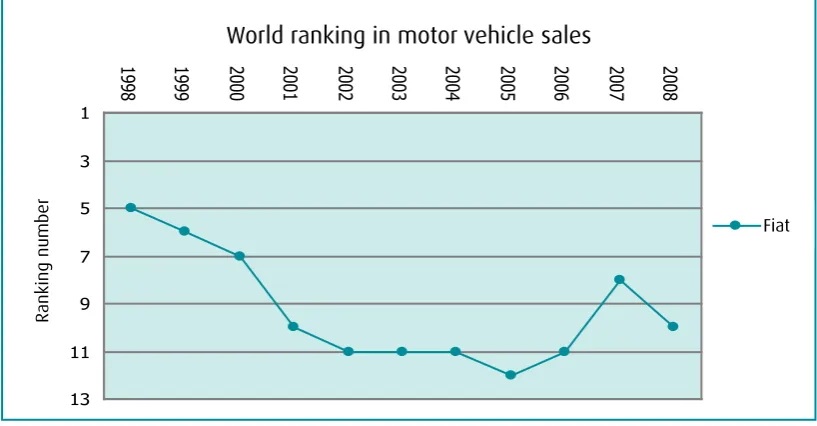
Figure 2: Fiat’s world ranking in motor vehicle sales, 1998–08
3.2.1.7. Just a few years ago, Fiat was ranked below 10th in the world auto manufacturing sector. Its position has steadily improved since 2005, except at the onset of the global economic collapse in 2007 and 2008 and the accompanying crisis in the auto industry (Figures 1 and 2). The completion of Fiat’s merger with Chrysler may now move it into the top three. This is in tune with the ethical aspects of exceeding expectations that are integral to this study – producing energy-efficient vehicles that contribute to combating climate change, supporting human rights through leading-edge and controversial advertising campaigns featuring Nobel peace prize winner Mikhail Gorbachev and actor and human rights activist Richard Gere, and keeping factories open and responding to workers’ concerns wherever possible. Fiat is an improbable icon, a company that has exceeded expectations through its dramatic turnaround, its ability to overtake its peers, and its commitment to doing this with ethical integrity.
5.1
4.7 4.7
4.3
3.7 3.4
3.3 3.1 3.4 3.7 3.6
0 1 2 3 4 5 6
19
98 1999 2000 2001 2002 0320 2004 2005 2006 2007 2008 World Market Share Motor Vehicle Sales
World Ranking in Motor Vehicle Sales
1 3 5 7 9
11 13
19
98 1999 2000 2001 2002 0320 2004 2005 2006 2007 2008
Ra
nk
in
g # Fiat
World market share
World ranking in motor vehicle sales
Ranking number
Fiat
Per
cen
3.2.2. Marks & Spencer
63.2.2.1. Marks & Spencer (M&S) is an iconic British institution. Its retail stores are among the buildings along the high streets of most UK towns and in every city centre. Shops and stores selling furniture, household goods, clothes and food form the nucleus of all its high-street stores and out-of-town shopping centres. In recent years, M&S Food has been sold through mini-markets in service areas along the UK motorway network and in railway stations.
3.2.2.2. M&S is a classic rags-to-riches story started by a Polish immigrant, Michael Marks, who opened a penny bazaar, the Victorian equivalent of Poundland, in Hartlepool in north-east England. After teaming up with Thomas Spencer in 1894, Marks opened the first M&S stall at Kirkgate market in Leeds. The company grew steadily during its first 100 years, establishing stores throughout the United Kingdom with a reputation for selling high-quality goods at reasonable prices with a no-quibble policy of exchanging goods returned as sold. In 1998, M&S became the first British retailer to return a profit of over £1 billion. It seemed firmly established as the nation’s favourite store.
[image:13.595.92.505.446.658.2]3.2.2.3. What the headline profit in 1998 concealed was the unsustainable nature of the store’s expansion into Europe. Just because foreign tourists flocked into its London stores to take home suitcases full of goods, it did not follow that shoppers on the continent would welcome the arrival of M&S with branded British goods on the shopping boulevards of France and Belgium or in Spanish centros comerciales. Lulled into complacency by the loyalty of its home customer base, the company also lost sight of its core values of quality and service, and suffered a precipitous decline in the late 1990s. Meanwhile, the meteoric rise of cool new competition from stores like Next exposed a culture characterised by dull designs and archaic practices, such as refusing to take credit cards or install changing rooms. The boardroom seemed to be detached from changing British customer preferences and employee perceptions. It was also distracted by unsuccessful extensions into the European market and by foreign acquisitions of companies such as Brooks Brothers in the United States. By 1999, the company value on the stock market was down to £7 billion, less than half of the value in late 1997. The worst was still to come.
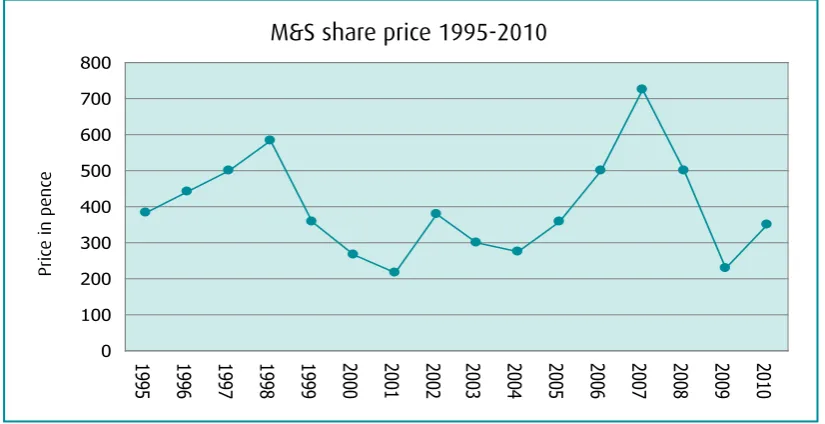
Figure 3: Marks & Spencer’s share price, 1995–10
3.2.2.4. The appointment of high-profile designers produced a false recovery marked by eye-catching collections, but the designers had no loyalty to M&S and exploited their success and moved on, leaving the company no better off than before. It seemed as though M&S had completely lost its way and rumours of a takeover became rife. The major financial speculator and investor, Philip Green, seemed to be biding his time for the best opportunity. In 2004, Green moved to take over the ailing company but was met by fierce resistance from new CEO Stuart Rose, who had once worked as a manager in the M&S food service division. By waiting for the moment when he could maximise his financial advantage, Green had allowed time for Rose to stabilise the company and fight off the bid.
M&S share price 1995 - 2010
0 100 200 300 400 500 600 700 800
19
95 1996 1997 1998 1999 2000 2001 2002 2003 2004 2005 2006 2007 2008 2009 2010
Pr
ice
in
p
en
ce
M&S share price 1995-2010
Pric
e in penc
3.2.2.5. Avoiding takeover is one thing. Increasing turnover is something else. By 2008, M&S had re-established its position as an industry leader by reconnecting the store with its core values of quality, price and value and extending these values into a philosophy and brand identity of ecological sustainability. It recorded £1 billion in profits in the year to March 2008.
3.2.2.6. Like many other large retailers, M&S took a tumble after the global economic collapse, as customers downshifted to cheaper sections of the market, but it has now recovered somewhat and its gross and net profits are now well above 2005 values. In 2009-10, UK sales lifted by almost one per cent, following on from a strong fourth quarter. In the same financial year it had a 4.6 per cent increase in profits growth. M&S’s share value currently tends to follow the trends of the wider market and is fluctuating more unevenly (Figure 3). A deep economic recession in the UK will continue to challenge the company to reconcile its commitment to sustainability with its ability to compete with lower-priced rivals. So, too, might an impending leadership change, though outgoing non-executive chairman Sir Stuart Rose has pledged to work with the new chief executive Mark Bolland to find a suitable successor and ensure a smooth transition.
3.2.2.7. M&S is now ranked as the 43rd largest retailer in the world with 600 stores in the UK and 285 more spread across 40 countries around the globe. In a 2009 survey of 5,000 British consumers, M&S was ranked as the most reputable company out of 140 of the largest UK companies. M&S is also a global sustainability leader in retail on the Dow Jones Sustainability Index. In 2009 it celebrated its 125th anniversary since starting as a penny market stall in Victorian England. Five years earlier, this would have seemed far beyond anyone’s expectations.
3.2.3. Shoebuy.com
73.2.3.1. No study of corporate performance beyond expectations would be complete without inclusion of the internet business sector. Studies of long-lasting companies with durability over decades may provide strong examples of businesses with historic reputations, but they exclude the dotcom sector, which has transformed the economy as dramatically in the 1990s as the rise of the service and retail sectors did in the 1960s and 1970s.
3.2.3.2. Shoebuy.com is one of the leading internet businesses in the United States. Former financial
managers and investors Scott Savitz and his business partner decided to join the dotcom boom after accruing some personal wealth in the financial sector. Their idea of an internet company selling footwear rather than travel services or greeting cards was regarded by some as one of the worst internet ideas ever. Yet, from a makeshift 60 square-metre office in an old converted funeral parlour, Shoebuy.com survived the dotcom bust and now ranks as one of the two major internet footwear retailers and the 7th largest internet shopping site overall, sitting comfortably, though not opulently, with its 150 employees in prime office space in the central business district of Boston.
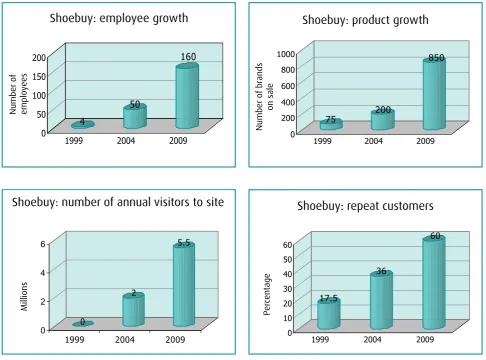
Figure 4: Shoebuy.com performance indicators: 10-year growth through the dotcom bust 1999-09
3.2.3.4. Shoebuy.com is not as large as its major competitor, Zappos, but its inventory-free business design coupled with its emphasis on sustainable growth – which led it to refuse venture capital – and the prospect of rapid expansion in its early days have meant that even in the middle of the global economic crisis, Shoebuy.com continues to grow while Zappos is downsizing. In 2009, while Zappos was forced to cut at least eight per cent of its staff, Shoebuy.com continued to hire employees and projects another year of double-digit growth in sales volume. Shoebuy does not represent a sudden or meteoric rise to the top but demonstrates calculated, judicious and scalable business performance within a highly competitive market.
3.2.4. Dogfish Head Craft Brewery
83.2.4.1. Started in 1996 in a New York City apartment as a tiny, innovative, one-man craft or real ale brewery, Dogfish Head Craft Brewery in Milton, Delaware, has become one of the most successful models of independent brewing in the United States. Its unique brews, flavoured with ingredients such as Finnish juniper berries and Antarctic water, combined with its near-cult status in the world of craft brewing, have brought it rapid success beyond any and all early expectations. Dogfish Head Craft Brewery prides itself as being off-centre in its product and employees. Even though one of its most popular beers, the 60 Minute IPA, continuously outperforms its peers in taste tests, Dogfish Head does not want it to be its signature beer. The company’s business model is based on constant innovation and surprise, keeping distributors and consumers constantly guessing about what will be available and when.
3.2.4.2. Brewing and selling beer is big business, at least for those who can break into the industry. The top three beer companies selling most beer in the United States are Anheuser-Busch (now Anheuser-Busch InBev), MillerCoors. Together, these major players enjoy roughly 78 per cent of the market share. The remaining 22 per cent is fought over by 17 other large non-craft brewers and over 1,400 craft breweries.
4 50 160 0 50 100 150 200 # em pl oy ees
1999 2004 2009
Shoebuy: employee growth
75 200 850 0 200 400 600 800 1000 # b ra nd s o n s al e
1999 2004 2009
Shoebuy: product growth
0 2 5.5 0 2 4 6
1999 2004 2009
17.5 36 60 0 10 20 30 40 50 60 Per cen ta ge
1999 2004 2009
Shoebuy: Repeat customers
Shoebuy: employee growth
Shoebuy: product growth
Shoebuy: number of annual visitors to site
Shoebuy: repeat customers
Although craft brewers have been gaining market share since 2001, the craft brewing industry has just over four per cent of the US beer market. To put this in sharper focus, Boston Beer Company, with its popular Sam Adams beer, is the largest US craft brewery and boasts less than one per cent market share. Dogfish Head retains a mere 0.002 per cent. In 2008, it ranked 22 among top craft brewing companies by beer sales volume. Since 2003, Dogfish Head has averaged 40 per cent yearly revenue growth. Compared with the 2.1 per cent mean growth of the overall American beer industry in 2008, Dogfish Head’s performance is astonishing (Figures 5 and 6). The company’s growth has outpaced almost every competing craft brewery every year. In some years, Dogfish Head has been the fastest growing brewery in the United States.
[image:16.595.107.466.271.488.2]3.2.4.3. Dogfish Head Craft Brewery is like no other. Where other companies stick to the traditional ingredients of beer, Dogfish adds as many ingredients as it likes, flouting tradition boldly and deliberately. While other brewing companies, even craft breweries, find the one beer that sells the best and claim it as their signature, aficionados of Dogfish Head are not likely to find their favourite beer on the shelf at all times, as many are seasonal or in limited production.
Figure 5: Dogfish Head Craft Brewery’s employee growth, 2005–09
Figure 6: Dogfish Head Craft Brewery’s sales growth, 2005–09
38
47
51
64
80
0 20 40 60 80
#
em
pl
oy
ees
2005 2006 2007 2008 2009
Dogfish Head: Employee growth
29462
40662
54001
74963
96891
0 20000 40000 60000 80000 100000
#
b
ar
re
ls
2005 2006 2007 2008 2009
Dogfish Head: Sales growth
Dogfish Head: employee growth
Dogfish Head: sales growth
Number
o
f emplo
yees
Number
o
f barr
3.2.4.4. Dogfish Head sales have steadily risen over the past several years, and the high levels of production have necessitated building a larger facility and the purchase of new tanks and brewing equipment. The company is poised for a big future. Instead of creating sales plans for growth, however, Dogfish Head is planning for eventually levelling off production because it does not want to exceed its status as a craft brewery by entering the more traditional market of competitors such as Anheuser-Busch InBev.
3.2.5. Scott Bader
93.2.5.1. Scott Bader is a modern, vibrant and successful multinational chemical company, based in the UK, which is owned by its workforce and still operates according to co-operative principles. How a company formed and governed by 19th-century ideals developed by conscientious entrepreneurs out of the industrial revolution could survive and flourish in the highly competitive technological era of the 21st century is surprising and beyond the expectations of its competitors. Today, the £180 million company employs 600 people worldwide. Its plastic resins are used to mould doors, window-frames, and parts for luxury yachts and racing cars.
3.2.5.2. The business was established by Swiss émigré, Ernest Bader, in 1921, and for 30 years it was run as a conventional company. By 1951, Bader was convinced that a world in which capital employed labour was unsustainable. He restructured his company and created Scott Bader Commonwealth on the fundamental principle that labour should employ capital to eliminate social injustice and waste. In doing so, he shared responsibility for the future of the company with its employees. The company continues to operate with this guiding philosophy today.
3.2.5.3. Coming from a lowly background, Bader strongly believed that it was better to work and live through collaboration rather than conflict. Scott Bader is one of a small number of co-operatives in England. When the commonwealth was formed, it gave every worker a stake in the company at a time when workers were still treated as third-class citizens elsewhere. The company established a clear moral framework and set of values, believing strongly in the rights of workers.
3.2.5.4. In 2003, the company faced a financial crisis because of volatility in the chemical industry, and Scott Bader was poorly equipped to react to a continuously changing market. Its management practices were paternalistic and there was hardly any staff turnover in a company that was owned by its workforce and provided a very generous pension scheme. Most of the company’s customers and competitors considered it a dinosaur approaching extinction because it was incapable of responding to the challenges it faced and seemed to be hampered by its outdated philosophy. By 2005, the company owed £18.5 million and looked as though it was on its way to bankruptcy.
3.2.5.5. In the past few years, Scott Bader has undergone a transformation that has made it highly successful while enabling it to retain its guiding principles. The company returned profits of £5 million by 2007, yet it retains the commonwealth’s commitment to ploughing 60 per cent of the profits back into the business to ensure sustainability, and matches all its profit shares with donations to charitable trusts. Profits are being invested in expansion even at a time of financial downturn. While the main manufacturing plant is still located on the Scott Bader estate along with the original family residence and workers’ homes, the company is opening new plants operating on the same principles in Croatia and the United States.
3.3. Sport
3.3.1. Burnley Football Club
103.3.1.1. English football’s premier league is the most successful, widely viewed and economically powerful league of football (or soccer) in the world. Stacked with strong teams, powerful brands and celebrity players, it is a global business as much as a venue for top-class, competitive sport. Expectations are always high and one or more of the top four or five teams are frequently successful. Some 20 years ago, before the globalisation of live English football through satellite and digital TV, and before the accompanying creation of a small and supremely wealthy football club elite, it was still just possible for a team to rise into England’s top division without astronomical levels of investment simply by virtue of good luck and good management.
3.3.1.2. Burnley Football Club – along with neighbouring Accrington and Blackburn Rovers – is one of the 12 clubs that founded the English football league in 1888, the first such league in the world. Along with clubs from the other north-west mill towns, Burnley was for almost 80 years a well-supported and largely successful club, drawing crowds of up to 50,000, even though it took few top trophies – the exception being the FA Cup as long ago as 1914, and the league title in 1921. By the late 1950s and early 1960s, though, Burnley Football Club had entered its golden years. Under the autocratic and patrician chairmanship of large-scale butcher and meat-pie magnate Bob Lord, Burnley had become the top-performing football club in England. By 1960, the club won the English league championship and was a competitive performer in Europe.
3.3.1.3. Amid the crumbling economies of northern English mill towns and in the face of growing
competition from big city teams with high media exposure like Liverpool and Manchester United, Burnley Football Club entered a period of long decline until it was almost relegated to amateur oblivion in 1987. Up to the very last minutes of that season, it was placed 92nd out of the 92 clubs of the English football league – saved only by a last-gasp victory in the final match, by a headed goal from the smallest man on the field. His framed shirt still hangs in the club today. This is arguably one of the greatest turnaround moments in sporting history.
3.3.1.4. Over 20 years, Burnley Football Club rose back up the divisions of the league to achieve mid-table respectability in the second-tier championship league before gaining promotion to the prestigious English premier league in the 2008-09 season and in doing so earning the right to play and sometimes achieve the improbable success of defeating global corporate giants like Manchester United (Figure 7). Although promotion was swiftly followed by relegation, the club has attained a key goal of financial stability and future promotion opportunity from the £48 million of additional income and investment that accompanied its promotion to the premier league.
1 11 21 31 41 51 61 71 81
19
60 1962 1964 1966 1968 1970 1972 1974 1976 1978 1980 1082 8419 1986 1988 1990 1992 1994 9619 1998 2000 2002 2004 2006 2008
Le
ague r
[image:18.595.122.478.546.757.2]anking
Figure 7: Burnley’s position in the English football league, 1960–09
3.3.1.5. It is not just this extraordinary and largely sustained turnaround that marks Burnley Football Club as a sporting club that performs far above expectations. Its status compared with its peers is also revealed by numerous indicators:
— The club’s wage bills until 2008-09 ranked 20th out of 24 in the championship league, with some clubs
on 3 or 4 times the wage bill of Burnley FC, though its league position was always higher at between 13th and 16th.
— Its wage bill in the 2008-09 promotion season ranked halfway in the championship league at £8 million
compared with £17 million for Sheffield United and £25 million for Reading Football Club.
— Its ticket sales ranked 19th to 20th in the championship league.
— The club’s home crowd averages about 12,000 compared with more than double that for clubs like
Sheffield United.
— It has the smallest squad and lowest number of players used in the championship league promotion
season.
— It plays more games than any other team in the championship league because of long runs of success in
knockout cup competitions.
— On national rankings of multiple deprivation, the town of Burnley, the base of the club’s support, is the
fifth most deprived community out of 354 in England.
— The club’s sustainable business model is based on a balanced, prudent budget rather than a rate of
expansion or aspiration for success, which involves the high levels of debt that have led to precipitous declines for several rivals and public controversy even for top performers like Liverpool and Manchester United.
3.3.2 Cricket Australia
113.3.2.1. Cricket Australia consistently ranks among the top three teams in world cricket. Sporting prowess and participation are fundamental to Australian identity, and it is important to be number 1. Most of all, it is essential to beat the historic colonising enemy, England, for the coveted Ashes trophy, which is still keenly and even bitterly contested between the two nations. Indeed, securing the Ashes, a director of Cricket Australia told us, is the unwritten key performance indicator.
3.3.2.2. At the time of our data collection in early 2009, Australia did indeed rank number 1 in international test cricket and second in one-day cricket. It had won the Ashes for 9 out of the preceding 10 years. In 1997, after an Ashes victory that was judged to be less than convincing, Malcolm Speed, who would go on to head the International Cricket Council (ICC), turned Cricket Australia into a global business that would attract and increase income, especially from global media, and both reward and placate its increasingly disgruntled players. The loss of the Ashes in 2005 focused the whole board and indeed the country on the goal of defeating England in 18 months’ time – motivating the national team and elevating levels of participation in cricket.
3.3.2.3. From its offices opposite the impressive Melbourne Cricket Ground, Cricket Australia now
orchestrates the development of all cricketing talent and participation from the age of 7 up to the national team – competing with Rugby Australia, Soccer Australia, Bowls Australia and all 27 other national sporting organisations for viewing, participation rates, spectator revenue, media coverage and consumption of entertainment dollars. These are the new key performance indicators by which the game development and marketing departments of Cricket Australia measure progress and performance yearly and four-yearly. These are some of the indicators:
— In 2008-09, according to the ICC, Australia was ranked number 1 in men’s and women’s cricket at
test-match level, and ranked second, just behind South Africa, in one-day cricket.
— Australia has won the Ashes against England on 9 of the last 11 occasions after winning only 1 Ashes
— Cricket ranks first or second every year in sport participation in Australia – only swimming sometimes surpasses it, and then only in years when the Olympic Games takes place.
— The targets for participation levels (at 550,000) set in 2005 for 2009 were exceeded by 2007.
— In 2006, after the loss of the Ashes, participation grew by over 13 per cent – the largest increase of any
national sport in participation in a 12-month period.
— On every indicator, cricket became the sport of greatest interest to 61 per cent of Australians, making it
Australia’s favourite sport.
3.3.2.4. Cricket in Australia, as elsewhere, is now a business and spectacle as much as a traditional sport, and the Ashes coexist alongside these developments. Much of the modern game of cricket has moved far away from the five-day test match played in starched whites. The sport now has intensely exciting variants that last just one day or a single evening, with neon-costumed players engaging in market-oriented crowd pleasing and power hitting. Australia certainly reaches expectations and even exceeds them in most test-match cricket, especially against England, but its development as a business, and as a commercial and community network of national participation, is equally impressive compared with other sports and sectors.
3.3.3 Hull Kingston Rovers
123.3.3.1. On the eastern edge of England, in the economically depressed former fishing port of Hull, the world-famous rugby league club, Hull Kingston Rovers, plays in the European super league. Such fame may surprise some people who are unfamiliar with the popularity of rugby league in the southern hemisphere, and it would certainly be beyond their expectations. The club’s worldwide reputation stems from the 1980s when the Robins (Hull Kingston Rovers) won every major trophy in rugby league at a time when the game had developed a global presence. The club’s golden era began with a famous 10-5 victory over its neighbour Hull in the 1980 challenge cup final in front of 95,000 spectators at Wembley Stadium. The boardroom clock at Craven Park, the Robins’ home ground, is still stopped at 10 minutes to 5 to commemorate this victory.
3.3.3.2. In the late 1980s, the team and the stadium seemed to crumble together. After the final season at the old ground in 1989, Hull Kingston Rovers was relegated to the second division, and in 1995 to the third. This coincided with the establishment of the European super league in 1996. Facing near-oblivion at the time, the club’s fight back to fourth place in the super league at the end of the 2009 season exceeded everyone’s expectations.
3.3.3.3. The European super league began when English rugby league switched from winter to summer. Sponsored by Sky TV, super league Europe was formed by awarding franchises to 12 clubs. With a guaranteed income from the franchise, super-league clubs can attract and retain the best players. When the franchises were first awarded, it was certain that one super-league place was guaranteed for a team from Hull. With Hull Football Club in the first division and Hull Kingston Rovers in the third division at the time, the Rovers had no chance. They resisted a merger and Hull Football Club won the franchise. The outlook for Hull
Kingston Rovers was bleak. Relative obscurity seemed to be the most favourable future and extinction was a real possibility when an insolvency expert was called in to help save the club.
3.3.3.4. Hull Kingston Rovers came back strongly through the lower divisions and almost made the playoffs in 1999. Instead, they slipped and progress was stalled over the next few years when leadership frequently changed hands. New leadership in 2004 restored confidence and direction; Rovers eventually won the playoffs in 2006 for a place in the super league. Big improvements all round at the club were acknowledged when Hull Kingston Rovers was selected as team of the year in 2008. Then the club rose to fourth place in the super league at the end of 2009, a position far beyond all expectations.
3.3.4. Kilkenny Gaelic Athletic Association
13players, organised and managed by volunteers, also attract a full house for the semi-finals even when the games are televised live across the country and beamed via satellite to almost every Irish bar around the globe.
3.3.4.2. In Ireland and among Irish men and women worldwide, hurling continues to have great importance in its own right. The modern game was constituted by the Gaelic Athletic Association in 1884. A network of over 2,500 Gaelic Athletic Association clubs exists across Ireland, in every parish and village. Hurling remains an amateur sport, which has grown in popularity into the 21st century. There are teams across Europe, Australasia and North America. It is the fastest existing ball game – played at the speed of ice hockey in a field measuring 137 by 82 metres with 15 players in each team.
3.3.4.3. The passion for hurling is widespread throughout County Kilkenny. The walls of the public bar in Langton’s Hotel, Kilkenny are lined with photographs that record and celebrate the successful hurling teams that have played in their famous black and amber stripes over decades. This extended success began in 1904 when the senior hurling team first won the All-Ireland trophy for the county. Over the next nine years, the senior team raised the profile of hurling in Kilkenny by winning seven senior All-Ireland finals. Those sporting heroes laid the foundation of a proud hurling tradition, and a huge love of the game, which has flourished ever since with a record 32 All-Ireland senior hurling championship wins for the Kilkenny Cats (the club’s nickname).
3.3.4.4. There are four reasons for the peak performance and sustained success of Kilkenny Gaelic Athletic Association, which enables it to perform beyond expectations:
— Players are selected for each county team according to their birthplace. In an amateur sport, there are
no transfers of players from one team to another. Consequently, unlike many professional sports, it is impossible in Gaelic games to construct teams by buying the best players. Each county must make do with what it has. Kilkenny has one of the lowest number of Gaelic Athletic Association clubs in Ireland. Because there are only 12 clubs that play at senior level in Kilkenny, the senior team is formed from fewer people than most competitors.
— Although different counties have enjoyed periods of sustained success over the years, only County Cork
had ever won four senior All-Ireland hurling championships in succession. Winning four in a row moved the Kilkenny Cats to the highest level of sustainable success when the team won its fourth consecutive title in 2009.
— The Kilkenny team’s performance in the final at Croke Park on 7 September 2008 was described by all
independent commentators as the greatest display of hurling in history.
— The Gaelic Athletic Association has four county hurling competitions: minor (under 18s), under 21s,
intermediate and senior. Each competition has its own All-Ireland championship. No county had ever won all four simultaneous All-Ireland hurling championships in the same year until Kilkenny achieved this remarkable feat in 2008. In addition, the women’s senior camogie team won the 2008 league title. This strength in depth qualifies the overall organisation, rather than just the senior team, as performing beyond expectations.
3.4. Education
143.4.1. There is a range of educational settings in England where institutions perform beyond expectations: two local authorities (equivalent to US school districts), a strategic partnership of a turned-around school supporting a lower performing peer, and some primary, secondary and special education schools.
3.4.2. Tower Hamlets
3.4.2.2. Tower Hamlets has the highest unemployment rate in the country. The wellbeing of children in the borough ranks 149th out of 149 local authorities. The correlation between material wellbeing and education is the highest (0.80) of all the deprivation indices. Unsurprisingly, Tower Hamlets was bottom of the local authority (formerly local education authority) league tables in 1997. Yet a decade later, Tower Hamlets had surpassed the national averages for Key Stage 2 national tests at the end of primary school and had closed the gap for GCSE secondary school examination results (Figures 8, 9 and 10).
Figure 8: Aggregate achievement at level 4 for students in Tower Hamlets schools at Key Stage 2 in English, mathematics and science, compared with national trends, 1996–09
Figure 9: Percentage of students achieving five or more A*–C grades at GCSE in Tower Hamlets schools, compared with national figures, 1995–08
Note: GCSE results for 16 year olds. (This data series was ended by the Department for Children, Schools and Families in 2008.)
Aggregate % level 4+ at KS2 in EN, MA & SC
100 120 140 160 180 200 220 240 260 280 300 19
96 1997 1998 1999 2000 2001 2002 2003 2004 2005 2006 2007 2008 2009
A gg re ga te ( 30 0 m ax ) Tower Hamlets England
5+ GCSE grades A*-C with EN & MA
0 10 20 30 40 50 60 70 80 90 100 20
03 2004 2005 2006 2007 2008 2009
Per cen ta ge o f s tu den ts Tower Hamlets England
Aggregate % level 4 + at KS2 in EN, MA and SC
5 + GCSE grades A*-C with EN and MA
Aggr
ega
te (300 ma
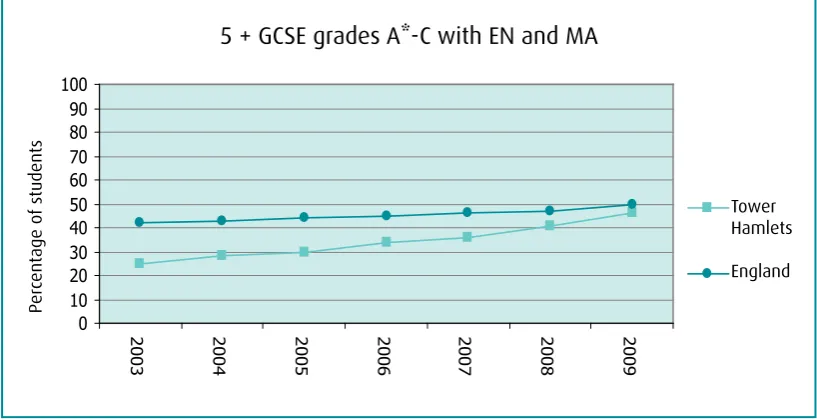
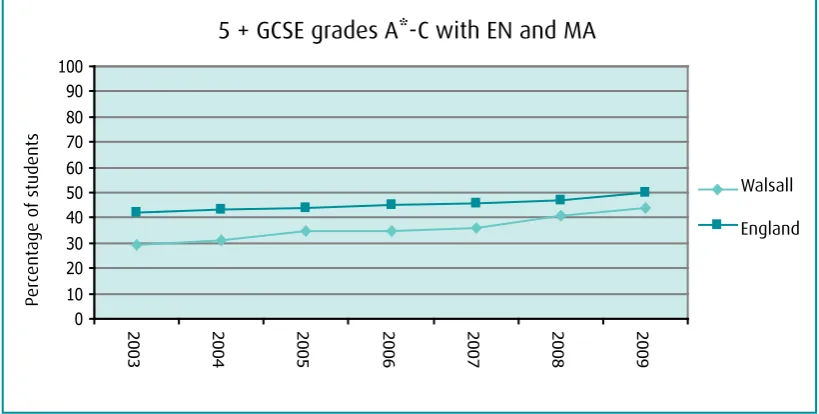
[image:22.595.93.502.497.707.2]Figure 10: Percentage of students achieving five or more A*–C grades at GCSE in English and mathematics in Tower Hamlets schools, compared with national figures, 2003–09
Note: GCSE results for 16 year olds. (The national benchmark of achieving five or more A*–C grades at GCSE including in English and mathematics was first published in 2003.)
3.4.2.3. For almost 100 schools in the most deprived local authority in England to improve test scores and examination results across two whole quartiles of achievement in just a decade is performance well beyond expectations.
3.4.3. Walsall
3.4.3.1. The borough of Walsall lies to the west of Birmingham, England’s second largest city. Walsall’s prosperity grew during the industrial revolution when local deposits of coal, iron ore and limestone stimulated the growth of manufacturing in the town. The intensity of the blast furnaces and foundries in Walsall, and neighbouring Wolverhampton, Dudley and Sandwell, filled the air with soot, smoke and grime to such an extent that the region became known as the Black Country. Although the heavy, polluting industries have since disappeared leaving scars of derelict plots and buildings across the once industrial landscape, the name provides a perpetual reminder of the region’s heritage.
3.4.3.2. There were several changes of administration in Walsall during the 1990s and at one point the council’s decision-making process was paralysed by an absence of overall political control. The council could do little to support school improvement. Many secondary schools opted out and became grant maintained. Schools were largely left to fend for themselves and those with the greatest challenges struggled. The 1999 Ofsted report on the local education authority (LEA) bore testimony to the parlous state of local politics:
The LEA has been able to contribute little to improvement in school performance in recent
years. For much of the 1990s, political instability, evidenced in successive administrations
and culminating at one stage in the virtual paralysis of the decision making process, has
handicapped practical action on education... The LEA has not shown itself adept enough to
develop the new relations with schools which are at the centre of the government’s Code
of Practice on LEA-School relations. Given the opportunity to put the sour legacy of earlier
politics firmly behind it, the LEA has so far failed to translate an ambition to work more
productively with schools into convincing practice
15.
3.4.3.3. In the early days of Ofsted from 1993 to 1999, 11 schools failed their inspections and a further 10 were designated as having serious weaknesses between 1997 and 1999. These represented significant proportions of Walsall’s 120 schools.
5+ GCSE grades A*-C
0 10 20 30 40 50 60 70
19
95 1996 1997 1998 1999 2000 2001 2002 2003 2004 2005 2006 2007 2008
Per
cen
ta
ge o
f s
tu
den
ts
Tower Hamlets England
5 + GCSE grades A*-C
Per
cen
tage o
f s
tuden
ts
Tower Hamlets
3.4.3.4. The 1999 Ofsted inspection of the local education authority led to government intervention.
Inspectors judged 12 of its functions to be inadequate – the lowest rating possible. They were not convinced that Walsall had sufficient capacity to improve by itself. Walsall had failed to adapt to the significant changes in national education policy over the previous decade. The management structure had not provided clear strategic direction or adequate operational control. Relationships between the authority and its schools were poor and morale was very low. Under these conditions, the gap between the local test scores and the national averages was widening.
[image:24.595.93.504.312.529.2]3.4.3.5. The inspection report prompted immediate action. The council replaced all the senior officers within its education services and the government put several functions out to private tender. Serco, a private company that works for government across a range of public sectors, was the preferred bidder, and in 2001 it took responsibility for school improvement and the associated strategic services for five years. About 100 council staff were transferred to Serco. The local authority continued to manage the remaining education services. Ofsted returned in 2002 to find that, overall, insufficient progress had been made since the 1999 inspection and some of the services that had been retained by the local authority had deteriorated. By contrast, good progress had been made in those services managed by Serco.
Figure 11: Aggregate achievement at level 4 for students in Walsall schools at Key Stage 2 in English, mathematics and science, compared with national trends, 1996–09
Figure 12: Percentage of students achieving five or more A*–C grades at GCSE in Walsall schools, compared with national figures, 1995–08
Aggregate % level 4+ at KS2 in EN, MA & SC
100 120 140 160 180 200 220 240 260 280 300 19
96 1997 1998 1999 2000 2001 2002 2003 2004 2005 2006 2007 2008 2009
A gg re ga te ( 30 0 m ax ) Walsall England
5+ GCSE grades A*-C with EN & MA
0 10 20 30 40 50 60 70 80 90 100 20
03 2004 2005 2006 2007 2008 2009
Per cen ta ge o f s tu den ts Walsall England
Aggregate % level 4+ at KS2 in EN, MA and SC
5 + GCSE grades A*-C with EN and MA
Walsall England Walsall England Aggr ega
te (300 ma
[image:24.595.94.504.586.793.2]Figure 13: Percentage of students achieving five or more A*–C grades at GCSE in English and mathematics in Walsall schools, compared with national figures, 2003–09
3.4.3.6. The authority agreed to outsource almost all education services to Serco from 1 January 2003. This resulted in the transfer of a further 300 staff from the local authority. This wider contract ended in 2008, and after an open round of bidding, Serco was once again commissioned to run Walsall’s children’s services for a further 12 years. This renewal of the contract is based on good ratings in annual performance assessments since 2001 and the significant improvements Serco has supported in the quality of educational provision, particularly in primary schools where the gap with national averages has been closed (Figures 11, 12 and 13). The performance of the secondary school sector has also been improving, although at a slower pace.
3.4.3.7. The government’s intervention to transfer functions of the local authority in Walsall to a private company running them for profit was not the first time this had occurred in England. Various levels of
intervention were made in other local authorities at around the same time, varying from complete transfer of all education services in Islington and Bradford to partial transfer in Hackney, Southwark and Waltham Forest. The success of these interventions has been uneven. In Hackney and Southwark, the private companies did no better than the local councils and further interventions were necessary. Walsall therefore constitutes an example of a local authority under the control of a private company, which has performed above
expectations in relation to past performance, other similarly controlled local authorities, and local authorities facing similar challenges of poverty and deprivation. Specifically, performance beyond expectations is evident in:
— the rate of initial improvements achieved by Serco from 2001 to 2002 after a decade of
underperformance
— the decision to transfer almost all remaining education functions to Serco in 2002
— Serco’s support of sustained improvements in student achievement from 2003 to 2008, working in an
effective partnership with schools and Walsall Council
— the outsourcing of all children’s services to Serco, under a 12-year contract, from 2008
3.4.3.8. The most recent official data from Walsall, produced after the completion of our data collection, raises questions about the continuing success of Walsall’s performance and improvement record into the future under Serco. Although Walsall was consistently rated ’good’ (ie, grade 3 out of four grades) by Ofsted from 2002 to 2008, after the period of our data collection (December 2009), its rating was lowered to grade 2. The reasons for this are not yet clear.
5+ GCSE grades A*-C
0 10 20 30 40 50 60 70 80 90 100
19
95 1996 1997 1998 1999 2000 2001 2002 2003 2004 2005 2006 2007 2008
Per
cen
ta
ge o
f s
tu
den
ts
Walsall England
5 + GCSE grades A*-C
Per
cen
tage o
f s
tuden
ts
Walsall
3.4.4. Grange Secondary School
[image:26.595.92.506.214.428.2]3.4.4.1. Grange Secondary School is in the centre of the Lancashire mill town Oldham, at the heart of where some of the worst race riots in British history took place in 2001. From being the town’s flagship comprehensive school when it was established in 1968 to almost failing in 1996, the examination results and inspectors’ judgements at Grange Secondary School then improved significantly over 10 years, and it won an impressive number of national awards and accolades (Figures 14 and 15).
Figure 14: Percentage of students achieving five or more A*–C grades at GCSE at Grange Secondary School, compared with local authority and national figures, 1996–08
Figure 15: Percentage of students achieving five or more A*–C grades at GCSE in English and mathematics in the Grange Secondary School, compared with local authority and national figures, 2004–09
5+ GCSE grades A*-C
0 10 20 30 40 50 60 70 80 1 9 9 6 1 9 9 7 1 9 9 8 1 9 9 9 2 0 0 0 2 0 0 1 2 0 0 2 2 0 0 3 2 0 0 4 2 0 0 5 2 0 0 6 2 0 0 7 2 0 0 8 P er cen ta g e o f s tu d en ts Grange LA England
5+ GCSE grades A*-C with EN & MA
0 10 20 30 40 50 60
2004 2005 2006 2007 2008 2009
Per cen ta ge o f s tu den ts Grange LA England
5 + GCSE grades A*-C
5 + GCSE grades A*-C with EN and MA
[image:26.595.92.502.502.707.2]3.4.4.2. Grange Secondary operates in extremely challenging circumstances. Oldham has two areas of multiple deprivation that fall within the most severe one per cent in the country. Grange is in one of these. More than 90 per cent of the school’s students are Asian, the vast majority Bangladeshi, many from families where little English is spoken and even less is read. Almost two-thirds of the students qualify for free school meals.
3.4.4.3. The school’s low watermark was at the end of 1996 when it scraped a ’satisfactory’ grade in its Ofsted inspection. A new headteacher arrived in 1997 and the current head took on the job of his deputy. When the head moved on in 2004, the deputy replaced him until his own retirement in 2008. This period was a decade of remarkable recovery and significant improvement for Grange Secondary School:
— The proportion of students achieving five or more A*–C grades at GCSE increased from 15 per cent in
1999 to 71 per cent in 2008.
— Between 2000 and 2008, the proportion of leavers not in education, employment or training (NEET) fell
from 12 per cent to 3 per cent, less than half the national average of 7 per cent.
— Over a decade, attendance improved from 84 per cent to 92.5 per cent, close to the national average of
92.7 per cent.
— In 2008 Grange was positioned in the top 2 per cent of schools nationally and first among all 16
secondary schools in the local authority for the contribution the school makes to student progress between the ages of 11 and 16 (its contextual value-added score or CVA).
— Honours and awards include designation as a visual arts specialist school in 2002, becoming the highest
performer of 30 such schools nationally in 2005 (and remaining in the top 2 today), and winning a number of significant visual arts prizes such as being the regional Arts and Minds winner in 2004.
3.4.4.4. Successive inspection reports by Ofsted support this overall trajectory of improvement far beyond expectations. Ofsted’s 2002 report upgraded the school to the second highest category of ’good’, which included ’areas of excellence’ in the school’s work. The report noted there had been ‘very good’ improvement since the 1996 inspection: ‘There has been significant improvement in attendance and good improvement in the quality of the curriculum for Years 10 and 11. Teaching has significantly im