R E S E A R C H
Open Access
Simulation environment and graphical
visualization environment: a COPD use-case
Mercedes Huertas-Migueláñez
1*, Daniel Mora
1, Isaac Cano
2, Dieter Maier
3, David Gomez-Cabrero
4,
Magí Lluch-Ariet
1, Felip Miralles
1Abstract
Background:Today, many different tools are developed to execute and visualize physiological models that represent the human physiology. Most of these tools run models written in very specific programming languages which in turn simplify the communication among models. Nevertheless, not all of these tools are able to run models written in different programming languages. In addition, interoperability between such models remains an unresolved issue.
Results:In this paper we present a simulation environment that allows, first, the execution of models developed in different programming languages and second the communication of parameters to interconnect these models. This simulation environment, developed within the Synergy-COPD project, aims at helping and supporting bio-researchers and medical students understand the internal mechanisms of the human body through the use of physiological models. This tool is composed of a graphical visualization environment, which is a web interface through which the user can interact with the models, and a simulation workflow management system composed of a control module and a data warehouse manager. The control module monitors the correct functioning of the whole system. The data warehouse manager is responsible for managing the stored information and supporting its flow among the different modules.
This simulation environment has been validated with the integration of three models: two deterministic, i.e. based on linear and differential equations, and one probabilistic, i.e., based on probability theory. These models have been selected based on the disease under study in this project, i.e., chronic obstructive pulmonary disease.
Conclusion:It has been proved that the simulation environment presented here allows the user to research and study the internal mechanisms of the human physiology by the use of models via a graphical visualization environment. A new tool for bio-researchers is ready for deployment in various use cases scenarios.
Introduction
In the framework of systems medicine, data comes from different biological or medical levels [1]. The aim of researchers is to understand the causes of different pro-cesses in the human body, with the support of mathe-matical and computational models.
Amodelmay be defined as a simplified representation of the real world. Models describe systems employing para-meter description and parapara-meter interaction [1]. In this work, we have considered two modelling paradigms: a deterministic one, based on linear and ordinary differential
equations, and a probabilistic one, based on probability theory.
This SE has been developed within the Synergy-COPD project under the 7th Framework Program [2-4]. The objectives of the project are to integrate five existing com-puter models and develop asimulation environment(SE) which will allow and facilitate the development, implemen-tation and deployment of systems medicine. Agraphical visualisation environment(GVE) will allow users to access theknowledge base(KB) where all the information about the models is stored, interact with them and carry out simulations in a more intuitive way with respect to the state of the art.
After a revision of the state of the art in the area of simulation tools for physiological models (see Section * Correspondence: [email protected]
1Barcelona Digital Technology Centre, 08018 Barcelona, Spain
Full list of author information is available at the end of the article
state of the art), considering the kind of knowledge [5] and the models included in the project [1,6-8], we devel-oped this SE. The SE is able to run models written in dif-ferent programming languages and communicate parameters among models.
The paper is organized as follows. The state of the art section contains a review of existing tools considering their capability to run physiology models. The architec-ture of the simulation environment section describes the structure and functionalities of the two main modules that compose the SE. The interoperability section describes how the interoperability among modules is reached. The workflow section describes the sequence of actions to be carried out to run a simulation. The validation section describes how this SE was validated by the use of physiological models related to COPD, and the conclusions and future work section adds con-cluding remarks and the direction of future work.
State of the art
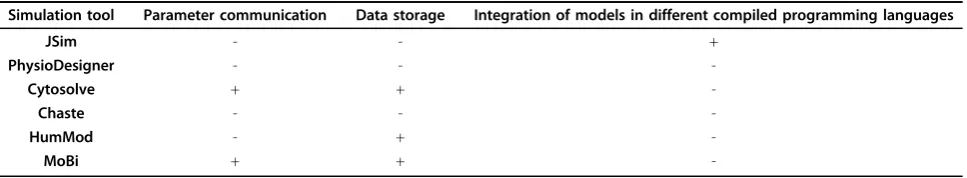
Mathematical models and simulations are widely used in the study of physiological processes. Presently several tools can be found in the literature with this aim. In this section, the most relevant of these are reviewed. Table 1 shows the evaluation of these tools based on three aspects: (1) para-meter communication, (2) model description and model execution result storage and (3) execution of models in different programming languages.
• JSim [9] is a tool developed within the National
Simulation Resource Physiome project to run models
written mainly in mathematical modelling language
(MML), systems biology markup language(SBML)
and CellML markup language. The connection of models written in Java or C++ requires the use of a specific library developed in MML. JSim has its own data base to store models but there is no support of parameter communication between the models. • PhysioDesigner [10] is a platform developed by the University of Osaka. Models are developed in physiolo-gical markup language(PHML).Flintis the simulation tool developed within PhysioDesigner to run models
written in PHML/ISML, CellML and SBML. This simulation environment does not run models in other programming languages than PHML/ISML, CellML and SBML.
•Cytosolve [11] is a system that integrates dynamically the computations of smaller models that can be run in different machines. Models are mainly written in SBML and CellML. The web services parse and detect naming conflicts and common reaction pathways among models. This information is stored in the ontol-ogy of the data base. Once the user has specified the models and the conflicts are solved, the integration of the models can start. Cytosolve connects computa-tional results after model execution using a messaging passing system based on XML across the collaborative models. This tool runs models mainly written in SMBL and CellML.
•The Cancer, Heart and Soft Tissue Environment
(Chaste) [12] supports the simulation of spatial mod-els. It allows the visualization and post-processing of simulation results. Chaste is only supported in Linux/ Unix platforms. Chaste supports models developed in C++. It does not store data and there is no support of parameter communication between the models.
•HumMod [13] is a simulation and modelling tool.
Models description is represented in XML. HumMod is composed of two modules: model documentation, which contains the XML files that correspond to mod-els description, and model navigator, which displays the relationships between variables. The knowledge base contains 5000 variables obtained from peer reviewed physiological papers. HumMod does not support mod-els developed in other programming languages.
•MoBi [14] is a tool to model biological processes and drug actions. MoBi works by using PK-Sim another
package forphysiologically-based pharmacokinetic
[image:2.595.57.541.625.714.2](PBPK) modelling. This tool allows building and simu-lating physiology models, export and import to other modelling languages and visualization of results. MoBi can be integrated into MATLAB and R for sensitivity and complex analysis. Models can only be defined in a specific XML format.
Table 1 Comparision of existing simulation tools.
Simulation tool Parameter communication Data storage Integration of models in different compiled programming languages
JSim - - +
PhysioDesigner - -
-Cytosolve + +
-Chaste - -
-HumMod - +
-MoBi + +
As presented in Table 1 some of the tools reviewed here do not support some of the evaluation aspects stated in the beginning of the section. The contributions of our SE to the SoA are based on its capability to run models pro-grammed in different compiled programming languages allowing the exchange of parameters values between mod-els. This SE is able to request and retrieve information from a complexknowledge base(KB), where all the infor-mation about the models is stored. The SE processes that information to present it to the user via a web-based inter-face which allows him to carry out simulations in a more intuitive way with respect to the state of the art. Our SE has also a data base to register and keep track on user’s activity while logged in.
Architecture of the simulation environment Considering the complexity of the models included in the Synergy-COPD project, the complexity of the knowledge involved and the necessity to communicate parameters among models, thesimulation environmentwas developed to satisfy these requirements.
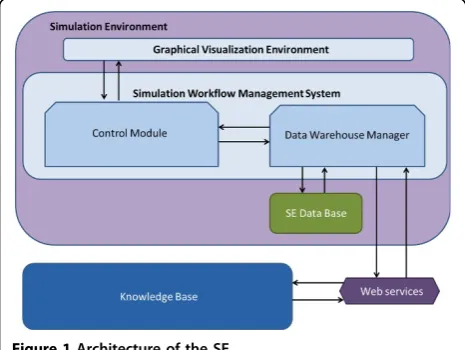
The SE described in this paper is composed of two main modules as presented in Figure 1: thesimulation workflow management system(SWoMS) and thegraphical visuali-zation environment(GVE). The GVE is the visual part of the system, through which the user can interact with the models. The SWoMS is composed of two modules: the data warehouse managerand thecontrol module.
The SE interacts with an external module, the (KB) [15], which stores all the information related to models andcases. Acase in the SE is defined as the necessary information to accurately describe the (real or hypotheti-cal) status of a human being. This information also corre-sponds to a set of variables included in the models.Cases can correspond to patients or can correspond to the result of simulations in which the values of certain vari-ables have been modified. Varivari-ables can be represented
differently in different models and the KB includes the mappings among these different representations, which include the conversion of units. While details of the map-ping are described elsewhere [5], we will briefly summar-ise the KB status to facilitate the understanding of the following sections. The KB represents knowledge as a network and we applied this concept to explicitly state our knowledge about a model, the model purpose, the model parameters visible to the outside (input/output parameters) as well as patient related parameters such as age or blood pressure. We structure knowledge into objects and their relations. These formal concepts enables the use of controlled vocabularies to unambi-gously describe themeaningand purpose of a parameter, creating a semantic description. Based on these it is possible to detectsimilaritybetween the described para-meters and, after manual verification, store the connec-tion explicitly. We can search for patient related data that is relevant as input parameter value of a computa-tional model. We can validate simulation outputs against individual or aggregated clinical data.
The entire system is based in the model-view-control-ler(MVC) architecture for web applications [16] and in the following subsections we will describe the function-alities and structure of the main modules of the SE.
The simulation workflow management system (SWoMS) The SWoMS monitors the correct functioning of the
system and it is composed of two modules: The data
warehouse managerand the control module.
The data warehouse manager is responsible for
executing all the requests to the SE Data-baseor to the KB, ensuring the correct and consistent information flow among modules. This module requests and retrieves information from the KB using a web service. Information retrieved from the KB, or sent to the KB or models, is codified under the communication language specified in the interoperability section.
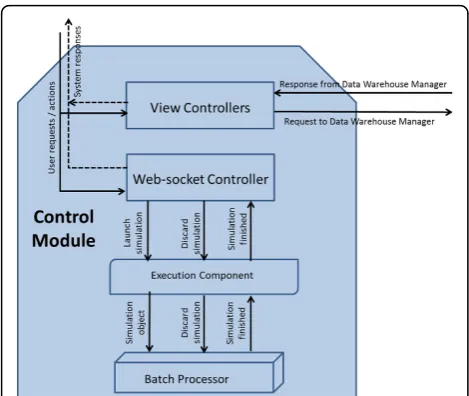
The control module, presented in Figure 2, controls the correct functioning of the whole system. This
mod-ule is composed of controllers. They receive user’s
actions, executed through the GVE, and respond to those actions. Controllers are divided in two groups: view controllers and web-socket controller. The view controllersreceive those user’s actions corresponding to
requests to retrieve information from the data
ware-house manager. This sends the result of those queries to
be presented in the GVE. The web-socket controller
receives user’s actions to start or discard simulations. It also receives notifications from the execution controller to be sent to the GVE via a web-socket [17].
[image:3.595.57.290.547.722.2]Among the information sent to theweb-socket control-lerto start a simulation, we have one or more models to execute and one or more cases, both selected by the
user. With the information received, theexecution compo-nentcreates asimulation object. Thesimulation object contains the logics to allocate the cases with the models to create acase simulation. Acase simulationrepresents the minimum execution unit composed of a reference to the model to execute and the case, which contains the input parameters for the model. For example, in Figure 3 the
user has selected a model calledM6 Oxygen Transport
and a list of cases which includesSea Level 1, Sea Level 2 andSea Level 3. These are sent to thebatch processor which will forward them to theexecution component. The execution componentwill create thesimulation objectwith that model and that list of cases. The result of the execu-tion of theM6 Oxygen Transportmodel with every case in the list of cases is displayed in the GVE.
Every simulation objecthas a complexity associated. This complexity is calculated considering the number of case simulation to execute by a model and the number of models to run. The complexity tends to be higher as the number of models andcase simulationincrease.
The batch processor is composed of two different queues: thefast queuecontainssimulation objectswhose complexity is under a specific limit and theslow queue
contains those simulation objectswhose complexity is
over a specific limit. For instance, the simulation object presented in Figure 3 will be directed to thefast queue.
When the execution of asimulation objecthas finished a finalization event is sent to theweb-socket controller which will send the appropriate notification to the GVE.
The graphical visualization environment (GVE)
The GVE, presented in Figure 4, is the front-end of the SE. Only those who are registered in the system can have access to the SE. The SE supports three different user profiles:
• Administrator is the only profile that has full access to all the possible actions that can be per-formed in the SE.
•Modelleris able to see pre-existing models, simulate them and map models if they have a mapping para-meter. He will be able to upload and publish his own models following the standard described in Synergy-COPD to keep consistency with the different modules that are part of the Synergy-COPD project.
[image:4.595.56.291.87.285.2]•Doctoris able to see pre-existing or public models included in the Synergy-COPD simulation environ-ment, map models, if they have a mapping parameter, and run simulations modifying data in the cases.
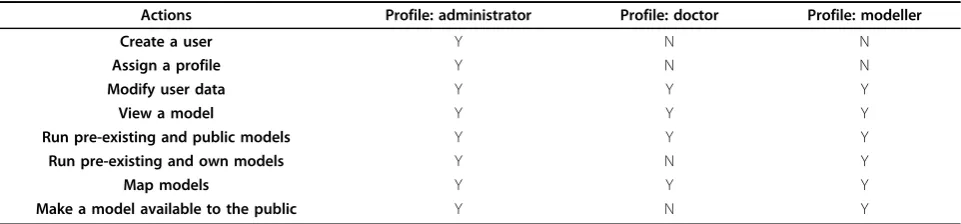
Table 2 presents all the actions that every profile can perform in the SE.
Once the user is logged in, s/he can see the models included in the system (see Figure 5), or search for models in the KB by introducing a keyword that is present in the models’metadata. When the user selects a model to be executed, another model can be added to the execution queue provided that a mapped parameter exists between them.
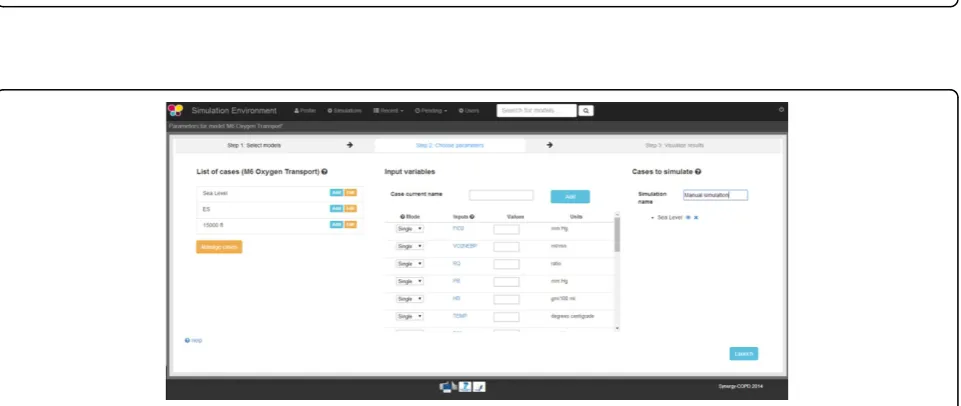
The next step is to select one or more cases to be exe-cuted with that model or create a new one. If a case is edited, the values assigned to the variables of that case are shown. The user can: (1) change variables value or
(2) introduce a range of values, within the permitted
range of values(PRV) or (3) add the case into the queue of cases to be executed. Figure 6 shows that the user
has selectedM6 Oxygen Transportmodel and the cases
labeled Sea Level 1, Sea Level 2and Sea Level 3. Once the user has finished selecting cases to run, the launch
Figure 2Control module structure.
[image:4.595.58.290.524.691.2]button is used to send the information to the correspon-dent module as presented in Figure 3 and trigger the execution of the model.
A visual alert is presented when a simulation has fin-ished. The results after model execution may be presented in tabular format (see Figure 7) or as a graphical plot (see Figure 8). The results may be downloaded in various for-mats including csv, spreadsheet and plain text format. The GVE also supports case storage and case management.
For a live demo please visit the youtube channel of the Synergy-COPD Simulation Environment (https://www. youtube.com/watch?v=dZQO8qRYMac).
Interoperability
Interoperability in the SE is defined as the capability of exchanging parameters between the SE, the KB and the models in a consistent manner. This communication needs to be done in a simplified way to allow model creators to integrate the models descriptions in the KB facilitating the communication of parameter values. To formalize such communication, a communication language denominated SE-TAB was defined.
This communication language has been developed after reviewing existing model description languages and stan-dards for minimum information reporting. Following the
success of simple tab-delimited formats for gene expres-sion [18] and otheromicsdata [19] we generated SE-TAB which allows model creators to generate very simple wrappers for their model parameter input/output values. To add models description and model parameters to the KB we can use the SE-TAB language or other formats. Therefore the absolute minimum SE-TAB support for integration into the SE is the parameter value file which any model needs to be able to read and produce.
As models are uniquely identified within the SE, the communication can be based on model parameter names. Parameters, for which different values occur in different spatio-temporal compartments, are listed only once, the values being reported as array indexed by the corresponding spatio-temporal compartment informa-tion (which is specified in the corresponding model and model parameter description), thus enabling an extre-mely simple format as shown in Table 3.
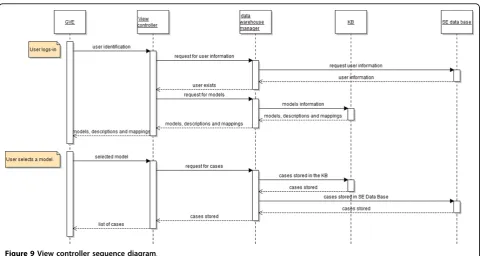
Workflow
[image:5.595.59.541.88.261.2]A typical workflow in the SE is shown in Figure 9. First the user logins and credentials are verified. Next theview controllerpulls from the KB all the models, associated description, the semantic meta-information and the mod-els mapped parameters. This information is processed in
[image:5.595.58.539.618.730.2]Figure 4Home of the simulation environment.
Table 2 actions and permission related to each user profile, where‘Y’stands for Yes and‘N’stands for No.
Actions Profile: administrator Profile: doctor Profile: modeller
Create a user Y N N
Assign a profile Y N N
Modify user data Y Y Y
View a model Y Y Y
Run pre-existing and public models Y Y Y
Run pre-existing and own models Y N Y
Map models Y Y Y
Figure 5Once the user has logged in, s/he can see the models available in the system or look for them introducing a keyword on the top right side of the screen.
Figure 6On the left hand side of the image we can see the list of default cases associated to this model. In the center there is a table with the list of variables included in the model and, on the right hand side, we can see the list of models that would be executed with the model.
[image:6.595.61.538.505.703.2]theview controllerand presented to the user through
the GVE. When the user selects a model, theview
con-troller via thedata warehouse manager pulls all the
associated cases from the KB and the SE Data-base.
This information is eventually presented to the user by GVE.
Once the user has selected one or more cases, as shown in Figure 10, the GVE will send the information, via the web-socketcontroller, arriving at the execution componentto create a simulationobject. This simulation object will be inserted in one of the two queues of the batchprocessor. When the simulation finishes, the user will be notified.
Validation
The SE was validated by utilizing COPD-relevant physio-logical models. The capabilities to execute models in dif-ferent programming languages, to store cases and the communication capabilities with the previously described communication standard were extensively tested.
The models utilized belong to two different paradigms: deterministic and probabilistic. The first of the two deter-ministic mathematical models considered in the Synergy-COPD project have been recently extended from a prior model describing O2 transport from air to mitochondria as an integrated system limiting maximal oxygen uptake
[image:7.595.60.540.89.256.2]VO2MAX [6,20] to also include the contribution to overall
[image:7.595.58.536.326.365.2]Figure 8On the left hand side of this image we can see that the user can choose up to three output variables of the model to be plotted. Our user has selected VO2 and PvO2. On the right hand side, we can see the graphical representation of these two output variables.
Table 3 Example of SE-TAB format.
Parameter name Value (;delimited array) Spatio temporal index vcitSyn 2.31;2.40 l1:t1;l2:t1
cmal_o 0.53;0.65 l1:t1;l2:t1
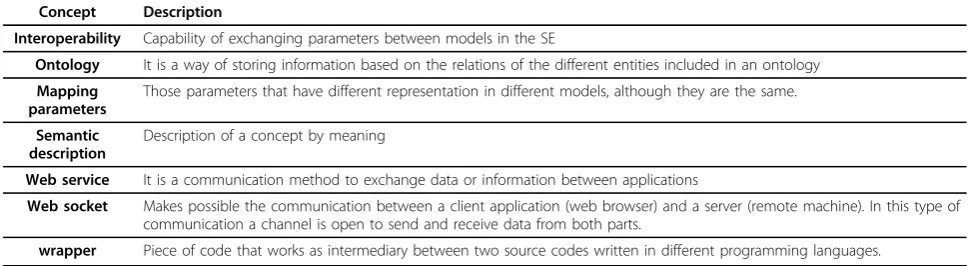
Table 4 Table of definitions.
Concept Description
Interoperability Capability of exchanging parameters between models in the SE
Ontology It is a way of storing information based on the relations of the different entities included in an ontology
Mapping parameters
Those parameters that have different representation in different models, although they are the same.
Semantic description
Description of a concept by meaning
Web service It is a communication method to exchange data or information between applications
Web socket Makes possible the communication between a client application (web browser) and a server (remote machine). In this type of communication a channel is open to send and receive data from both parts.
[image:7.595.55.541.412.545.2]impedance to O2 flow from the above-zero mitochondrial oxygenation levels (Pmo2)required to drive mitochondrial respiration [7]. This has enabled the prediction ofPmo2 as a balance between the capacities for muscle O2 transport and utilization [7]. This model has been recently expanded to allow functional heterogeneity in both lungs and mus-cle. This was done to enable application to disease states. This model, calledM6 Oxygen Transport, is currently pro-grammed using Java programming language.
The second deterministic model considered in Synergy-COPD provides a conceptual basis for the abnormally high reactive oxygen species (ROS) production observed both in hyperoxia [21,22] and hypoxia [23-26] and has the ability to predict the quantitative relationship between ROS generation and Pmo2. Recent modeling and experi-mental studies on mitochondrial ROS production under hypoxia and re-oxygenation [8,27,28] have proposed an inherent bi-stability of Complex III, i.e. coexistence of two different steady states at the same external conditions: one state corresponding to low ROS production, and a second potentially dangerous state with high ROS production.
Temporary deprivation of oxygen could switch the system from low to high ROS production, thus explaining the damaging effects of hypoxia-re-oxygenation. This model, calledM7 Cell bioenergetics, mitochondrial respiration and ROS generation, was developed in the C++ program-ming language.
With the aim to offer the researcher a more COPD and patient specific approach, aBayesian networkwas devel-oped [1] to approach parameter specification. The creation of aBayesian networkrequires a lot of data in order to validate it. Due to the lack of data to validate this network, we have proposed aBayesian networkfor those research-ers who want to apply expert knowledge or new data. The Bayesian networkwas developed in the C++ programming language.
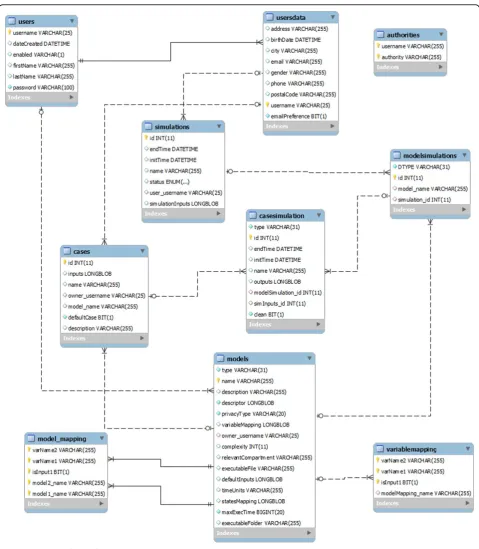
Cases, such as Sea Level and SE, visible on the left hand side of Figure 6, are stored in the KB. New cases can be created using the two as a starting point, and can be stored in the SE Data-basewhose schema is pre-sented in Figure 11.
Conclusions and future work
[image:8.595.58.541.86.342.2]In this work we have presented a web-based simulation environment composed of two main modules: a user interface and a simulation engine responsible for con-trolling the correct functioning and flow of information among the different actors included in the system. These actors are: the user, the KB and the physiology models. The SE was validated with physiology models related to COPD.
Figure 9View controller sequence diagram.
[image:8.595.58.291.648.711.2]In the current status of the SE the integration among static models was achieved although it does not allow running models with different temporal dimensions therefore we plan to extend the SE to support this feature.
[image:9.595.58.538.85.635.2]An objective that was originally planned was the per-sonalization of the results thanks to the use of the prob-abilistic model that could use patient specific data. However, this personalization was not achieved due to the lack of evidences that could allow the connection
among the probabilistic model and the deterministic models in a consistent manner.
A feature added recently to the SE is the possibility to upload new models in the system turning the SE into a collaborative platform. A user with modeler permissions can upload a model and test it. By making it public other modelers registered in the system could use it and build other models if there are existing mappings between models. Making the SE available to the general public will allow users to share results and models.
The specialization of the tool to be employed as an educational tool is also under consideration so that the SE can be utilized by medicine students who have a clear interest in research about the respiratory chain.
A co-operation is planned with related projects that may benefit from this SE. A specific case is the AirPROM FP7 project [29] which is developing VPH models for lungs at cell and organ levels. Those models might be a great extension of those developed in the Synergy-COPD pro-ject and a co-operation between both propro-jects has been initiated. This is an opportunity to allow the SE to con-tinue its evolution in the framework of AirPROM.
The source code for the SE is available under Lesser General Public License in a public repository. [30]
Competing interests
MMHM, DMo, MLA and FM are employed at Barcelona Digital Centre Technologic and will therefore be affected by any effect of this publication. IC, DMa and DGC work in different academic institutions and SMEs and will therefore be affected by any effect of this publication on their publication records. DM is employed at Biomax Informatics AG and will therefore be affected by any effect of this publication on the commercial version of the BioXM™Knowledge Management Environment on which the mentioned COPDKB is based.
Authors’contributions
MMHM conceived and designed the initial SE. MMHM was the lead developer and research engineer of the SE. DMo worked in the generalization phase of the SE. MLA contributed to the design, improvements and refinements in the last stages of the SE. IC and DGC provided expertise in modelling, model integration and physiology. DMa, IC and MMHM co-developed the communication language for parameter exchange. DMa supported the integration of the KB in the SE architecture. FM as coordinator of the Synergy-COPD project and reviewer of the manuscript. All authors read and approved the final manuscript.
Acknowledgements
We would like to thank all the members of the Synergy-COPD consortium for their support. Special thanks to Luigi Ceccaroni who supported the design and development of the SE in the early stages and the team in Barcelona Digital for their support and excellent work along the project. The opnions expressed in this manuscript are those of the authors and are not necessarily those of Synergy-COPD project’s partners or European Commission.
Declaration
The research described in this manuscript is supported by the Synergy-COPD European project (FP7-ICT-270086). The opinions expressed in this manuscript are those of the authors and are not necessarily those of Synergy-COPD project’s partners or European Commission.
This article has been published as part ofJournal of Translational Medicine
Volume 12 Supplement 2, 2014: Systems medicine in chronic diseases: COPD
as a use case. The full contents of the supplement are available online at http://www.translational-medicine.com/supplements/12/S2.
Authors’details
1
Barcelona Digital Technology Centre, 08018 Barcelona, Spain.2Hospital Clinic, IDIBAPS, Universitat de Barcelona, 08036 Barcelona, Spain.3Biomax Informatics, AG, D-82152 Planegg, Germany.4Unit of Computational Medicine, Department of Medicine, Karolinska Institutet, 171 77 Solna, Sweden.
Published: 28 November 2014
References
1. Gomez-Cabrero D, Menche J, Cano I, Abugessaisa I, Roca J, Selivano V, Cascante M, Barabasi B, Tegnér J:Systems medicine: modeling frameworks and their interactions in copd.Manuscript submitted for publication; 2014.
2. Cecaroni L, Miralles F, Velickovski F:Synergy-copd: modelling and simulation for systems medicine.Virtual Physiological Human Network of Excellence2012,7:23-24.
3. The Synergy-COPD Project.[http://www.synergy-copd.eu/]. 4. Gomez-Cabrero D:Synergy-copd: a multidisciplinary approach for
understanding and managing a chronic non-communicable disease.
Manuscript submitted for publication; 2014.
5. Cano I, Tenyj A, Schueller C, Kalus W, Huertas M, Gomez-Cabrero D, Antczak P, Roca J, Cascante M, Falicani F, Maier D:The copd knowledge base: enabling data analysis and computational simulation in translational copd research.Manuscript submitted for publication; 2014. 6. Wagner PD:Algebraic analysis of the determinants of v¡ sub¿ o2, max¡/
sub¿.Respiration physiology1993,93(2):221-237.
7. Cano I, Mickael M, Gomez-Cabrero D, Tegnér J, Roca J, Wagner P:Importance of mitochondrial po2 in maximal o2 transport and utilization: A theoretical analysis.Respir Physiol Neurobiol.2013,189(3):477-483.
8. Selivanov VA, Votyakova TV, Pivtoraiko VN, Zeak J, Sukhomlin T, Trucco M, Roca J, Cascante M:Reactive oxygen species production by forward and reverse electron fluxes in the mitochondrial respiratory chain.PLoS computational biology2011,7(3):1001115.
9. JSim, a Simulation Analysis Platform.[http://www.physiome.org/jsim/]. 10. PhysioDesigner a Modelling Tool for Multilevel Physiological.[http://
physiodesigner.org/phml/index.html].
11. Ayyadurai VS, Dewey CF Jr:Cytosolve: A scalable computational method for dynamic integration of multiple molecular pathway models.Cellular and molecular bioengineering2011,4(1):28-45.
12. Pitt-Francis J, Pathmanathan P, Bernabeu MO, Bordas R, Cooper J, Fletcher AG, Mirams GR, Murray P, Osborne JM, Walter A,et al:Chaste: a test-driven approach to software development for biological modelling. Computer Physics Communications2009,180(12):2452-2471.
13. Hester RL, Brown AJ, Husband L, Iliescu R, Pruett D, Summers R, Coleman TG:Hummod: a modeling environment for the simulation of integrative human physiology.Frontiers in physiology2011,2.
14. Eissing T, Kuepfer L, Becker C, Block M, Coboeken K, Gaub T, Goerlitz L, Jaeger J, Loosen R, Ludewig B,et al:A computational systems biology software platform for multiscale modeling and simulation: integrating whole-body physiology, disease biology, and molecular reaction networks.Frontiers in Physiology2011,2.
15. Maier D, Kalus W, Wolff M, Kalko SG, Roca J, de Mas IM, Turan N, Cascante M, Falciani F, Hernandez M,et al:Knowledge management for systems biology a general and visually driven framework applied to translational medicine.BMC systems biology2011,5(1):38.
16. Leff A, Rayfield JT:Web-application development using the model/view/ controller design pattern.Enterprise Distributed Object Computing Conference 2001 EDOC’01 ProceedingsFifth IEEE InternationalIEEE; 2001, 118-127.
17. Fette I, Melnikov A:The websocket protocol.2011.
18. Rayner T, Rocca-Serra P, Spellman P, Causton H, Farne A, Holloway E, Irizarry R, Liu J, Maier D, Miller M,et al:A simple spreadsheet-based, miame-supportive format for microarray data: Mage-tab.Bmc Bioinformatics2006,7(1):489.
19. Isatools.[http://isatab.sourceforge.net/format.html].
21. Berkelhamer SK, Kim GA, Radder JE, Wedgwood S, Czech L, Steinhorn RH, Schumacker PT:Developmental differences in hyperoxia-induced oxidative stress and cellular responses in the murine lung.Free Radical Biology and Medicine2013.
22. Gore A, Muralidhar M, Espey MG, Degenhardt K, Mantell LL:Hyperoxia sensing: from molecular mechanisms to significance in disease.Journal of immunotoxicology2010,7(4):239-254.
23. Waypa GB, Marks JD, Guzy R, Mungai PT, Schriewer J, Dokic D, Schumacker PT:Hypoxia triggers subcellular compartmental redox signaling in vascular smooth muscle cells.Circulation research2010,
106(3):526-535.
24. Bailey DM, Young IS, McEneny J, Lawrenson L, Kim J, Barden J,
Richardson RS:Regulation of free radical outflow from an isolated muscle bed in exercising humans.American Journal of Physiology-Heart and Circulatory Physiology2004,287(4):1689-1699.
25. Koechlin C, Maltais F, Saey D, Michaud A, Leblanc P, Hayot M, Préfaut C:
Hypoxaemia enhances peripheral muscle oxidative stress in chronic obstructive pulmonary disease.Thorax2005,60(10):834-841.
26. Cherniack NS:Oxygen sensing: applications in humans.Journal of Applied Physiology2004,96(1):352-358.
27. Selivanov VA, Votyakova TV, Zeak JA, Trucco M, Roca J, Cascante M:
Bistability of mitochondrial respiration underlies paradoxical reactive oxygen species generation induced by anoxia.PLoS computational biology2009,5(12):1000619.
28. Selivanov VA, Cascante M, Friedman M, Schumaker MF, Trucco M, Votyakova TV:Multistationary and oscillatory modes of free radicals generation by the mitochondrial respiratory chain revealed by a bifurcation analysis.PLoS computational biology2012,8(9):1002700. 29. AirPROM, Airway Disease Predicting Outcomes Through Patient Specific
Computational Modelling. [http://www.europeanlung.org/en/projects-and-research/projects/airprom/home].
30. SourceForge.[https://sourceforge.net/projects/openhealthpractice/? source=directory].
doi:10.1186/1479-5876-12-S2-S7
Cite this article as:Huertas-Migueláñezet al.:Simulation environment and graphical visualization environment: a COPD use-case.Journal of Translational Medicine201412(Suppl 2):S7.
Submit your next manuscript to BioMed Central and take full advantage of:
• Convenient online submission
• Thorough peer review
• No space constraints or color figure charges
• Immediate publication on acceptance
• Inclusion in PubMed, CAS, Scopus and Google Scholar
• Research which is freely available for redistribution