Abstract:With the blooming of the IoT and mobile technologies, the demand for bandwidth is increasing. As a result spectrum resources are becoming scarce. Emerging Cognitive Radio Networks (CRN) technology provides an efficient solution to address this problem.With appropriate spectrum sensing methods, the secondary users (SUs) can find the available spectrum holes without influencing the PUs. However, the allocation of these resources among the SUs becomes the major problem. This paper proposes the dynamic spectrum allocation method for finding the maximum consecutive spectrum hole to provide the maximum possible transmission rate to each SU. The probability distribution of the available channels is used to detect the maximum consecutive spectrum hole. M/G/K/K queueing model is used to derive the performance metrics of SUs.
Index Terms: Cognitive Radio Networks, Queueing models, Probability distribution, Dynamic Spectrum Allocation
I. INTRODUCTION
According to a survey of the spectrum usage from Federal Communications Commission (FCC) [3] showed that a large number of spectrum resources have different degrees of idleness in time and space dimension because of the fixed allocation policy. Even in some crowded bands, only a small portion of the spectrum is frequently utilized. To solve the problem of spectrum utilization various multiplexing techniques such as FDMA, TDMA, CDMA, MIMO have been followed [4] but it could not solve the spectrum scarcity problem created by static spectrum allocation method. Consequently, this method tends to increase the growing demand of wireless spectrum resource. Therefore, the dynamic spectrum allocation method is adopted to improve the utilization of spectrum resources and to solve spectrum scarcity problem. The main focus of this paper is based on the choice of the spectrum allocation of the largest spectrum holes to meet the large bandwidth needs of SUs.
The background and motivation for the efficient spectrum utilization arose from the concept of Cognitive Radio Networks proposed by Dr. Mitola in 1999 [5].
Revised Manuscript Received on June 05, 2019
Tamilarasan.K, Department of Electronics Engineering, MIT, Anna University, Chennai, Tamilnadu, India.
JeevaaKatiravan, Department of Computer Science and Engineering, Velammal Engineering College, Chennai, Tamilnadu, India.
Rajesh.L, Department of Electronics Engineering, MIT, Anna University, Chennai, Tamilnadu, India.
It offered an optimistic model for addressing the spectrum demand. Haykin redefined CRN [6] as a smart wireless communication system that can automatically sense the surrounding spectrum and use the idle spectrum without causing intrusion to the licensed users.Cognitive networks are the wireless networks in which the users are categorized as primary users (PUs) and secondary users (SUs). PUs are the license holders of the legal spectrum band and have priority to access the spectrum. SUs access the spectrum opportunistically and dynamically such that they do not obstruct or degrade the performance of PUs. The management of radio spectrum resources adopts fixed allocation principle [7] for spectrum allocation among PUs. In this, the spectrum is split into various parts and each part is assigned to different PUs and the band which is allocated to these users are called licensed band. Some frequency band is frequently used and the remaining parts are found unused. So, by considering “dynamic allocation” instead of static allocation, the utilization of the spectrum can be improved.
Generally, PUs are referred as licensed users and SUs are referred as unlicensed users. By definition of CR, SU should not only have the ability to sense and use the idle spectrum but also should be able to exit the spectrum when PU accesses again.
Spectrum sharing [8] includes four steps:
1) Spectrum sensing: The first step in spectrum sharing where the PUs seamlessly senses the spectrum to detect the idle spectrum. The accuracy of spectrum sensing affects the overall network performance- missed detections result in undesired PU interference, while false alarms results in actual spectrum opportunities being unutilized, affecting secondary user’s throughput. 2) Spectrum allocation: This is based on the distribution of
spectrum holes and assigns spectrum to SUs. SUs are required to exploit the spectrum through competition since the quantity of spectrum holes is not fixed. The spectrum is allocated dynamically, upgrading the spectrum utilization.
3) Spectrum access: PU has the priority to access the spectrum while SU can access when the spectrum is not utilized by PU. Therefore, an efficient access algorithm to coordinate multiple SUs access spectrum holes avoiding conflicts between PUs and SUs.
Efficient Spectrum Utilization using Dynamic
Spectrum Allocation in Multiuser Cognitive
Radio Network
4) Spectrum handoff: SUs has to exit the spectrum and switch over to another spectrum when PU wants to access the spectrumagain.
This paper focuses on the allocation of spectrum resource dynamically among the SUs. The whole CR network is modelled using the M/G/K/K queueing model which helps for better analysis of secondary users’ performance metrics. The rest of the paper is organized as follows: Section II discusses about the existing literature for queuing model in cognitive radio networks. Section III defines the proposed system model for finding the consecutive idle spectrum hole which is followed by the simulation results in section IV and Conclusion and Future work in Section V.
II. QUEUEING MODELS IN CRN
The work done by Erlang in traffic engineering for telephone systems led to the development of queueing theory [9]. Since then queueing theory is found in various diverse fields. It is the fundamental theory which is used for the analysis of resource sharing system. Queueing model is one in which customer demands resources at random times and use the resources for variable time duration. The queueing model is one in which customers arrives in a random order. When all the resources are in use, the arriving customers wait for their turn to get served and once their service is finished.
Activities of PUs limits the SUs access and usage of spectrum. Instant access to the network is not guaranteed to SUs. This situation of delayed network access and varying network conditions is realized using queueing model. The performance metrics derived from the queueing models are used to derive the delay and throughput of secondary networks. Therefore, the evaluation of CRN can be done with the help of queueing models.Queueing models are defined in terms of inter-arrival times and service time of the customers, the total number of servers used and the overall queue capacity. Kendall’s notation is used to describe these queueing parameters [10]. SUs can access the channels when the channel is idle. The idleness of the channel is found using ON/OFF model which describes whether the channel is idle or occupied by PUs. An expression for the average delay experienced by the SUs in the CRN is derived with the help of M/G/1 queueing model [12]. Similar ON/OFFmodel is used in [13] and SUs dynamically access the spectrum when it is vacant. Each channel is assumed to have same bandwidth. From the SUs point of view, each channel has same transmission rate. An optimized channel allocation method is designed to minimize the overall transmission delay of SUs.
In [14], a novel method for accommodating both PUs and SUs is designed using M/M/C/C where the arrivals and service times are different. The users compete for C number of channels. The harmonious spectrumsharing is achieved with the help of this model. For delay sensitive heterogeneous SUs, Shiang and van der Schaar proposed a virtual prioritized M/G/1 queue [15]. Dynamic strategy learning algorithm was designed for channel selection which aims to optimize the end to end delay in the network and throughput of SUs. The PUs are the high priority users and the SUs are assigned with different priority based on SUs delay sensitivity and multimedia applications.
In [16], the spectrum hole with maximum idle time is found using ON/OFF patterns of PUs. Perfect knowledge of different types of traffic patterns in PU network is necessary to predict the maximum idle time of the channel. The spectrum allocation based on maximum idle time ensured minimum spectrum handoff of 55% which in turn ensured reduced delay and increased throughput. SUs are allocated the spectrum resource [17] which has minimumexpected transmission time and less spectrum mobility.
In this paper, a novel method of spectrum allocation to SUs is proposed to find the largest spectrum hole to minimize the transmission delay.
III. PROPOSED SYSTEM MODEL
In this paper, it is assumed that the SUs need to send large amount of data and always require the large bandwidth. Highest transmission rate can be achieved if the largest spectrum hole among the available spectrum hole is chosen. The mathematical model is described to find the largest spectrum hole based on conditional probability. The random variable 𝑚𝑎𝑥 denotes the maximum successive unutilized spectrum hole which varies from 0 to k where k is the total number of available channels. If d is the transmission rate of each channel, then the average throughput of SUs is given by
𝑅𝑚𝑎𝑥 ,𝑑 = 𝑑 × 𝐸[𝑚𝑎𝑥 ] (1)
where 𝐸[𝑚𝑎𝑥 ]is the average number of maximum successive unutilized channels.
𝐸[𝑚𝑎𝑥 ] = 𝑘 𝑖
𝑖=0 × 𝑃(𝑚𝑎𝑥 = 𝑖) (2)
where P(max) is the probability of maximum successive unutilized channels which forms the largest spectrum hole.
A. Mathematical Model
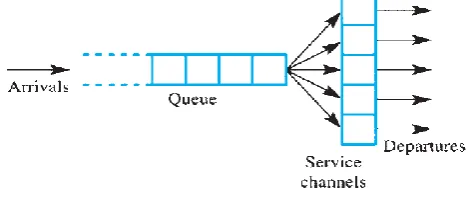
The system is designed using M/G/K/K queueing model. The arrival rate of customers is defined by Poisson process and the service time follows general distribution. There are K number of servers. The system as shown in figure 1 accommodates K customers at any time and the K+1th customer entering will be governed by admission control policy of the system.
Fig. 1 M/G/K/K Queue model
Under the assumption that there is only one SU in the network and at any point in time, a PU may take only one channel based on their need. As a result, the problem of finding P(max = i) for i=0,1,2,………..k where k is the total number of channels is given as
𝑃 𝑚𝑎𝑥 = 𝑖 = 𝑘 𝑃 𝑚𝑎𝑥 = 𝑖 𝑈 =
𝑏=0
[image:2.595.316.552.562.662.2]Where Pb is the probability of the number of channels utilized by the PUs. 𝑃 𝑚𝑎𝑥 = 𝑖 𝑈 = 𝑏)is the probability of having the maximum of i successive unutilized channels under the condition of b utilizedchannels.
The problem of finding the P(max=x) is given by
𝑃 𝑚𝑎𝑥 = 𝑖 = 𝑃 𝑚𝑎𝑥 = 𝑖 𝑇 = 𝑘, 𝑈 = 𝑏) = 𝑃 𝑖 𝑘, 𝑏) (4)
the conditional probability of having maximum i successive unutilized channels under the condition of T = k total channels and U = b utilized channels. The condition probability in Eq. (4) is defined as
𝑃 𝑖 𝑘, 𝑏 = 𝑃1 𝑖 𝑘, 𝑏 + 𝑃2 𝑖 𝑘, 𝑏 (5)
𝑃1 𝑖 𝑘, 𝑏 is the conditional probability of having the
last i channels as unutilized under the condition of total k channels and b utilized channels with maximum of i successive unutilizedchannels.
𝑃2 𝑖 𝑘, 𝑏 is the conditional probability of having the
last ichannels as utilized under the condition of total k channels and butilized channels with maximum i successive unutilizedchannels.
For small values of k = 0,1, Eq. (5) can be found manually. But for large values of k, the solution is found in a recursive fashion i.e., for finding the solution of 𝑃 𝑖 𝑘 +
1, 𝑏), the pre-calculated values of
𝑃 𝑖 𝑘, 𝑏 , 𝑃1 𝑖 𝑘, 𝑏 𝑎𝑛𝑑𝑃2 𝑖 𝑘, 𝑏 are used. To find the values of 𝑃(𝑖|𝑘 + 1, 𝑏), three parameters are introduced.
𝑃𝑙𝑐_𝑢𝑛𝑢𝑛𝑡𝑖𝑙𝑖𝑠𝑒𝑑𝑘+1,𝑏 - The probability of having a last channel idle with k+1 total channel and b busy channel.
𝑃𝑙𝑐_𝑢𝑛𝑢𝑛𝑡𝑖𝑙𝑖𝑠𝑒𝑑𝑘+1,𝑏 = 𝑘𝑏 𝑘+1
𝑏
(6)
𝑃𝑙𝑐_𝑢𝑡𝑖𝑙𝑖𝑠𝑒𝑑𝑘+1,𝑏 - The probability of having a last channel busy with k+1 total channels and b busy channels.
𝑃𝑙𝑐_𝑢𝑡𝑖𝑙𝑖𝑠𝑒𝑑𝑘+1,𝑏 =
𝑘 𝑏−1 𝑘+1 𝑏
(7)
𝑃𝑖𝑐_𝑢𝑛𝑢𝑡𝑖𝑙𝑖𝑠𝑒𝑑𝑘+1,𝑏 - The probability of having the last
isuccessive unutilized channels and a utilized channel preceding it with k+1 total channels and butilized channels.
𝑃𝑖𝑐_𝑢𝑛𝑢𝑡𝑖𝑙𝑖𝑠𝑒𝑑𝑘+1,𝑏 =
𝑘−𝑖 𝑏 −1 𝑘+1 𝑏
(8)
𝑃 𝑖 𝑘 + 1, 𝑏) = 𝑃𝑙𝑐 _𝑢𝑡𝑖𝑙𝑖𝑠𝑒𝑑𝑘+1,𝑏 × 𝑃 𝑖 𝑘, 𝑏 + 𝑃𝑙𝑐_𝑢𝑛𝑢𝑡𝑖𝑙𝑖𝑠𝑒𝑑𝑘+1,𝑏 × [𝑃
1 𝑖 − 1 𝑘, 𝑏 + 𝑃2 𝑖 𝑘, 𝑏 ] (9)
It is noted that the extra added one channel to the total k channels may be utilized or unutilized. Therefore, the calculation of Eq. (9) consists of two parts. First term is the probability that the extra added last channel being utilizedand having the total of i successive unutilized channels in the remaining k channels of which (b-1) channels are utilized. Second term is the probability that the last added channel is unutilized and having the maximum of i or (i-1) successive unutilized channels in the total k channels and butilized channels. Second term in Eq. (9) denotes that if the last added channel is utilized, then i successive channels may be available in the last or elsewhere in the middle of the spectrum. The former happens if the last (i-1) channels in the first k channels are
utilized denoted by the probability𝑃1(𝑖 − 1|𝑘, 𝑏). The later occurs by having i successive unutilized channels in the first n channels, the last i being utilized which is denoted by the probability𝑃2(𝑖|𝑘, 𝑏). It is obvious that the last i channels cannot be all utilized in total k channels. Otherwise there will be maximum of i+1 successive unutilized channels.
𝑃1 𝑖 𝑘 + 1, 𝑏 = 𝑃𝑖𝑐𝑢𝑛𝑢𝑡𝑖𝑙𝑖𝑠𝑒𝑑
𝑘+1,𝑏 × 𝑖 𝑃 𝑧 𝑘 − 𝑖, 𝑏 − 1)
𝑧=0 (10)
Eq.(10) denotes the probability that the last channel being utilized preceded by isuccessive unutilized channels and having 0 to isuccessive unutilized channels in theremaining (k-i) channels and (b-1)utilized channels.𝑃1 𝑖 𝑘 + 1, 𝑏 ,𝑃(𝑖|𝑘 + 1, 𝑏), 𝑃2 𝑖 𝑘 + 1, 𝑏 can be calculated using Eq. (10), Eq.(9) & Eq. (5) respectively. 𝑃 𝑚𝑎𝑥 = 𝑖 is obtained from the steady state probability using the M/G/K/K queueing model.
The arrival rate and service rate are denoted as λ and μ respectively. The utilization ratio is given as ρ = λ / μ. The steady state probability of having n customers in the system which can accommodate the maximum of K customers is given as
𝑃𝑛 =𝑛!1𝜌𝑛 𝜌
𝑥
𝑥! 𝐾 𝑥=0
−1
(11)
Let X be a random variable denoting the service time of the customers described by exponential distribution. The average number of customers that the system can accommodate at any time is given by
𝐿 = 𝜆 × 𝐸[𝑋] (12)
where E[X] is the mean service time for a customer
𝐸 𝑋 = 1/𝜇(13)
In order to have optimal resource allocation, case of multiple SUs competing for resources need to beconsidered. Under the following assumptions,
Y Secondary users in the network utilising an average X number of channels.
M Primary users arriving in the network with each utilising only one channel at a time
Algorithm for finding the maximum successive unutilized spectrum
1. Initial value for X is assumed such that it does not
exceed 𝐸[𝑚𝑎𝑥 ] for K channels. 2. Calculate K' = K - [(Y − 1)×X] - M.
3. Using the proposed model, 𝐸[𝑚𝑎𝑥 ] for K' channels is found.
4. Steps 2 and 3 are repeated until 𝐸[𝑚𝑎𝑥 ] converges
5. Any newly joined Yth secondary users could have an
average number of channels equal to 𝐸[𝑚𝑎𝑥 ] obtained in Step 4.
From Yth SU point of view, [(Y − 1) × X - M] number of channels are already occupied by other SUs and PUs. If the system has K number of channels, then the total number of available unutilized channels is given as (K - [(Y - 1)×X] - M) From the available unutilized channels, the maximum successive unutilized channel
hole) is found using the above algorithm.
IV. SIMULATION RESULTS
[image:4.595.328.535.57.232.2]The arrival process follows Poisson distribution and the service time is exponentially distributed. The system is simulated for various values of arrival rate (λ) and service rate (µ).
TABLE I. SIMULATION PARAMETERS
PARAMETERS VALUES
Number of primary users 10
Number of secondary users 50
Number of channels, K
(servers) 50
Arrival rate, λ (customers/sec) 50
Service rate, μ
(customers/sec) 2.5,15
Queue length 50
Assumed model M/G/K/K
Arrival Process Poisson distribution
Service process Exponential distribution
The number of servers in the system is assumed as K = 50. Simulation parameters are given in Table1.
Fig. 2 The probability distribution for having the maximum of x successive unutilized channels with total
50 channels
[image:4.595.323.536.320.489.2]The probability distribution for having the maximum isuccessive unutilized channels with the total of 50 channels for different values of λ and µ is shown in figure 2.From the graph, it can be inferred that as the server utilization rate (ρ = λ/ µ) decreases, the chance of getting the maximum spectrum hole increases. The decrease in server utilization implies that the channels are not occupied by the PUs and the arrived SUs has the maximum probability of getting the largest spectrum hole. The probability of getting maximum 12 spectrum holes, P(max = 12) is 0.42 when λ = 42 customers/sec and µ = 3.8 customers/sec which is the maximum value among the remaining combinations of λ and µ.
Fig. 3. Expected Maximum available successive unutilized channel for each Secondary User
The expected maximum number of successive unutilized channels for each SU is shown in Figure 3. If there are 7 SUs in the network, then each of them obtain an average of 3 successive unutilized channels.
Fig. 4 Expected throughput for each SU in the network
It is assumed that if an arrived SU needs to send a 64KB TCP packet over the obtained channel in about 30ms, the maximum possible achieved throughput is about 17Mbps when transferring between two servers.
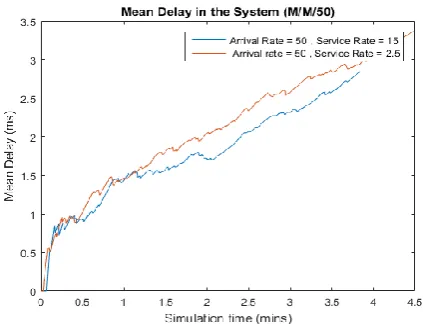
[image:4.595.62.278.334.513.2]Fig. 5 Simulation time vs Mean Delay in the system It is seen that as the number of customers in the system increases, the expected throughput decreases as the chance of getting the maximum successive unutilized channel is very less. Figure 5 shows the average waiting time for the secondary customers in the system. Initially the customers are served faster. As the simulation time increases, the number of users in the system and the average waiting time of the arrived SUs for getting the maximum consecutive spectrum hole. When service rate is increased from 2.5 to 15 customers/sec, the mean waiting time for the arrived SU decreases.
Fig. 6 Simulation time vs Mean Number of Secondary Customers in the system
Figure 6 shows the relationship between the average number of customers in the system over a specified time interval. For the given arrival rate λ = 50 customers/sec and the service rate of µ = 2.5 customers/sec, the mean number of customers in the system is around 50. Since the mean service time is greater than the mean inter-arrival time between the SUs, the time for simulating each SU is comparatively larger resulting in the accumulation of customers in the queue. The number of SUs in the system increases over the simulation time because the time for serving them is greater than their inter arrival times.
Figure 7 shows the average server utilization rate over the simulation time interval. It is observed that almost 98 % of all channels are occupied by primary and secondary users all the time
Fig. 7 Average server Utilization rate over the Simulation time
V. CONCLUSION AND FUTURE WORK
The demand for the spectrum is addressed efficiently with the help of Cognitive Radio Networks technology. Spectrum sharing in CRN is the most crucial step to ensure that the available spectrum is appropriately allocated for the SUs. The unused licensed channels are allocated among the SUs using the proposed dynamic spectrum allocation method. The SUs are given the largest consecutive spectrum hole in order to satisfy their high transmission demand. Queueing model is modelled for realizing the CRN network. The average channel utilization by the SUs, the number of secondary customers and their average waiting time in the system are evaluated using the proposed model. This method ensures that the available spectrum is utilized efficiently in the multiuser environment. Further research in multiuser environment can be carried further for scenarios where each PU occupies multiple channels.
REFERENCES
1. Gupta and E. R. K. Jha, “A survey of 5G network: Architecture and emerging technologies,” IEEE Access, vol. 3, pp. 1206_1232, Jul. 2015.
2. Whitmore, A. Agarwal, and L. D. Xu, “The Internet of Things_ A survey of topics and trends,” Inf. Syst. Frontiers, vol. 17, no. 2, pp. 261_274, Apr. 2015.
3. Spectrum Policy Task Force Report, document ET Docket 02-155, FCC, Apr. 2002.
4. Wang and K. J. R. Liu, “Advances in cognitive radio networks: A survey,” IEEE J. Sel. Topics Signal Process., vol. 5, no. 1, pp. 5_23, Feb. 2011.
5. J. Mitola and G. Q. Maguire, Jr., “Cognitive radio: Making software radios more personal,” IEEE Pers. Commun., vol. 6, no. 4, pp. 13_18, Apr. 1999.
6. S. Haykin, “Cognitive radio: Brain-empowered wireless communications,” IEEE J. Sel. Areas Commun., vol. 23, no. 2, pp. 201_220, Feb. 2005.
7. Z. Zhou, D. Guo, and M. L. Honig, “Licensed and unlicensed spectrum allocation in heterogeneous networks,” IEEE Trans. Commun., vol. 65, no. 4, pp. 1815_1827, Apr. 2017.
8. Alexander M. Wyglinski, Ph.D., MaziarNekovee, Ph.D., Y. Thomas Hou, Ph.D., “Cognitive Radio Communications and Networks, Principles and Practice,” Elseveir, 2010.
9. Alberto Leon-Garcia &IndraWidjaja, “Communication Networks – Fundamental Concepts and Key Architecture,” McGraw-Hill Higher Education, March 2000.
10. William J. Stewart, “Probability, Markov Chains, Queues and Simulation – the mathematical
[image:5.595.66.277.361.520.2]11. IlarioFilippini, Matteo Cesana, IlariaMalanchini, “Competitive Spectrum Sharing in Cognitive Radio Networks: a queuing theory based analysis,” Proc. Of the 1st BlackSeaCom, pp.238-244, 2013. 12. Xin-Lin Huang, Gang Wang, Fei Hu, Sunil Kumar, Jun Wu,
“Multimedia Over Cognitive Radio Network: Towards A Cross-layer Scheduling Under Bayesian Traffic Learning,” Computer Communications, vol.51(2014), pp.48-59, 2014.
13. F. Borgonovo, M. Cesana, L. Fratta, “Throughput and Delay Bounds for Cognitive Transmissions,” Springer US, vol. 265, pp. 179-190, 2008.
14. P. Smith, A. Firag, P. Dmoschowski, M. Shafi, “Analysis of the M/M/N/N Queue with Two Types of Arrival Process: Applications to Future Mobile Radio Systems,” Journal of Applied Mathematics, vol.2012, pp. 1-14, 2012.
15. H. P. Shiang and M. van der Schaar, “Queueing-based dynamic channel selection for heterogeneous multimedia applications over cognitive radio networks,” IEEE Trans. Multimedia, vol. 10, no. 5, pp. 896_909, Aug. 2008.
16. M. Hoyhtya, S. Pollin, and A. Mammela, “Performance improvemt with predictive channel selection for cognitive radios,” in Proc. 1st Int. Workshop Cogn. Radio Adv. Spectr. Manage. (CogART), Feb. 2008, pp. 1-5.
17. Y.-S. Chen, C.-H. Cho, I. You, and H.-C. Chao, “A cross-layer protocol of spectrum mobility and handover in cognitive LTE networks,” Simul. Model. Pract. Theory, vol. 19, no. 8, pp. 1723-1744, 2011.
AUTHORSPROFILE
Tamilarasan. K, Teaching Fellow, Department of
Electronics Engineering, Madras Institute of Technology, Anna University. He holds a Bachelor’s degree in Electronics and Communication Engineering and Master’s degree in Communication and Network Engineering. His area of interest are cognitive radio communication and Game theory
JeevaaKatiravan, Professor, Department of Computer Science Engineering, Velammal Engineering College. He holds a Doctorate degree. He has over 20 international journal publications to his credit. His area of interest are Network Security and Sensor Network.