Submitted23 May 2014 Accepted 29 September 2014 Published21 October 2014
Corresponding author
Ther´esa M. Jones, [email protected]
Academic editor
Gavin Stewart
Additional Information and Declarations can be found on page 13
DOI10.7717/peerj.627
Copyright
2014 Jones et al.
Distributed under
Creative Commons CC-BY 4.0
OPEN ACCESS
Gender di
ff
erences in conference
presentations: a consequence of
self-selection?
Ther´esa M. Jones1, Kerry V. Fanson2, Rob Lanfear3,
Matthew R.E. Symonds2and Megan Higgie4 1Department of Zoology, University of Melbourne, Australia
2Centre for Integrative Ecology, School of Life and Environmental Sciences,
Deakin University, Australia
3Research School of Biology, Australian National University, Australia
4Centre for Tropical Biodiversity and Climate Change, College of Marine and Environmental
Sciences, James Cook University, Australia
ABSTRACT
Women continue to be under-represented in the sciences, with their representation declining at each progressive academic level. These differences persist despite
long-running policies to ameliorate gender inequity. We compared gender differences
in exposure and visibility at an evolutionary biology conference for attendees at two different academic levels: student and post-PhD academic. Despite there being
almost exactly a 1:1 ratio of women and men attending the conference, we found that when considering only those who presented talks, women spoke for far less time than men of an equivalent academic level: on average student women presented for 23% less time than student men, and academic women presented for 17% less time than academic men. We conducted more detailed analyses to tease apart whether this gender difference was caused by decisions made by the attendees or through bias in
evaluation of the abstracts. At both academic levels, women and men were equally likely to request a presentation. However, women were more likely than men to prefer a short talk, regardless of academic level. We discuss potential underlying reasons for this gender bias, and provide recommendations to avoid similar gender biases at future conferences.
Subjects Evolutionary Studies, Science and Medical Education, Science Policy
Keywords Gender and science, Women in science, Matilda effect, Conference presentations, Scientific visibility, Evolutionary biology, Leaky pipeline, Gender difference, Academic levels, Talk preference
INTRODUCTION
Gender discrepancies are present in many academic disciplines including science, engineering, the arts, humanities, and even gender studies, despite efforts to counter them
(Hill, Corbett & St Rose, 2010;Kretschmer et al., 2012). To some extent, these differences are
Knobloch-Westerwick, Glynn & Huge, 2013), even when relative opportunity is accounted for. In a recent experimental study involving students, men were evaluated as being more competent and worthy of a higher starting salary than women (Moss-Racusin et al., 2012). This suggests that perception biases may contribute to gender disparity from even the earliest stages of a career. However, gender discrepancies are also influenced by innate gender differences in behaviour. For example, women tend to publish less (Symonds et al.,
2006;Conley & Stadmark, 2012;Larivi`ere et al., 2013), use more tentative language (Leaper & Robnett, 2011), and ask for less when negotiating their salary (Tinsley et al., 2009).
Two metaphors are widely used to describe the current situation: (1) the ‘Matilda effect’,
named after the American feminist critic Matilda Gage, who first described it, refers to the systematic under-recognition and denial of the contributions made by women in science, technology, engineering and mathematics (Rossiter, 1993;Knobloch-Westerwick, Glynn & Huge, 2013); and (2) the ‘leaky pipeline’, which describes the dramatic reduction in the proportion of women compared to men surviving each step up the academic (or equivalent) ladder (Pell, 1996;Winkler, Tucker & Smith, 1996). The underlying reasons for the presence of the Matilda effect and the leaky pipeline are diverse, complex and largely
unresolved.
Identification and evaluation of gender discrepancies are often based on easily obtain-able metrics, such as the number of publications, citations, or grants received. However, important dimensions of gender inequality may be overlooked by these assessments (West et al., 2012). One important metric, which may either directly or indirectly influence the perceived quality of a researcher, is their ‘visibility’ within their discipline or respective community (Damschen et al., 2005;Thelwall, Barjak & Kretschmer, 2006;Faulkner, 2009;
Schroeder et al., 2013). In addition to publications and grant success, visibility may be achieved through conference attendance, presentations, plenary talks, and engagement with the media.
Recent studies present convincing evidence for consistent gender bias (favouring men) in terms of conference visibility. Using 21 years of annual meeting data for the American Association of Physical Anthropologists, Isbell and colleagues (2012) showed that men continue to dominate conference visibility, despite the fact that women comprise the majority of their membership. Men were more likely than women to request a talk in preference to a poster, and men requesting a talk were more likely than women to be allocated one (rather than a poster). Similarly, at the 2011 European Society for Evolutionary Biology congress (Schroeder et al., 2013), women were significantly under-represented among invited speakers, in part because they were more likely than men to turn down invitations to present. Studies have also shown that representation of women in symposia is positively related to the number of women on the organising committee (Isbell, Young & Harcourt, 2012;Casadevall & Handelsman, 2014).
These studies demonstrate that women currently have reduced exposure and visibility at conferences compared to men. Furthermore, they highlight the complex interplay between peer evaluation (Matilda effect) and a degree of active choice by women (either
an invitation to speak) that perpetuate these gender discrepancies. We note that the reasons for declining invitations to present are, in themselves, likely to be complex and diverse, and have been covered in detail bySchroeder et al. (2013). None of the above studies discriminated between academics (post-doctoral researchers and beyond) and students (Honours, Masters and PhD students). This distinction is important because gender-specific behaviour in conference participation may differ depending on academic
level, and knowledge of such variation might be important in addressing gender bias. Here, we use data from the 2013 Australasian Evolution Society (AES) conference, to assess gender bias in conference visibility at two different academic levels: student
(Honours, Masters and PhD students) and academic (post-PhD). We first consider overall gender differences in conference visibility (i.e., the length of time men and women from
the two academic levels spent presenting their research), and then use more detailed analyses to identify the source of any gender differences. The conference was unusual in
two respects. First, it only offered oral presentations (short or long) and thus each presenter
knew the amount of exposure they could expecta priori. Second, the sex-ratio of attendees was almost equal. Consequently, we should anticipate that on average women and men would receive roughly equal exposure. However, we found this was not the case. We narrow down the source of this gender difference, discuss the possible reasons causing it, and offer
advice to future conference organisers as to how to encourage gender equality in visibility and exposure at their conferences. We hope that our study provides a useful template with which conference organisers and attendees can assess gender bias at future conferences. All authors attended this conference and two (MRES and KVF) were on the abstract selection committee.
METHODS
Data collection
Four plenary speakers (two women, two men) accepted the committee’s invitation to speak at the 2013 Australasian Evolution Society (AES) conference. All other speakers were accepted through an open process of abstract submission. At the time abstracts were submitted, delegates who wished to present (N=108/139;Table 1) were asked to (1)
nominate whether they preferred to give a long talk (12 mins) or a short ‘speed’ talk (5 mins), and (2) specify whether they were a student (i.e., had not had their PhD conferred) for the purposes of student awards. A selection committee comprising three men and three women evaluated all requests and allocated them according to the provided abstract, with all delegates who requested a talk receiving one. However, conference time constraints resulted in a small number of delegates who requested a long talk being allocated a short talk (Table 1). The committee’s evaluations were not carried out blind to author(s) or career stage (student or academic). The gender of all delegates was identifiedpost hoc(but prior to our analyses). No participant was identified in our study. Ethical approval was not required for the study as both the abstracts of all speakers (http://austevol.files.wordpress.
com/2013/09/aes-2013-program.pdf) and the data relating to talk allocation (http://
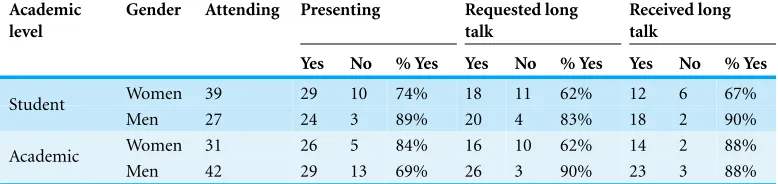
Table 1 Table of statistics for attendees to the AES conference.Participation in talk presentations at the AES conference for the groups represented by student and academic women and men. The four invited plenary speakers (two women; two men) are not included.
Academic level
Gender Attending Presenting Requested long talk
Received long talk
Yes No % Yes Yes No % Yes Yes No % Yes
Women 39 29 10 74% 18 11 62% 12 6 67%
Student
Men 27 24 3 89% 20 4 83% 18 2 90%
Women 31 26 5 84% 16 10 62% 14 2 88%
Academic
Men 42 29 13 69% 26 3 90% 23 3 88%
Analytical approach
The conference delegates were categorised in four groups: student women, student men, academic women, and academic men. ‘Students’ were defined as Honours, Masters or PhD students, while ‘academics’ were defined as postdoctoral research associates, research fellows, and all other academics. For each of the statistical analyses (described below) differences among the four groups were assessed for each metric. Planned contrasts to
directly compare student women and men, and academic women and men, were carried out for each metric as women and men at the same academic level should be comparable. The four plenary speakers were excluded from all analyses as they did not have to decide what type of presentation to request, and were not subject to the same selection procedures as other delegates. All statistical analyses were performed in SAS version 9.3 for Windows 7 (64-bit).
We conducted five sets of analyses. First, we analysed whether there was any significant difference from equal attendance by the four groups at the conference. This statistical
test does not tell us whether there is equal participation by each group because we do not know the true distribution of Australasian evolutionary biologists in each of these groups. However, it does indicate whether attendees walking around would have gained the “impression” that they were observing each group evenly. To assess whether there was equal attendance among groups at the conference, attendance ratio was tested in the SAS procedure Fusing a chi-square test for equal proportions, with exactp-values
specified. Planned contrasts directly comparing student men and women, and academic men and women, were carried out in SAS procedure Fby testing for equal proportions
in conference attendance using the binomial test. Two-sidedp-values were selected as we did nota prioripredict that conference attendance would be higher in one gender.
Second, we examined whether there was a difference among the four groups in
‘exposure—presenters only’, which only included the 108 attendees who presented (i.e., excluding attendees assigned 0 mins). The ‘exposure—all attendees’ metric is an attempt to coarsely represent the overall and general impression of each group to other conference attendees. In contrast, the ‘exposure—presenters only’ analysis may be more representative of the impression given to conference attendees who only observed talks, without observing the ratios of each of these groups sitting around them in the audience or during breaks; or to those conference attendees who entirely weighted their impression of each group based on the presenters they saw, ignoring interactions they had when outside the presentation sessions.
Analysis of both ‘exposure’ metrics was carried out using a Kruskal–Wallis non-parametric one-way analysis of variance (ANOVA) using the SAS procedure N1
with the ‘Wilcoxon’ option specified, where the response variable was ‘exposure’, and the independent variable was ‘group’ (four categories as above). A non-parametric ANOVA was used because the response variable ‘exposure’ can only have one of two or three values (0, 5, and 12 min), therefore the data is not normally-distributed. The two-sample Kruskal–Wallis test statistic producesp-values that are equivalent to two-sidedp-values from a Wilcoxon two-sample rank-sum test. Planned contrasts were used to directly compare ‘exposure’ for women and men within each academic level.
Finally, we attempted to find the basis of any significant differences in ‘exposure’ by
analysing three metrics that reflected both the decisions of the attendees and any bias for or against each group: preference to present a talk or not; of those choosing to give a talk, preference for a long talk over a short talk; and, of those requesting a long talk, likelihood of being assigned a long talk rather than a short talk. The first two metrics address the differences in preferences for conference participation among the four groups, while the
final question helps to address any potential bias for or against the four groups.
For these three metrics, a likelihood ratio test in SAS procedure Lwas used
to assess for significant differences among groups by comparing the logit model with
and without the independent term ‘group’ (Agresti, 2013). To assess whether there was a difference among groups in their decision to present a talk (i.e., whether they submitted
an abstract), the response variable was ‘present talk’ (categorical: ‘yes’ or ‘no’). To test whether there was a difference among groups in their preference for a long talk over a
short talk, only the subset of attendees who chose to present a talk was analysed and the response variable was ‘preference for long talk’ (categorical: ‘yes’ or ‘no’). Finally, to assess whether there was a difference among groups in the likelihood of receiving a long talk
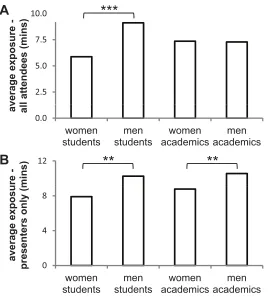
Figure 1 Time spent presenting at the AES conference.Average time (minutes) spent presenting scien-tific research (‘exposure’) for student and academic women and men at the AES conference. (A) Exposure of all attendees. This average also includes attendees who did not present a talk and so may reflect an impression of an observer who attends and weights their impression by all aspects of the conference. (B) Exposure of presenters only. This average includes only those attendees who presented a talk and so may reflect the impression of an observer who only observes the talk presenters and gauges no other impression from the audience around them, or else weights their impression of each group solely based on presenters. Significance values of planned contrasts:∗∗P<0.05;∗∗∗P<0.01.
RESULTS
Is there a difference among groups in attendance?
There was no significant difference in attendance across the four groups (exact Chi-square
test for equal proportions:χ2=4.17,df =3, exactP=0.248;Table 1). Furthermore,
student men and women did not differ in their attendance ratio at the conference
(binomial test for equal proportions:z =1.48,df =1, two-tailedP=0.140), and nor
did academic women and men (binomial test for equal proportions:z= −1.29,df =1,
two-tailedP=0.198).
Is there a difference among groups in the amount of exposure to their colleagues?
When considering all conference attendees, including those who did not present, there was no significant difference in the amount of time the four groups spent presenting
close to significance. However, when considering the two academic levels separately, student women spent a highly significantly shorter period of time (36% shorter: average of 5.9 mins vs. 9.1 mins) presenting their research to their colleagues than did student men (Kruskal–Wallis one-way ANOVA on ‘exposure—all attendees’:χ2=7.44,df =1,
P=0.006;Fig. 1A). On the other hand, academic men and women did not differ in
the amount of time (average of 7.4 mins vs. 7.3 mins) spent presenting their research (Kruskal–Wallis one-way ANOVA on ‘exposure—all attendees’:χ2 <0.01,df =1,
P=0.995;Fig. 1A).
Differences in ‘exposure’ among groups were exacerbated when considering only
those delegates who chose to present, with a significant difference among the groups
in presentation time (Kruskal–Wallis one-way ANOVA on ‘exposure–presenters only’:
χ2=11.28,df =3,P=0.010;Fig. 1B). These di
fferences among groups occurred at both
the student and academic level, and in the same direction. Of the students presenting, student women spent significantly less time (23% shorter: average of 7.9 mins vs. 10.3 mins) presenting their research than student men (Kruskal–Wallis one-way ANOVA on ‘exposure—presenters only’:χ2=5.93,df =1,P=0.015,Fig. 1B). Of the academics
presenting, academic women also spent significantly less time (17% shorter: average of 8.8 mins vs. 10.6 mins) presenting their research than academic men (Kruskal–Wallis one-way ANOVA on ‘exposure–presenters only’:χ2=3.96,df =1,P=0.047,Fig. 1B).
Is there a difference among groups in preference for presenting a talk?
There was no significant difference across the four groups in preference for presenting
a talk (likelihood ratio (LR) test for logit model:χ2=4.93,df =3,P=0.177;Table 1;
Fig. 2A), and equivalent patterns were found when directly comparing within academic
levels (LR test for logit model: women vs. men students:χ2=2.25,df =1,P=0.133;
women vs. men academics:χ2=2.18,df =1,P=0.140;Fig. 2A).
Given the lack of difference among groups in preference for presenting a talk, the
difference in exposure between genders seen above is predominantly due to giving a
long vs. a short talk. Only 41% (12/29) of presenting women students gave a long talk, as opposed to 75% (18/24) of presenting men students. Similarly, only 54% (14/26) of presenting academic women gave a long talk, compared to 79% (23/29) of academic men. Below we tease apart what caused these differences between the genders in presenting long
talks.
Of those choosing to give a talk, is there a difference among groups in preference for a long talk over a short talk?
Of those presenting a talk, there was a significant difference among groups in their
preference for a long talk over a short talk (LR test for logit model:χ2=9.55,df =3,
P=0.023;Table 1;Fig. 2B). Student men tended to have a greater preference for a long
talk over a short talk than student women, although the difference was not significant
and is based on a relatively low sample size (LR test for logit model:χ2=3.03,df =1,
Figure 2 Participation at the AES conference.Comparing participation of student and academic women and men at the AES conference. (A) Percentage choosing to present a talk. (B) Of those choosing to present a talk, percentage who prefer a long talk over a short talk. (C) Of those who prefer a long talk over a short talk, percentage of those who were assigned a long talk. Significance values of planned contrasts:
∗P<0.1;∗∗P<0.05.
were significantly more likely to prefer a long talk over a short talk compared to academic women (LR test for logit model:χ2=6.22,df =1,P=0.013;Fig. 2B).
Of those preferring a long talk over a short talk, is there a differ-ence among groups in likelihood of being assigned a long talk?
Of the attendees who preferred a long talk, there was no significant difference among the
four groups in the likelihood of the conference organisation committee assigning them a long talk (LR test for logit model:χ2=4.44,df =3,P=0.218;Table 1;Fig. 2C). However,
requested, although this difference was not quite significant and is based on a relatively
low sample size (LR test for logit model:χ2=3.20,df =1,P=0.074;Fig. 2C). There
was no significant difference between academic women and men in the likelihood of
being assigned a long talk when requested (LR test for logit model:χ2<0.01,df =1,
P=0.926;Fig. 2C).
Relative importance of factors contributing to decreased exposure for women presenters
Above, we found that student women who chose to present had 23% less time presenting than student men. No single factor was responsible, with both weaker preference for a long talk and allocation bias of a long talk being marginally non-significant contributors. If student women had the same preference for a long talk as student men (but allocation for long talks did not change), student women presenters would have 13.3% less time presenting than student men (as opposed to the 23% observed). An almost identical 13.1% difference in women student presenting time would be achieved if allocation for long talks
was equal to men students (but preference for long talks did not change). This highlights that for women students, both talk preference and talk allocation contribute equally to their reduced conference visibility as compared to men students.
In contrast, the 17% less time spent presenting by academic women compared to academic men was almost solely due to a single factor: preference for a long talk. If academic women had the same preference as academic men for a long talk (but allocation for long talks did not change), academic women presenters would only have 0.6% less presentation time than academic men (as opposed to the 17% observed). If allocation for long talks for academic women was equal to academic men (but preference for long talks does not change) they would still be presenting for 16.5% less time.
DISCUSSION
We found that women spent significantly less time presenting their research at the 2013 Australasian Evolution Society conference compared to men. This discrepancy was driven primarily by a stronger preference by men (or a weaker preference by women) for long talks. Our results highlight that even marginal differences in the presentation strategy used
by women and men result in significantly different outcomes for exposure and visibility.
Our results correspond with previous research exploring gender differences in conference
presentations decisions (Isbell, Young & Harcourt, 2012), which showed men had a stronger preference than women for presenting a talk over a poster.
These data raise two interesting questions: (1) why do women and men have apparently different presentation strategies, and (2) does this difference in presentation approach
affect a scientist’s visibility and perception by colleagues (i.e., do these differences matter)?
These questions are pertinent to the broader issue of gender discrepancies in science, and they will be important to address as we move toward resolving the multitude of underlying reasons promoting them.
Gender differences are apparent in a range of academic tasks. Women are more likely
invitations to speak (Schroeder et al., 2013), prioritize teaching over research (Winslow, 2010), are less likely to cite their own work (Maliniak, Powers & Walter, 2013) or have a webpage (Barjak, 2006) when compared to men of equal career stage. Each of these approaches or strategies may result in reduced visibility for women scientists, and ultimately may contribute to and exacerbate the pre-existing gender imbalance.
The overall gender balance at the Australasian Evolution Society conference (2013) in terms of attendance and participation in talks for both students and academics was not significantly different from equal (c.f.Schroeder et al., 2013). This is encouraging for
the future of evolutionary biology as a field and is reflective of an academic society that is acutely aware of the need to promote gender balance. What is startling is that, while delegates at the conference would have encountered equal numbers of women and men delegates, there remained a consistent gender bias in the nature of talk preference, which led to an overall difference in the exposure and visibility of women and men presenters
(sensuSchroeder et al., 2013). Student women engaged in significantly less time presenting their research to colleagues than student men (Fig. 1). This amounted to 23 or 36% (equating to approximately 2 or 3 min on average) less exposure on average for student women compared to student men, depending on whether you considered only those who presented or student attendees overall, respectively. Although the number of academic women attending did not differ overall from academic men, when considering only
those who presented, academic women as a population also spent significantly less time presenting their work (Fig. 1B): on average academic women presenters spent 17% less time presenting their research than academic men.
We found that these differences in time spent speaking predominantly arose as a result
of gender bias in preference for long talks over short talks. Student and academic men had a significantly higher preference for long talks than women presenters of the same level
(Fig. 2B), with a greater percentage of women choosing to present short ‘speed’ talks than
their equivalent men colleagues. By their very nature, short talks allow less detailed and comprehensive presentation of scientific research than long talks. Therefore, by choosing to present short talks women presenters may be portraying their scientific research and skill sets less comprehensively than men at an equivalent stage.
Why were women less likely than men to request a long talk? That the patterns were almost identical between student and academic women suggests that there is some inherent gender difference and that the observed patterns are not influenced by which
women survive the leaky pipeline. We offer three reasons for the potential differences in
more likely than established researchers to have recently changed jobs and/or research area and so have preliminary data more suited to a short talk. A coarse examination of our data suggested that, within the academics, the patterns were comparable for postdoctoral fellows and tenured staff. However, due to the sample size and incomplete information, we
were not able to analyse this formally. Analysing the academic levels more finely, such as incorporating the ‘academic age’ of all conference attendees, would be particularly valuable in ruling in or out this possible explanation for our observed gender bias.
Second, women may tend to be less aware than men of the value of presenting their research comprehensively, or may receive less encouragement or mentorship from supervisors to do so (Sambunjak, Straus & Maruˇsi´c, 2006). Women may even consider a short amount of visibility on a less comprehensive piece of research as more valuable than less frequent but more comprehensive visibility, while men may value the opposite strategy. There is some evidence in our data to support this latter argument (Figs. 2Aand
2B): fewer academic men requested a presentation than women (69% vs. 84%) but when they did so they had a significantly stronger preference for long talks (90% vs. 62%) than academic women.
Third, women have previously been shown to be more risk averse and thus more reticent to publicise their research (Maliniak, Powers & Walter, 2013) particularly if they believed it was at an incomplete stage. If true, this might easily translate into a reluctance to publish thus reducing publication output (a highly valued metric of productivity and often researcher quality) even from an early career stage. Such risk aversion may provide one explanation for the ‘productivity puzzle’ identified across so many fields of academia (Xie & Shauman, 1998;Symonds et al., 2006).
Gender differences in self-perception are apparent in other dimensions of academic
output. While a weaker preference for long over short talks, or talks over posters (Isbell, Young & Harcourt, 2012) at conferences and a reduction in the incidence of self-citation might reflect a real difference in how women “play the academic game”, both strategies lead
to a reduction in the visibility of women at all stages of their academic career. The broader impact for senior researchers of refusing plenary invitations was comprehensively outlined bySchroeder et al. (2013). Without doubt, under-representation and lower visibility of women scientists at more senior levels may serve as a negative influence on their junior colleagues, perpetuating the tendency for women to leave academia post-PhD. Our data suggests that many of the issues surrounding gender differences in visibility are already
present at the junior level and a possible reason for these differences is a lack of awareness
of the consequences of under-promoting yourself.
The selection process for the AES conference was not conducted entirely blind to gender (names were known, but gender was unspecified), and we found some evidence (albeit constrained by small sample sizes) that student women were less likely to be assigned a higher visibility long-talk slot than student men. In a recent paper,Knobloch-Westerwick, Glynn & Huge (2013)assessed experimentally the effect of gender on the perceived
that less than a quarter of the participants assessing the abstracts could actually recall the gender of the abstract authors. This suggests that the observed differences arose through
subconscious bias or “processes that the participants were unaware of and did not invest much cognitive capacity in” (Knobloch-Westerwick, Glynn & Huge, 2013).
Future directions
Additional studies are needed to understand whether these results are representative of the broader scientific community. However, our findings contribute to a growing body of literature (Leaper & Robnett, 2011;Schroeder et al., 2013) that raises several interesting questions about why men and women adopt different strategies for presenting their
research at conferences. Future studies should seek to tease apart the factors driving this gender difference both in terms of presenters’ choices (e.g., advice from supervisors or
colleagues, stage in career, perceived value of presentation, insecurity or risk-aversion), and the selection committee’s choices (e.g. whether the perceived gender of the author or the wording of their abstracts affects talk allocation decisions).
We offer four strategies for future conferences that may help redress the above
imbalance. First, greater effort should be made to educate both supervisors and students
about innate gender differences in behaviour and how these may exacerbate gender
disparity in academia. Historically, most attempts to address gender discrepancies in the workplace have focused on discrimination by others. However, there has been considerably less focus on how gender differences in behaviour can impact professional performance
(Schroeder et al., 2013). By explicitly recognizing these behavioural differences, women
will be better equipped to evaluate their own decisions, and mentors may be better able to offer advice about how to improve performance and be more competitive. Failure to
recognize and educate people about these gender differences makes it more challenging
to level the playing field for women and men and narrow the gender gap in academia and other fields of life. In the specific case of conferences, mentoring should highlight that, while it is tempting to view conference presentations as ‘less important’ than perhaps publishing a manuscript, acceptance at a conference may have implications for a future career that extends far beyond the single five- or twelve-minute presentation slot. Second, the language used by conference organisers when inviting submission of abstracts should be reviewed as it may discourage women from submitting abstracts for particular presentation types (Born & Taris, 2010). In particular, requests for talks that present clear and unambiguous results (‘no speculative abstracts’) may bias submissions of longer and more comprehensive talks towards men rather than women, particularly if there is a gender difference in the level of self-doubt about their results. Third, to redress any potential
organisers could provide links to manuscripts and documents that highlight potential gender differences and their implications.
Conclusions
Here we report a striking difference in visibility of men and women at the 2013
Australasian Evolution Society conference. Similar numbers of men and women attended the conference, and there was no gender difference in the decision to present (i.e., submit
an abstract). However, women presenters spent on average∼20% less time presenting
their research than men. This discrepancy was driven by gender differences in talk
preference: men’s preference for long talks over short talks was stronger than women’s preference. This highlights important gender differences in conference strategy, and merits
further attention in order to understand how this may contribute to gender disparities in academia.
While conference abstracts are generally not regarded as research outputs in the field of behavioural and evolutionary biology, conference attendance and presentations (particularly plenary presentations) are important means by which scientists are assessed (Schroeder et al., 2013). Typically, care is taken to reduce the Matilda effect by
ensuring equity, if not parity, at the invited plenary level (as indeed was the case for the AES conference). However, if women are less likely to request presentations with a perceived higher value, this is highly problematic. The result is not only a reduction in their immediate visibility but it may have significant implications for future funding opportunities and publication success.
ACKNOWLEDGEMENTS
We would like to thank Rob Brooks, Lee Ann Rollins, and Ben Fanson for early discussion.
ADDITIONAL INFORMATION AND DECLARATIONS
Funding
There was no funding for this work.
Competing Interests
The authors declare there are no competing interests.
Author Contributions
• Ther´esa M. Jones, Rob Lanfear and Matthew R.E. Symonds conceived and designed the
experiments, wrote the paper, reviewed drafts of the paper.
• Kerry V. Fanson conceived and designed the experiments, wrote the paper, prepared
figures and/or tables, reviewed drafts of the paper.
• Megan Higgie conceived and designed the experiments, analyzed the data, wrote the
Supplemental Information
Supplemental information for this article can be found online athttp://dx.doi.org/
10.7717/peerj.627#supplemental-information.
REFERENCES
Agresti A. 2013.Categorical data analysis. New Jersey: John Wiley & Son.
Barjak F. 2006.The role of the Internet in informal scholarly communication. Journal of the American Society for Information Science and Technology 57(10):1350–1367
DOI 10.1002/asi.20454.
Born MP, Taris TW. 2010.The impact of the wording of employment advertisements on students’ inclination to apply for a Job.Journal of Social Psychology150(5):485–502
DOI 10.1080/00224540903365422.
Bornmann L, Daniel HD. 2005.Selection of research fellowship recipients by committee peer review. Reliability, fairness and predictive validity of Board of Trustees’ decisions.Scientometrics 63(2):297–320DOI 10.1007/s11192-005-0214-2.
Casadevall A, Handelsman J. 2014.The presence of female conveners correlates with a higher proportion of female speakers at scientific symposia.mBio5(1):e00846-13
DOI 10.1128/mBio.00846-13.
Conley D, Stadmark J. 2012.Gender matters: a call to commission more women writers.Nature 488(7413):590DOI 10.1038/488590a.
Damschen EI, Rosenfeld KM, Wyer M, Murphy-Medley D, Wentworth TR, Haddad NM. 2005.
Visibility matters: increasing knowledge of women’s contributions to ecology.Frontiers in Ecology and the Environment3(4):212–219
DOI 10.1890/1540-9295(2005)003[0212:VMIKOW]2.0.CO;2.
Davenport E, Snyder H. 1995.Who cites women? Whom do women cite? An exploration of gender and scholarly citation in sociology.Journal of Documentation51(4):404–410
DOI 10.1108/eb026958.
Engqvist L, Frommen JG. 2008.Double-blind peer review and gender publication bias.Animal Behaviour76:E1–E2DOI 10.1016/j.anbehav.2008.05.023.
Faulkner W. 2009.Doing gender in engineering workplace cultures. II. Gender in/authenticity and the in/visibility paradox.Engineering Studies1(3):169–189DOI 10.1080/19378620903225059.
Ferber MA, Brun M. 2011.The gender gap in citations: does it persist?Feminist Economics 17(1):151–158DOI 10.1080/13545701.2010.541857.
Hill C, Corbett C, St Rose A. 2010.Why so few? Women in science, technology, engineering, and mathematics. Washington: AAUW.
Isbell LA, Young TP, Harcourt AH. 2012. Stag parties linger: continued gender bias in a female-rich scientific discipline.PLoS ONE7(11):e49682DOI 10.1371/journal.pone.0049682.
Knobloch-Westerwick S, Glynn CJ, Huge M. 2013.The Matilda effect in science communication: an experiment on gender bias in publication quality perceptions and collaboration interest. Science Communication35(5):603–625DOI 10.1177/1075547012472684.
Kretschmer H, Kundra R, Beaver DD, Kretschmer T. 2012.Gender bias in journals of gender studies.Scientometrics93(1):135–150DOI 10.1007/s11192-012-0661-5.
Leaper C, Robnett RD. 2011.Women are more likely than men to use tentative language, aren’t they? A meta-analysis testing for gender differences and moderators.Psychology of Women
Quarterly35(1):129–142DOI 10.1177/0361684310392728.
Lincoln AE, Pincus S, Koster JB, Leboy PS. 2012.The Matilda effect in science: awards and prizes in the US, 1990s and 2000s.Social Studies of Science42(2):307–320
DOI 10.1177/0306312711435830.
Maliniak D, Powers R, Walter BF. 2013.The gender citation gap in international relations. International Organization67:889–922DOI 10.1017/S0020818313000209.
Moss-Racusin CA, Dovidio JF, Brescoll VL, Graham MJ, Handelsman J. 2012.Science faculty’s subtle gender biases favor male students.Proceedings of the National Academy of Sciences 109(41):16474–16479DOI 10.1073/pnas.1211286109.
Pell AN. 1996.Fixing the leaky pipeline: women scientists in academia.Journal of Animal Science 74(11):2843–2848.
Rossiter MW. 1993.The Matthew–Matilda effect in science.Social Studies of Science23(2):325–341
DOI 10.1177/030631293023002004.
Sambunjak D, Straus SE, Maruˇsi´c A. 2006.Mentoring in academic medicine: a systematic review. Journal of the American Medical Association296:1103–1115DOI 10.1001/jama.296.9.1103.
Schroeder J, Dugdale HL, Radersma R, Hinsch M, Buehler DM, Saul J, Porter L, Liker A, De Cauwer I, Johnson PJ, Santure AW, Griffin AS, Bolund E, Ross L, Webb TJ, Feulner PGD, Winney I, Szulkin M, Komdeur J, Versteegh MA, Hemelrijk CK, Svensson EI, Edwards H, Karlsson M, West SA, Barrett ELB, Richardson DS, Van den Brink V, Wimpenny JH, Ellwood SA, Rees M, Matson KD, Charmantier A, dos Remedios N, Schneider NA, Teplitsky C, Laurance WF, Butlin RK, Horrocks NPC. 2013.Fewer invited talks by women in evolutionary biology symposia.Journal of Evolutionary Biology26(9):2063–2069
DOI 10.1111/jeb.12198.
Symonds MRE, Gemmell NJ, Braisher TL, Gorringe KL, Elgar MA. 2006.Gender differences in publication output: towards an unbiased metric of research performance.PLoS ONE1(1):e127
DOI 10.1371/journal.pone.0000127.
Thelwall M, Barjak F, Kretschmer H. 2006.Web links and gender in science: an exploratory analysis.Scientometrics67(3):373–383DOI 10.1556/Scient.67.2006.3.3.
Tinsley CH, Cheldelin SI, Schneider AK, Amanatullah ET. 2009.Women at the bargaining table: pitfalls and prospects.Negotiation Journal25(2):233–248
DOI 10.1111/j.1571-9979.2009.00222.x.
Wenneras C, Wold A. 1997.Nepotism and sexism in peer-review.Nature387(6631):341–343
DOI 10.1038/387341a0.
West JD, Jacquet J, King MM, Correll SJ, Bergstrom CT. 2012.The role of gender in scholarly authorship. ArXiv preprint.arXiv:1211.1759.
Winkler JA, Tucker D, Smith AK. 1996.Salaries and advancement of women faculty in atmospheric science: some reasons for concern.Bulletin of the American Meteorological Society 77(3):473–490DOI 10.1175/1520-0477(1996)077<0473:SAAOWF>2.0.CO;2.
Winslow S. 2010.Gender inequality and time allocations among academic faculty.Gender & Society24(6):769–793DOI 10.1177/0891243210386728.