Business Intelligence
with Microsoft
®Office
PerformancePoint
™
Business Intelligence
with Microsoft
®Office
PerformancePoint
™
Server 2007
Craig Utley
Copyright © 2008 by The McGraw-Hill Companies. All rights reserved. Manufactured in the United States of America. Except as permitted under the United States Copyright Act of 1976, no part of this publication may be reproduced or distributed in any form or by any means, or stored in a database or retrieval system, without the prior written permission of the publisher.
0-07-158943-0
The material in this eBook also appears in the print version of this title: 0-07-149370-0.
All trademarks are trademarks of their respective owners. Rather than put a trademark symbol after every occurrence of a trademarked name, we use names in an editorial fashion only, and to the benefit of the trademark owner, with no intention of infringement of the trademark. Where such designations appear in this book, they have been printed with initial caps.
McGraw-Hill eBooks are available at special quantity discounts to use as premiums and sales promotions, or for use in corporate training programs. For more information, please contact George Hoare, Special Sales, at george_hoare@ mcgraw-hill.com or (212) 904-4069.
TERMS OF USE
This is a copyrighted work and The McGraw-Hill Companies, Inc. (“McGraw-Hill”) and its licensors reserve all rights in and to the work. Use of this work is subject to these terms. Except as permitted under the Copyright Act of 1976 and the right to store and retrieve one copy of the work, you may not decompile, disassemble, reverse engineer, reproduce, modify, create derivative works based upon, transmit, distribute, disseminate, sell, publish or sublicense the work or any part of it without McGraw-Hill’s prior consent. You may use the work for your own noncommercial and personal use; any other use of the work is strictly prohibited. Your right to use the work may be terminated if you fail to comply with these terms.
THE WORK IS PROVIDED “AS IS.” McGRAW-HILL AND ITS LICENSORS MAKE NO GUARANTEES OR WARRANTIES AS TO THE ACCURACY, ADEQUACY OR COMPLETENESS OF OR RESULTS TO BE OBTAINED FROM USING THE WORK, INCLUDING ANY INFORMATION THAT CAN BE ACCESSED THROUGH THE WORK VIA HYPERLINK OR OTHERWISE, AND EXPRESSLY DISCLAIM ANY WARRANTY, EXPRESS OR IMPLIED, INCLUDING BUT NOT LIMITED TO IMPLIED WARRANTIES OF MERCHANTABILITY OR FITNESS FOR A PARTICULAR PURPOSE. McGraw-Hill and its licensors do not warrant or guarantee that the functions contained in the work will meet your requirements or that its operation will be uninterrupted or error free. Neither McGraw-Hill nor its licensors shall be liable to you or anyone else for any inaccuracy, error or omission, regardless of cause, in the work or for any damages resulting therefrom. McGraw-Hill has no responsibility for the content of any information accessed through the work. Under no circumstances shall McGraw-Hill and/or its licensors be liable for any indirect, incidental, special, punitive, consequential or similar damages that result from the use of or inability to use the work, even if any of them has been advised of the possibility of such damages. This limitation of liability shall apply to any claim or cause whatsoever whether such claim or cause arises in contract, tort or otherwise.
We hope you enjoy this
McGraw-Hill eBook! If
you’d like more information about this book,
its author, or related books and websites,
please click here.
Professional
About the Author
Craig Utley is a mentor with Solid Quality Mentors and a former program manager for the SQL Server Customer Advisory Team at Microsoft. He has been working with Microsoft’s BI products since the SQL Server 7 beta, originally helping to author Microsoft’s first data warehousing course and then teaching it at Microsoft and many other companies. Craig now helps companies implement BI solutions using Microsoft and related technologies, covering all aspects from architecture and design to implementation and training. He is a published author, conference speaker, and member of the INETA Speakers Bureau.
About the Contributing Author
Sony Jose, who has a MS in Engineering from Georgia Tech in Atlanta, Georgia, has over 10 years of experience working with Microsoft Business Intelligence tools. As a consultant, he has delivered successful Data Warehouse implementations and OLAP solutions in several industries, including Banking and Finance, Healthcare, Energy, Retail, and Software verticals. Sony served as a member of the team that implemented PPS Planning module at Microsoft prior to its General Availability release. He is currently a mentor with Solid Quality Mentors, and provides training and mentoring in advanced BI solutions to clients across the country. He teaches classes on Microsoft BI tool suite and speaks at BI seminars and conferences. He is also a Microsoft Certified Database Administrator (MCDBA). He lives in Atlanta with his wife Lucy and daughter Anne.
About the Technical Editor
ix
Contents at a Glance
Part 1
Business
Intelligence
Chapter 1 The Case for Business Intelligence . . . 3
Chapter 2 Introducing PerformancePoint Server 2007 . . . 21
Chapter 3 Data Warehousing and Business Intelligence . . . 31
Chapter 4 Scorecards and Key Performance Indicators . . . 61
Part II
Monitoring, Analysis, and Planning
Chapter 5 Monitoring in PerformancePoint Server . . . 81Chapter 6 Analysis with PerformancePoint Server and ProClarity . . . 137
Chapter 7 Planning Module in PerformancePoint Server . . . 215
Part III
Additional Tools and Security
Chapter 8 PerformancePoint Deployment and Security . . . 283Chapter 9 Analysis with Excel 2007 . . . 295
Chapter 10 SQL Server Reporting Services . . . 317
xi
Contents
Acknowledgments . . . xv
Introduction . . . xvii
Part I
Business
Intelligence
Chapter 1 The Case for Business Intelligence . . . 3What Is Business Intelligence? . . . 4
The Consumers of Business Intelligence . . . 7
Business Decision-Makers . . . 7
Knowledge Workers . . . 8
Analysts . . . 8
Line Workers . . . 9
Delivering Data to Business Intelligence Consumers . . . 9
Business Scorecards . . . 10
Reports . . . 12
Analytic Applications . . . 14
Line-of-Business Applications . . . 16
Real World Examples . . . 16
Scorecard for Non-Profit Entity . . . 16
Where’s the Time Going? . . . 18
Tracking Retail Sales . . . 19
Summary . . . 20
Chapter 2 Introducing PerformancePoint Server 2007 . . . 21
What Is PerformancePoint Server 2007? . . . 22
Monitoring with PerformancePoint Server . . . 23
Analysis with PerformancePoint Server . . . 25
Planning with PerformancePoint Server . . . 26
Summary . . . 29
xi
x i i
B u s i n e s s I n t e l l i g e n c e w i t h M i c r o s o f t O f f i c e P e r f o r m a n c e P o i n t S e r v e r 2 0 0 7Chapter 3 Data Warehousing and Business Intelligence . . . 31
Designing to Solve the Problem . . . 33
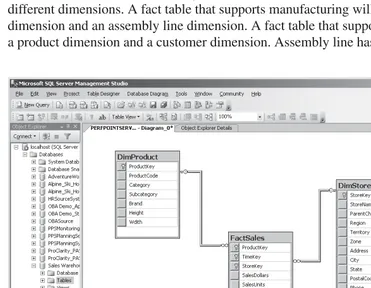
Dimensions and Dimension Tables . . . 34
Fact Tables . . . 39
Extracting, Transforming, and Loading Data . . . 43
ETL Using SQL Server Integration Services . . . 44
Data Quality . . . 46
Building Cubes . . . 47
Steps to Cube Design . . . 48
Cube Deployment and Processing . . . 57
Delivering Data to Consumers . . . 58
Summary . . . 59
Chapter 4 Scorecards and Key Performance Indicators . . . 61
Key Performance Indicators . . . 62
KPIs and Measures . . . 62
Deciding What KPIs to Track . . . 65
Example KPIs . . . 66
Scorecards and Dashboards . . . 69
Balanced Scorecards . . . 71
Business Scorecards . . . 72
Strategy Maps . . . 74
Summary . . . 77
Part II
Monitoring, Analysis, and Planning
Chapter 5 Monitoring in PerformancePoint Server . . . 81Data Sources and Scorecards . . . 82
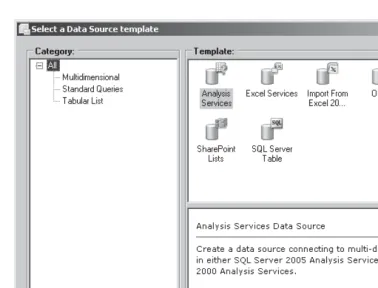
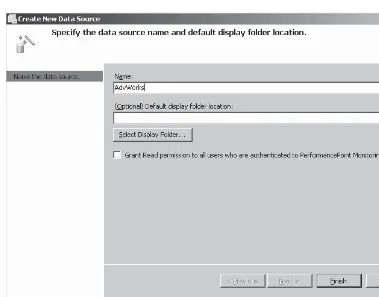
Creating Data Sources . . . 85
Creating a Scorecard . . . 90
Creating and Modifying KPIs . . . 97
KPIs with Multiple Targets . . . 105
Adding Multiple KPIs at Once . . . 107
Working with Objectives . . . 109
Aggregations and Trends . . . 111
C o n t e n t s
x i i i
Reports and Strategy Maps . . . 116
Creating an Analytic Chart Report . . . 117
Creating a Trend Analysis Chart . . . 119
Strategy Maps . . . 122
Dashboards—Putting it All Together . . . 127
Creating a Dashboard . . . 127
Adding Filters to the Dashboard . . . 130
Summary . . . 136
Chapter 6 Analysis with PerformancePoint Server and ProClarity . . . 137
Analysis with PerformancePoint Server . . . 138
Analytic Charts . . . 140
Analytic Grids . . . 159
Analysis with ProClarity . . . 168
The ProClarity Professional Client . . . 169
The ProClarity Standard Client . . . 207
Summary . . . 214
Chapter 7 Planning Module in PerformancePoint Server . . . 215
Planning Administration Console . . . 216
Planning Business Modeler . . . 231
Dimensions . . . 234
Models . . . 257
Forms and Reports . . . 261
Process Management . . . 262
Security and Roles . . . 269
Associations . . . 271
PerformancePoint Add-in for Excel . . . 271
Creating Reports and Forms . . . 271
Submitting Plan Data . . . 277
Summary . . . 280
Part III
Additional Tools and Security
Chapter 8 PerformancePoint Deployment and Security . . . 283Deploying PerformancePoint Server . . . 284
Installing the Monitoring Server . . . 285
x i v
B u s i n e s s I n t e l l i g e n c e w i t h M i c r o s o f t O f f i c e P e r f o r m a n c e P o i n t S e r v e r 2 0 0 7Security Considerations for PerformancePoint Server . . . 292
Internet Information Services Security . . . 292
Secure Sockets Layer . . . 293
Kerberos and Delegation . . . 293
Summary . . . 294
Chapter 9 Analysis with Excel 2007 . . . 295
Performing Analysis with Excel 2007 . . . 296
Using the PivotTable . . . 296
Using the PivotChart . . . 311
Summary . . . 315
Chapter 10 SQL Server Reporting Services . . . 317
Creating Reports with Reporting Services . . . 318
Accessing Cubes with Reporting Services . . . 319
Accessing Relational Data . . . 335
Summary . . . 343
xv
Acknowledgments
W
orking on a technical book is something that cannot be done alone. The image of the writer hunched over his keyboard and writing into the wee hours of the morning may be accurate, but it’s only part of the tale. Chapters are sent to a technical editor, reviewed, updated, reviewed by a copy editor, updated, typeset (for lack of a better word), reviewed again, and finally they’re ready to go. In between, questions fly back and forth between editors, managers, and technical people as the book comes together. Somewhere, one or more artists create professional images from hand-drawn pictures when the author, as in my case, lacks any sort of artistic skill.I’ve been extremely lucky to have excellent help on this project. Two people, in particular, are singled out for high praise. The first is Alyson Powell Erwin, a program manager on the PerformancePoint Server team. Alyson was the technical editor for this book and her suggestions were always excellent. Beyond simply being the technical editor, however, Alyson answered many of my often inane questions, provided insight about why some features worked as they did, and offered alternatives to the ways I first presented some of the material in this book. Alyson was my conduit into the PPS team at large and I truly appreciate her as well as her efforts.
The second person to make a major impact on this book is Sony Jose. Sony is a colleague of mine at Solid Quality Mentors, but as of the time of this writing we have not met in person. Sony was lucky enough to be involved with one of the first production installations of the Planning Server portion of PerformancePoint Server; as such, I asked him to write Chapter 7 and he obliged. I found his writing style to merge well with mine, but it was his actual use of the product in a large corporate environment that proved invaluable for seeing how to actually set up and work with models. Sony, thanks a million!
There are many people to thank at McGraw-Hill, of course. Mandy Canales was my acquisitions coordinator and she somehow managed to put up with me and my schedule changes, all the while remaining positive. Wendy Rinaldi, the Editorial Director, first approached me about doing the book and she continued to stay involved.
x v i
B u s i n e s s I n t e l l i g e n c e w i t h M i c r o s o f t O f f i c e P e r f o r m a n c e P o i n t S e r v e r 2 0 0 7Wendy helped drive the book to completion and was always professional and friendly. My copy editor, Julie Smith, helped ensure that none of my former English teachers would throw a fit.
Thanks to Russ Whitney of Microsoft for looking over the chapters and providing feedback; I think his team has done a superb job and I expect great things from them in the future. I’d also like to thank Mark Souza, Lubor Kollar, and the rest of the SQL Server Customer Advisory Team who gave me a chance to work directly with the Analysis Services team for over a year.
xvii
Introduction
I
t was a hot and humid day in New Orleans. I was speaking at a conference, presenting a topic on Analysis Services (it might have been OLAP Services; my mind is a little fuzzy on this point). After I finished describing cubes and showing people how to build them, I browsed the cube using ProClarity 2.0. After the presentation, I learned there had been someone from ProClarity Corp. (then called Knosys) in the audience when Tammy Tilzey came up to speak with me. Over the course of a few months, we discussed the product and its future and I ended up writing the courseware for version 3.0.My familiarity with Microsoft’s data warehousing products goes back to the beta days of SQL Server 7 and I’ve always been a fan of the ProClarity front-end tool. I was fortunate to end up working with ProClarity and see the introduction of their thin-client product, the ProClarity Analytics Server, as well as the ProClarity Dashboard and a few other products firsthand.
I always felt that data warehousing had the power to truly bring benefits to an organization, but that the choice of the proper front end tools was crucial. Therefore, I advocated a mix of scorecards aimed at the top end of the organization, reports for the majority of users, and powerful analytics tools for the analysts and power users. ProClarity could handle some of this, and mixed with SQL Server Reporting Services and Microsoft Office Business Scorecard Manager, businesses had a fairly complete set of tools to deliver value from their warehouse to the entire organization.
In early 2006 I was teaching a data warehousing class to a group at Microsoft, and I mentioned that I wished Microsoft would hurry up and buy ProClarity; a week later the deal was announced. I believed that Microsoft buying ProClarity would be a good thing, but the way that Microsoft would choose to integrate the ProClarity products remained to be seen.
x v i i i
B u s i n e s s I n t e l l i g e n c e w i t h M i c r o s o f t O f f i c e P e r f o r m a n c e P o i n t S e r v e r 2 0 0 7Microsoft’s goal for PerformancePoint Server was for a unified product that would allow businesses to monitor the business, analyze the data, and plan for the future; plans could then be compared against actuals in the new year as well as performance monitored—thus completing the circle.
I was excited about the prospects for the product. Finally, the ProClarity features I had known for years were growing up and would become part of a larger, integrated suite that would provide business intelligence value at many levels of the organiza-tion. While version one of PerformancePoint Server isn’t quite as integrated as I’d hoped, it’s definitely headed in the right direction and is going to help deliver value to many businesses that have thus far deployed nothing more than Excel.
This book lays out what business intelligence is all about, who the consumers of business intelligence are, and how they consume data. It discusses the business intelligence concepts and shows how they can be delivered using PerformancePoint Server and ProClarity, whether through monitoring, analysis, or planning. I also discuss Excel 2007 and Reporting Services, since both can continue to be used for delivering data in various formats.
PART
I
3
CHAPTER
1
The Case for
Business Intelligence
IN THIS CHAPTER
4
B u s i n e s s I n t e l l i g e n c e w i t h M i c r o s o f t O f f i c e P e r f o r m a n c e P o i n t S e r v e r 2 0 0 7B
usiness intelligence is a concept that can cover many technologies. A business intelligence solution usually covers a wide range of processes, software, and techniques, from retrieving the data from source systems to delivering business value to end users. In order to help deliver end-to-end business intelligence, Microsoft has created a suite of products that covers the entire gamut, of which PerformancePoint Server 2007 is an important part. This chapter, however, will focus on business intelligence in general, including the users of business intelligence and the kinds of tasks they’ll perform in their daily jobs. In this chapter, I’ll first describe business intelligence from a high level, and then define what it is and why it’s important. Next I’ll describe the various consumers of business intelligence, and as you’ll see, it can encompass virtually everyone in an organization. Finally, I’ll conclude the chapter with a variety of ways to deliver data to the various classes of users.What Is Business Intelligence?
Business intelligence (BI) is more of a concept than a single technology. The goal is to gain insight into the business by bringing together data, formatting it in a way that enables better analysis, and then providing tools that give users power—not just to examine and explore the data, but to quickly understand it. Many in the information technology field are familiar with the saying, “Data is not information.” This phrase underscores the idea that data points by themselves fail to impart much useful information and that data must be put into context to be meaningful. A list of sales numbers is not helpful unless it includes the products sold, when they were sold, where they were sold, and so on. It is important to include context when looking at data in order to turn it into information.
While obtaining information is important, information is only useful if it is easy to grasp so that people can use it to make decisions. There is much information in books on nuclear physics or Cycladic statuary and burial rites, but without the proper context and training such information can be hard to comprehend. It is therefore the goal to make data easy to comprehend; a quick grasp of the trends, relationships, and relative strengths and weaknesses is essential to delivering a usable system that truly delivers business value.
C h a p t e r 1 : T h e C a s e f o r B u s i n e s s I n t e l l i g e n c e
5
is consistent and accessible. This is the process of building a data warehouse or data mart, and is covered in detail in Chapter 3. This is often a challenging process, with many companies seeming to make the mistake of believing that this is the beginning and end of their BI project. I have personally been into numerous companies that have built warehouses and then provided completely inadequate tools for letting people actually use the information contained in the warehouse. This is like buying a car and then locking it in a garage so it can never be driven; the potential value will never be realized.
After building the warehouse, there must be a mechanism to retrieve the data and present it to business users so that they can understand it and act upon what they see. This is where PerformancePoint Server and ProClarity come in, because they are tools built to provide businesses with the ability to monitor and analyze the data. Much of the ability to easily grasp data is because of visualization capabilities available in the products, such as charts, graphs, scorecards, decomposition trees, performance maps, and so on. The data in warehouses can also be used in traditional reports, which, when viewed online, may include interactivity for performing data analysis.
PerformancePoint Server adds another piece to the mix: modeling. Modeling can encompass planning, budgeting, and forecasting. While these three items can certainly be done without a warehouse in place, the warehouse provides two major benefits: first, historical data is easily accessible and can be examined for trends and past results; second, the budgets and forecast can be put back into the warehouse and actual results can be tracked against the budget or forecast in the warehouse as time moves on.
There are numerous pieces to a business intelligence solution. The term business intelligence, or BI, is used in this book to indicate the entire process. The entire process of business intelligence can be broken into the following steps:
1. Identifying the business problem(s) to be addressed by the warehouse and the data needed to address those problems.
2. Identifying the location for all necessary data and extracting it from those sources.
3. Transforming the data from various sources into consolidated, consistent data.
4. Loading the transformed data into a centralized location.
5. Building a data warehouse (or data mart) with the data from the centralized location. The structure being built is called a cube.
6
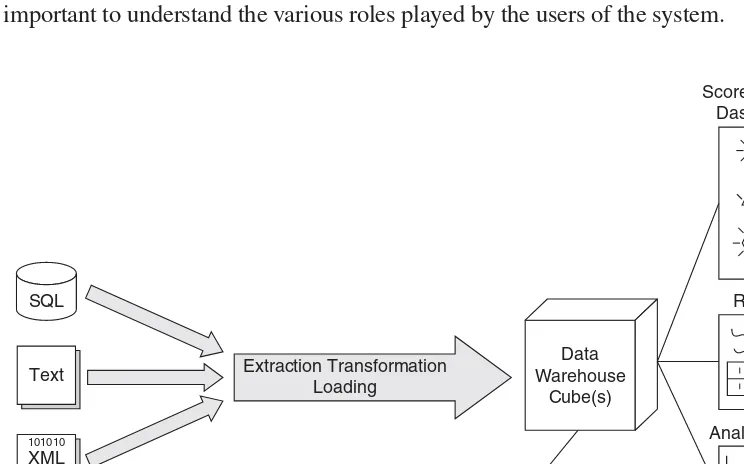
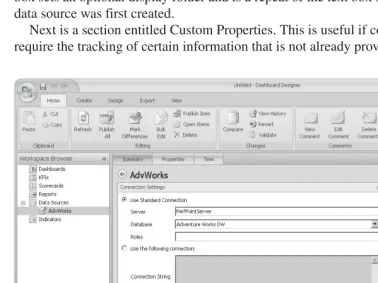
B u s i n e s s I n t e l l i g e n c e w i t h M i c r o s o f t O f f i c e P e r f o r m a n c e P o i n t S e r v e r 2 0 0 7Step 1 requires you to identify the business problems to be solved and is beyond the scope of this book except for casual mention. Steps 2-5 are discussed in some detail in Chapter 3, which addresses the overall process of building a data warehouse (or data mart or cube; the terms are clearly defined there.) Step 6 is what is covered in the rest of the book, including the PerformancePoint Server product and its capabilities. Figure 1-1 shows these various steps in an overall business intelligence process. It should now be obvious that business intelligence covers more than just building a data warehouse; indeed, it includes one or more ways to access and analyze data that deliver value across the business.
While the process of building a data warehouse is critical to the success of the project, it is a subject best handled by books dedicated to the tools used for data warehouse creation: SQL Server Integration Services (SSIS) and SQL Server Analysis Services (SSAS). Books such as Hands-On SQL Server 2005 Integration Services and
Delivering Business Intelligence with Microsoft SQL Server 2005 cover these topics in great detail. This book, on the other hand, focuses on the tools that allow companies to use the warehouse and to achieve the benefits of being able to monitor the health of the organization, perform complex analysis of their data, and plan for the future using the strength of the warehouse. In order to better understand these pieces, however, it is important to understand the various roles played by the users of the system.
[image:26.595.51.423.339.571.2]SQL Text XML 101010 010101 Extraction Transformation Loading Data Warehouse Cube(s) Scorecards and Dashboards Reports Analytic Tools Custom Applications Item Try also
C h a p t e r 1 : T h e C a s e f o r B u s i n e s s I n t e l l i g e n c e
7
The Consumers of Business Intelligence
People perform vastly different roles within organizations and therefore have varying needs for how and why they consume information. It is important to understand these roles and the business reach and impact they have. After identifying four roles of an organization, I will delve into the ways these roles can interact with data and why there is no one approach that satisfies all business needs.
The four roles that will be examined include
䉴 Business Decision-Makers
䉴 Knowledge Workers
䉴 Analysts
䉴 Line Workers
Obviously, roles are not always so cut and dry, and one person may well have responsibilities in more than one role. However, it is important to understand the business focus of each role and their corresponding need for information.
Business Decision-Makers
The role of business decision-maker encompasses several titles in an organization: executives, directors, and managers. These various jobs are different in important ways, but all have one thing in common: the need for timely information is critical so that these individuals can make decisions that drive the business.
8
B u s i n e s s I n t e l l i g e n c e w i t h M i c r o s o f t O f f i c e P e r f o r m a n c e P o i n t S e r v e r 2 0 0 7The actual data needed by business decision makers varies based on their functional role: A vice president of finance will look at different metrics than the vice president of human resources, for example. Chapter 4 will delve more into different business areas and what some of the key metrics are for various departments within a company.
Knowledge Workers
Knowledge workers make up the bulk of non-management office staff. Software developers, marketing personnel, human resources staff, financial accountants, and other such workers are professional staff that have the need for information, but often do not have the ability to make decisions that have a large business impact. A marketing person, for example, may be tasked with creating marketing materials to sell a new product or service. This person may do research by examining the market place, look at competing products, conduct focus groups, study internal quality control procedures, and more, but the end result is materials that must be approved by management—the money for creation is allocated by someone other than that marketing person.
Such knowledge workers have a real need for data, but often the data needed is at a lower level of detail than that needed by business decision-makers. In addition, the data needed may be completely different for each request, while business decision-makers tend to look at the same set of numbers on a regular basis.
Knowledge workers may need to do some data exploration, but this is often not at a particularly deep level. For example, a sales representative might well need to know the previous sales to a particular client, returns by that particular client, and the projected sales to that client over the next several months. The drivers behind the projection are probably known to the sales representative and might include items such as new products in the pipeline or promotions that are in the works, but the statistical models used to forecast the projected product mix or future sales for that particular client are often of little concern. Such details are often left in the hands of analysts.
Analysts
C h a p t e r 1 : T h e C a s e f o r B u s i n e s s I n t e l l i g e n c e
9
Many analysts employ advanced statistical techniques in order to analyze the data. These models may be used for forecasting purposes or to examine the numbers in relation to norms and standards throughout the industry. One is example is when a business manages pensions or other retirement funds for its employees. The performance of these funds can easily be compared to a number of standard financial indexes, and future performance can be forecasted and compared against future payout forecasts.
Many manufacturing and transportation businesses also employ models that help predict costs based on the price of oil. Some of these models might also have to include currency fluctuations if some of the raw materials are purchased from foreign businesses. These complex statistical models require flexible software that gives analysts nearly unrestricted access to the data. Some of what these analysts do is considered data mining, a technology which uses statistical models to examine data for relationships or make predictions based on existing data.
Line Workers
Line workers are those workers on the front lines and may include assembly line workers in a manufacturing company and cashiers in a retail establishment. Many such workers benefit from business intelligence although they may not realize it. Data derived from a business intelligence process may be integrated into line of business applications that allow line workers to better do their jobs. Cashiers in a retail establishment might be able to recommend complimentary or replacement items based on customer preferences. Call center workers can see the order and return history of customers calling in with questions. Assembly line workers can obtain real-time statistics on the number of units produced, quality control, and inventory levels. Such workers may not know the term “business intelligence” or have any idea that the data they are viewing comes from a data warehouse. Nonetheless, they are still consumers of data and therefore part of the business intelligence process.
Delivering Data to Business Intelligence Consumers
1 0
B u s i n e s s I n t e l l i g e n c e w i t h M i c r o s o f t O f f i c e P e r f o r m a n c e P o i n t S e r v e r 2 0 0 7While a single warehouse may be able to handle the data needs for many or all consumers, the same is not true of the different methods used to display and navigate that information. In other words, there are many different techniques that can be used to present data to consumers, and thus there are different tools available to provide this data display. It would be great to be able to say that PerformancePoint Server can handle every situation. In fact, PerformancePoint Server and ProClarity combine to provide a wealth of different display methods, although custom applications are sometimes the best way to get information to consumers. This section focuses on different ways to present the data and the ways that users benefit from those different presentations.
Business Scorecards
Business scorecards, sometimes called just scorecards, are a means of quickly showing someone the overall health of the business or a particular division. Scorecards typically show Key Performance Indicators, or KPIs, which are the primary numbers upon which the organization or person is focused. For example, the vice president of manufacturing might be interested in such items as
䉴 The number of units produced
䉴 The number of items failing quality control
䉴 The amount of scrap metal generated
䉴 Current inventory levels
䉴 Current raw materials inventory
䉴 The current price of steel
C h a p t e r 1 : T h e C a s e f o r B u s i n e s s I n t e l l i g e n c e
1 1
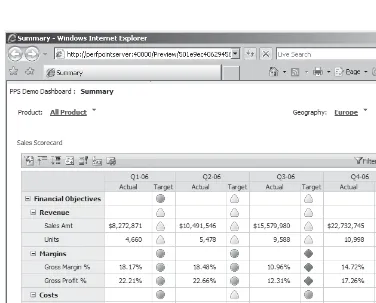
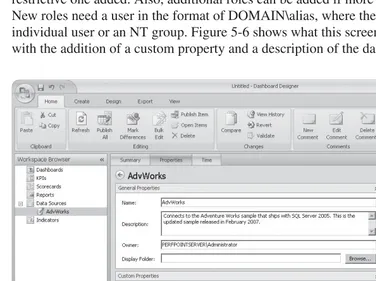
In addition to the health of a KPI, many KPIs also have a trend indicator, showing whether they are improving or slipping. In the case of the number of items failing a quality control audit, lower numbers are better, so a decline in the number would actually be a positive trend. Because the trend and the health of a KPI are tracked separately, the health might be good but show a downward trend, or a KPI with poor health might be holding steady, indicating that efforts to improve it are not having any impact. Figure 1-2 shows a sample scorecard in PerformancePoint Server.
[image:31.595.49.425.258.561.2]The name scorecard also implies some form of score. Many organizations do not go through this process, but KPIs can be weighted so that an overall score is generated. This is useful in situations where a company wants to apply the same scorecard to each of several locations. Using a score, it becomes simple to rank each location based on this score.
1 2
B u s i n e s s I n t e l l i g e n c e w i t h M i c r o s o f t O f f i c e P e r f o r m a n c e P o i n t S e r v e r 2 0 0 7Scorecards can certainly be used by anyone in an organization, as everyone appreciates a quick glance summary of the data. However, scorecards are aimed at higher levels of an organization: the business decision-makers. Executives and others with decision-making authority in an organization are typically very busy people, and they don’t have time to plumb the data for hidden gems of information; instead, they need a quick overview of the organization’s health. Scorecards work perfectly for this by providing that at-a-glance update on the most important business metrics. If any numbers are off, the business decision maker can sometimes perform some analytics to uncover the cause, but most often they have an analyst on staff that will be given the task for investigating the issue. The analyst has tools far more adept at performing complex analysis than can be done with a scorecard.
Scorecards are often placed on a dashboard. A dashboard may contain one or more scorecards, some KPIs independent of a scorecard, reports from Reporting Services, and charts from ProClarity. To add another layer to this, a portal is the top of the heap and may contain one or more dashboards as well as a copy of the person’s calendar, e-mail, and so forth. Dashboards are what are ultimately deployed by PerformancePoint Server, and the primary deployment target for these dashboards is SharePoint. SharePoint is an excellent tool for bringing together information from multiple applications and displaying it in a centralized location.
The creation of scorecards, as well as some common KPIs, will be examined in depth in Chapters 4 and 5.
Reports
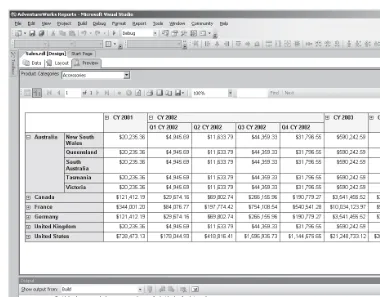
Reports are typically boring collections of numbers in rows and columns. Despite their generally dull nature, reports are still in huge demand across many organizations. Fortunately, reports don’t have to be as dull as they have been in the past. Thanks to online report viewing, reports can now be interactive, providing end users with the ability to drill down and obtain additional information, or choose values from a filter list to narrow the scope of what they see in the report. Understand that when discussing reports, the terms filters and parameters are often used interchangeably, and that will be the case in this book. Figure 1-3 shows a report that allows users to narrow the data using drop-down list boxes, as well as drill into more detail by expanding regions of the report.
C h a p t e r 1 : T h e C a s e f o r B u s i n e s s I n t e l l i g e n c e
1 3
Standard reports are not natively part of PerformancePoint Server, but PerformancePoint integrates well with Reporting Services. Various actions in PerformancePoint can link to reports hosted in Reporting Services, allowing end users to find more detailed information. For example, a KPI in a scorecard might show that employee retention is below desired levels. Clicking on that KPI could open a report that lists each department ordered by the percentage turnover that department has experienced in the last quarter.
[image:33.595.45.425.71.368.2]Reports do not need to be only a device reached through other tools, however; for many organizations, reports are the only tool widely distributed. Reports are a staple of any organization and—thanks to intranets and ubiquitous connectivity—online reports can be distributed with ease. Anyone can log onto a centralized report server and view real-time reports. In addition, reports can be generated on a scheduled basis and distributed via e-mail or printed and distributed.
1 4
B u s i n e s s I n t e l l i g e n c e w i t h M i c r o s o f t O f f i c e P e r f o r m a n c e P o i n t S e r v e r 2 0 0 7For example, imagine a company in the US that has a number of stores throughout the US and Canada. Each store manager has access to six predefined reports. Most store managers start their day by viewing online reports showing how their particular store is doing compared to the other stores in their district and to other stores
companywide. These reports are simple, static reports and the managers can flip through them quickly. This is close to being suitable for a scorecard, but the reports contain more detailed information than is normally found in a scorecard scenario.
Reports do not have to be static. Interactive reports provide tremendous flexibility by allowing end users to narrow the scope through parameters by selecting values from drop-down list boxes. In addition, reports can provide drill-down capabilities, either by linking to other reports or providing expanding and collapsing regions directly in the report. Adding such interactivity allows end users to answer many questions themselves without having to learn complex analytic applications or how to perform their own queries.
Analytic Applications
Analytic applications are specialized tools that enabled detailed analysis on data in a warehouse. In this book I specifically about tools that interact with Analysis Services, the cube-building engine Microsoft provides with SQL Server. Surprisingly, most readers will already be using the most popular analytic application, Microsoft Excel. Excel has had the capability to interact with Analysis Services cubes for some time, but Excel 2007 makes a huge leap forward in the capabilities and usability of Excel as a cube browsing tool.
For years, the most popular third-party tool for browsing cubes was ProClarity. ProClarity Corporation created a thick, desktop client called ProClarity Professional, as well as a web-based tool they called ProClarity Analytics Server, or PAS. PAS included a thin client for browsing cubes called ProClarity standard, and it mimicked most, but not all, of the functionality found in ProClarity Professional. With
Microsoft’s acquisition of ProClarity in 2006, the groundwork was laid to merge the strong analytic tools from ProClarity with some of Microsoft’s tools, including the Business Scorecard Manager. The merger of these tools, as well as the addition of a planning piece, has led to PerformancePoint Server.
C h a p t e r 1 : T h e C a s e f o r B u s i n e s s I n t e l l i g e n c e
1 5
wants to work with the data without restrictions and follow any train of thought through iterative analysis of the data.
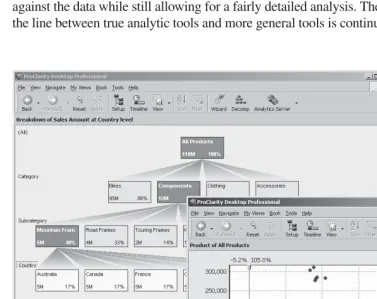
Many of these tools also include advanced visualizations in the form of different graph and chart types. Figure 1-4 shows an example of some of ProClarity’s advanced views of the data and how they can be used to quickly identify problem areas, outliers, and so forth.
[image:35.595.48.425.255.553.2]In many organizations, the number of people needing a full-blown analytic tool compared to reports with limited analytics is anywhere from 1:5 to 1:10; in other words, one user will need a true analytic tool for every five to ten users that consume reports. However, Excel skews this number by allowing for the creation of canned reports against the data while still allowing for a fairly detailed analysis. Therefore, assume that the line between true analytic tools and more general tools is continually blurring.
1 6
B u s i n e s s I n t e l l i g e n c e w i t h M i c r o s o f t O f f i c e P e r f o r m a n c e P o i n t S e r v e r 2 0 0 7Line-of-Business Applications
Line-of-business applications are not business intelligence tools in a true sense. Instead, they’re the applications that allow a business to run its day-to-day operations. However, integrating data from a business intelligence solution into line of business applications can provide line workers with tremendous benefits. Call center employees can immediately see charts or numbers representing all past business from a customer. Online stores can recommend complementary products when a person is making a purchase, based on the customer’s previous purchases and the habits of similar customers. A medical center could use statistics covering a wide range of lab values and a large number of patients to identify whether a patient currently being treated might be at an elevated risk for a certain types of disease. Data input applications can validate data in real time against the known universe of good data. It can also flag potentially bad data at the time of data entry, before it makes its way into the system.
This ability to use the data from a data warehouse provides benefits all the way to the workers on the front lines of dealing with customers or products. These individuals may be totally unaware of the existence of a data warehouse, but they know that they use the numbers shown in the applications to get their job done more efficiently. Such integration between data in Analysis Services and line-of-business applications is provided by such enabling technologies as OLE DB, ADO.NET, XML web services, XMLA, and more. This alphabet soup means one thing: accessing the data and bringing it into client applications is well supported in a variety of ways and in many different application formats. Whether a company is using Windows applications or web applications, the data can easily be integrated into the daily workflow of all users.
Real World Examples
In theory, I’m sure all of this sounds well and good to you. However, there’s nothing like practical applications of business intelligence for proving the value of the technology in real organizations. The following examples are just a few of the customer stories with which the author has first-hand knowledge and explains how business intelligence has enabled companies to run more efficiently and improve processes, save money, uncover problems, or some combination of all three.
Scorecard for Non-Profi t Entity
C h a p t e r 1 : T h e C a s e f o r B u s i n e s s I n t e l l i g e n c e
1 7
Because their cost per patient was fixed, they worked hard to keep occupancy high, but had little actual control over occupancy in most cases. Therefore, nearly their entire focus was on controlling costs. In order for a facility to run smoothly, it had to operate at a profit, for even nonprofit organizations can’t operate at a constant loss; nonprofit simply means any profits are reinvested and not held by the company or given away as dividends.
Medical Non-Profit had facilities across the United States, each with its own unique contracts and circumstances. However, at all centers a few things remained the same: people needed to be fed, the lights had to stay on, rent on the building or land had to be paid, and workers at those facilities had to be paid. There were many other expense categories, such as maintenance, water, office supplies, fuel costs, and more, but the four expenses that dwarfed all others were food, electricity, rent, and salaries. All costs were broken down on a per-patient basis and facilities with lower per-patient costs in each category were deemed better than those with higher costs.
NOTE
Please don’t think this meant that a facility could starve its patients and achieve lower food costs; these were patients quite capable of complaining loudly if they were underfed.
The people running Medical Non-Profit were interested in determining the facilities that ran well and those that didn’t. More than this, they sought to share this information with the facilities themselves without revealing too much information. In this particular area, Medical Non-Profit faced stiff competition, so it was important that the directors of each center not know the money received per patient from federal and state contracts, which was used to help determine profitability. In addition, while the director of each center knew his or her expense per patient, the operators of Medical Non-Profit did not want that information shared with directors of other centers.
Given the desire to rank centers without revealing the exact figures involved, a scorecard seemed to be the perfect answer. A KPI for each expense was established, such as Food Expense, Salary Expense, and so forth, on a per-patient basis. But rather than showing the actual figure, the only thing shown was an indicator: Green for Good, Yellow for Marginal, and Red for Bad. The color of the indicator was based on the expected cost for that item per patient in that facility’s location. Now, each facility could immediately see how they were doing against projections in each expense category.
1 8
B u s i n e s s I n t e l l i g e n c e w i t h M i c r o s o f t O f f i c e P e r f o r m a n c e P o i n t S e r v e r 2 0 0 7ranked in order, and a + sign next to each one could be clicked to display the detailed expense items for each facility. At each facility, the director could see the overall scores for each facility but only expand his or her facility to see the details. This way, a facility director would know where his or her facility stood in relation to others, and could call those doing well to determine what they were doing right and the best practices that might be implemented at his or her facility.
The scorecard used at the time of this project was the first version of the
Microsoft Business Scorecard Manager. This product continues to be enhanced and is in its third generation in PerformancePoint Server. The back end was an Analysis Services 2000 cube built from data from the Navision accounting application among other sources.
Where’s the Time Going?
One organization—which will be referred to as Where’s My Time, Dude?—needed to better analyze the hours being worked and the pay for those hours. This company felt they were getting hit with too much overtime and but were faced with staffing challenges at very inopportune times. Where’s My Time, Dude? had a wealth of information about salaries in their accounting system, which seemed to work well and was up to date. Unfortunately, it was fed by a time-entry system that had been purchased long ago and had fallen into the Not My Job category. No one at Where’s My Time, Dude? would admit to owning the application or really knowing much about it.
The nature of Where’s My Time, Dude?’s business was one of rapid changes. These changes caused departments to sprout up and either change names, merge with other departments, or disappear with amazing speed. Each such change brought about new department and billing codes, of course, and maintaining these was never done quite right, thanks to the black hole of the time-entry system.
Upon first building a warehouse, a lot of data cleansing had to be done, specifically around department codes and mapping those to the codes in the accounting system (which was not a one-to-one match, of course.) When the data was compiled, the Vice President of Operations and her staff were shown the data. Fully 40 percent of the hours were being reported against departments that were closed or to which the employee entering the time did not belong. Needless to say, a task force was created immediately in order to determine how to address issues in the time entry system and to clean up department codes and align them properly with the accounting and payroll system.
C h a p t e r 1 : T h e C a s e f o r B u s i n e s s I n t e l l i g e n c e
1 9
earning more in overtime in a year than her base pay. This raised a red flag but after investigation, the business learned that this was in fact the case for this particular employee. More importantly, they began looking at seasonal adjustments to their staffing and overtime levels and began setting boundaries for when such items became too high or too low.
The technology used for this particular engagement was SQL Server 2000 and ProClarity Analytic Server. Reports were created by a few users in Information Technology and published to the internal PAS site. Department managers were trained in how to view the reports and conduct some of their own analysis on the data.
Tracking Retail Sales
A large retail chain in Europe, the Middle East, and Africa (EMEA) wanted to better track and report on sales, as well as perform complex analysis on what sold well in different areas and which combinations of attributes were included in the most profitable items. Sales needed to be collected daily from each point of sale terminal in each store in the chain. This data amounted to literally millions of records being uploaded from the stores each night and loaded into the warehouse.
Each day, business decision-makers and managers of each product line consume reports that show how each item in their product line sold and where. Inventory can be adjusted according to the demands in various areas or even individual stores. These daily reports are relatively high level, represent a snapshot of the previous day’s activities across the organization, and are used by everyone in the organization, from the CEO on down. Analysts throughout the company can then perform more detailed analysis using analytic tools against a wealth of data, including analysis of products by various attributes.
As an example, a new dress shirt might sell well one season. However, this shirt is available in a variety of different styles, such as with different fabrics, different collars, different buttons, and so forth. All of the shirts sold well, but did a specific combination of attributes sell better than others? If the shirt with mother of pearl buttons and silk fabric outsells all shirts with either cotton fabrics or plastic buttons, this information can be used for both stocking and pricing strategies.
This particular business intelligence solution builds warehouses out of
2 0
B u s i n e s s I n t e l l i g e n c e w i t h M i c r o s o f t O f f i c e P e r f o r m a n c e P o i n t S e r v e r 2 0 0 7Summary
As discussed in this chapter, the business benefits of business intelligence are real and working for many companies worldwide. However, it is important to realize there are different kinds of roles in an organization that can benefit from business intelligence, and those different roles often consume data in different ways. Therefore, there are a variety of tools that provide views of the data in the cubes making up the data warehouse. By properly implementing the appropriate tools for the various organizational roles, the benefits of a business intelligence solution can be realized throughout the organization.
Creating a business intelligence application is not a simple process. An
21
CHAPTER
2
Introducing
PerformancePoint
Server 2007
IN THIS CHAPTER
2 2
B u s i n e s s I n t e l l i g e n c e w i t h M i c r o s o f t O f f i c e P e r f o r m a n c e P o i n t S e r v e r 2 0 0 7P
erformancePoint Server 2007 is a brand new project from Microsoft. However, in reality, it is three products in one, and only one of the products is truly new. PerformancePoint Server 2007 is a tool designed to support the cycle of monitoring the health of the organization, analyzing the organization’s data at a detailed level, and planning for the future so that monitoring can continue as the future slides into the present and then the past.PerformancePoint Server 2007 represents an attempt by Microsoft to bring together tools that provide companies with greatly enhanced business intelligence capabilities. Two of the pillars of PerformancePoint Server provide tools that support different types of users, such as analysts and business decision makers, while the third pillar moves beyond delivering data to the organization to supporting the planning, budgeting, and forecasting efforts of the organization. The budgeting and forecasting data can become part of the process, so that actual performance is compared to the forecasts and so that the health of the business can be monitored. Variances in performance from the plan can be easily analyzed in detail to determine the source of any variances.
What Is PerformancePoint Server 2007?
C h a p t e r 2 : I n t r o d u c i n g P e r f o r m a n c e P o i n t S e r v e r 2 0 0 7
2 3
Monitoring with PerformancePoint Server
PerformancePoint Server 2007 provides monitoring functionality that includes key performance indicators, scorecards, and dashboards. These dashboards are hosted in SharePoint, including either the free Windows SharePoint Services or the definitely not free Microsoft Office SharePoint Server. The monitoring functionality in PerformancePoint Server is the third iteration of technology from Microsoft, replacing Microsoft Office Business Scorecard Manager 2005. Key Performance Indicators, or KPIs, scorecards, and dashboards are covered in detail in Chapters 4 and 5 but are covered from a very high level here.
A rich-client application, Dashboard Designer, is the tool used to create KPIs, scorecards, and dashboards. A KPI is a metric that is tracked by the business to monitor the health of a particular piece of the business. For example, a company might track KPIs for sales, inventory turnover, employee head count, customer satisfaction, market share, employee training, and so forth. Rather than just being numbers, KPIs have the actual value (such as the actual sales), a target (the sales forecast), an indicator (how the actual value compares to the forecast or budget), and a trend that shows whether the KPI is trending up, trending down, or is flat.
Multiple KPIs are placed on a scorecard. A scorecard provides an overview, so in a single glance a person can see how the business or division is performing. The indicators are often graphical images such as colored circles, smiley faces, arrows, or the like, so that users can quickly grasp the meaning without having to concentrate on the numbers themselves. Aside from showing just the KPIs, a scorecard can show scores. A KPI has an actual and a target, and the better the actual compared to the target, the higher the score in most cases. This means that KPIs can be given scores and that these scores can roll up to higher level scores. This also means that different products, locations, or employees can be scored against each other for the purposes of ranking. This is no different from taking the range of grades over a semester for an entire class and ranking students based on their averages, but it provides an impartial way to rank what may be very different products or locations.
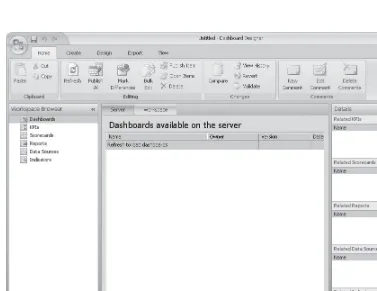
Dashboards are containers for one or more scorecards, possibly mixed with reports or other items. Dashboards may have filters that users can change to update one or more of the items on the page. For example, a filter for products would allow users to change from one product to another as well as update a scorecard and the two reports on the dashboard. Figure 2-1 shows an example of a dashboard hosting a scorecard and several reports, both as charts and grids.
2 4
B u s i n e s s I n t e l l i g e n c e w i t h M i c r o s o f t O f f i c e P e r f o r m a n c e P o i n t S e r v e r 2 0 0 7For example, imagine that a business was looking at the salary expense for a particular location and noticed a particularly low score, meaning that salaries were much higher than expected. A useful feature would allow the user to click on that KPI and then launch the company’s time and attendance system, with the location and the time period being viewed automatically passed as parameters. This type of integration may be possible via customizations but it is not a functionality that is available out of the box in this first version of PerformancePoint Server.
The monitoring piece uses Dashboard Designer and works using a disconnected model. This is similar to how Visual Studio 2005 is used to create web applications. The developer can work locally on a development machine, even though the
application will eventually run on a server. Visual Studio 2005 allows developers to create web applications on a development machine and test the application fully before deploying it to the server. Similarly, Dashboard Designer allows developers to work on the files on a local machine and preview them using Internet Information
C h a p t e r 2 : I n t r o d u c i n g P e r f o r m a n c e P o i n t S e r v e r 2 0 0 7
2 5
Server before deploying the dashboard to a server running SharePoint. This model will be examined in Chapter 5.
Analysis with PerformancePoint Server
In mid-2006, Microsoft purchased ProClarity Corporation. ProClarity was the creator of the most popular third-party analytics tool for Analysis Services (the most popular tool overall was Excel, but its analytics capabilities fell far short of ProClarity’s.) ProClarity actually had several products, the primary two of which were the ProClarity Desktop Professional and the ProClarity Analytics Server. The Desktop Professional application was a Windows application while the Analytics Server was a web application that included a thin client analytics tool that mimicked almost all features of the Desktop Professional.
Soon after ProClarity’s acquisition by Microsoft, PerformancePoint Server was announced as the answer to the question for what would happen to the ProClarity Products. PerformancePoint Server was presented as the blending of Business Scorecard Manager and ProClarity into one product, with the addition of a planning module.
In reality, the integration of the powerful analytics from the ProClarity platform did not happen as quickly as expected. The analytic features in PerformancePoint Server 2005 are good at what they do, but they are limited compared to a true analytic application. The analysis features that made it into PerformancePoint Server are wrapped up primarily in two reports: the Analytic Chart and the Analytic Grid. There are other ways of getting additional analysis but they rely on the Office Web Components, which require both an installation of components on the client machine and a client license. The Analytic Chart and Analytic Grid are very good at what they do, allowing users to drill down to explore additional data, as well as use filters to change some of the data, but they are basically limited to this functionality. End users cannot change the dimensions being examined in a report (for example, they can’t replace products with customers on the rows). The Analytic Chart and Analytic Grid are mentioned in Chapter 5 and covered in more detail in Chapter 6. Figure 2-2 shows an example of the Analytic Chart and Analytic Grid reports.
2 6
B u s i n e s s I n t e l l i g e n c e w i t h M i c r o s o f t O f f i c e P e r f o r m a n c e P o i n t S e r v e r 2 0 0 7The ProClarity tools represent true analytics applications, offering basically unlimited abilities to work with the data in Analysis Services cubes. The rich graphical capabilities of the ProClarity tools are unmatched by any other tool. The capabilities of Excel 2007 are arguably better at dealing with grid data, but the charts in ProClarity are extremely powerful and flexible.
A complete discussion of the ProClarity applications could be a book unto itself, but I discuss the basics of performing analysis with ProClarity in Chapter 6. Figure 2-3 shows an example of some of the graphical capabilities of ProClarity.
Planning with PerformancePoint Server
The planning functionality of PerformancePoint Server is completely new functionality from Microsoft. This module was developed from the ground up to meet the needs of business in performing their planning, budgeting, and forecasting.
C h a p t e r 2 : I n t r o d u c i n g P e r f o r m a n c e P o i n t S e r v e r 2 0 0 7
2 7
While many examples mentioned in any BI book are financial in nature, monitoring and analytics are not necessarily focused on financials. The planning module, on the other hand, does focus on financials. As such, the primary tool for end users to work with the planning application is Excel. Another tool, called the Planning Business Modeler, will be used by some in the organization to create financial models representing the ways the organization handles its financials. Once these models are created, users will be able to use Excel to add and update data for forecasts.
One of the primary reasons for the creation of the planning module was to ease the burden of creating strategic plans, budgets, and sales forecasts. The planning module allows companies to import data from multiple, disparate systems, and consolidate that data in a central storage location. Models can then be built which encapsulate business logic and processes. Security plays a big part in the planning module, with users only allowed to see data they are granted permission to see.
2 8
B u s i n e s s I n t e l l i g e n c e w i t h M i c r o s o f t O f f i c e P e r f o r m a n c e P o i n t S e r v e r 2 0 0 7All changes are tracked automatically in order to comply with laws requiring audit trails for financial information. Having a central store for data and business rules means that everyone in the business has a single source for data, which ensures accuracy and consistency. This is a great example of the “single version of the truth,” which is a goal of all business intelligence. Figure 2-4 shows an example of the planning module in use.
The planning module also includes a workflow capability, so that changes made by users can go through an approval process before they are committed to the forecast or budget. This ensures that users can’t make changes part way through the year that are designed to make them look better at the end of year. The planning module is covered in detail in Chapter 7.
C h a p t e r 2 : I n t r o d u c i n g P e r f o r m a n c e P o i n t S e r v e r 2 0 0 7
2 9
Summary
PerformancePoint Server includes three primary applications: monitoring, analysis, and planning. Monitoring is a way of viewing the primary drivers of the business in a way that immediately communicates the health of the organization. This is accomplished through scorecards, which are a means for viewing data at a high level and getting an immediate sense for the strength or weakness of the various metrics.
The analysis functionality is covered by reports in PerformancePoint Server and analytics tools in the ProClarity applications. This use of multiple applications to achieve true analytics is necessary in this first release of PerformancePoint Server, but should be gone in future versions.
The planning module is designed to help organizations speed the process of budgeting and forecasting, while enforcing business rules across the enterprise. Security is an important component of the planning module, tracking all changes and ensuring that users only see data to that they have permissions to.
31
CHAPTER
3
Data Warehousing and
Business Intelligence
IN THIS CHAPTER
3 2
B u s i n e s s I n t e l l i g e n c e w i t h M i c r o s o f t O f f i c e P e r f o r m a n c e P o i n t S e r v e r 2 0 0 7B
usiness intelligence covers a range of technologies, and in this book business intelligence is a generic term covering the data warehouse as well as the tools and applications used to view the data from the warehouse. While the major focus of this book is on PerformancePoint Server and ProClarity, which allows users to consume data, there would be nothing to view without first building a data warehouse or data mart.Before diving into the process of building the data warehouse, it’s important to define the difference between a data warehouse and a data mart. The difference between the two is one of scope: marts cover individual business areas, while warehouses cover the entire business. Data marts focus on a particular business function, such as finance, manufacturing, sales and marketing, and so forth. There is a raging, often religious debate about the proper method of building a warehouse: whether to build a number of marts and then roll them up into a warehouse, or build a warehouse and then split out data marts as necessary. This debate is beyond the scope of this book, and the good news is that the decision is unimportant for the purposes of this book.
The process of building a data mart is identical to the process of building a data warehouse; only the scope is different. Therefore, while most companies have one or more marts and not a true warehouse, this book will use the term “data warehouse” as a generic term to cover both warehouses and marts. Because the process is the same for building both marts and warehouses, this chapter will describe that process and cover the aspects of the business intelligence process that build the foundation for delivering value to the organization.
The process of building a warehouse involves a number of steps, each of which contains an abundance of details. While entire books are written on the various aspects, this chapter will seek to distill the most important parts of the warehouse building process into an overview that will explain the importance of the decisions made here and how they can affect the delivery of business intelligence information through PerformancePoint Server and ProClarity. It is important to realize that building a data warehouse is not an easy task and many decisions must be made, some of which involve tradeoffs.
C h a p t e r 3 : D a t a W a r e h o u s i n g a n d B u s i n e s s I n t e l l i g e n c e
3 3
Designing to Solve the Problem
An old joke in economics says that if you can teach a parrot to say, “Supply and demand,” you’ve created an economist. The fact that economists consider this joke even remotely funny helps explain why economics is called “The Dismal Science,” but it strikes close to home; if you could teach that parrot to say, “Facts and
dimensions,” you’d have a data warehousing guru.
Perhaps simply saying, “Facts and dimensions,” isn’t enough to make someone a data warehousing guru, but those two words flow through everything that is done in the data warehousing arena. Data warehousing is about solving business problems, so the first step is identifying the problem to be solved. At the very beginning, it’s important to determine the business problem to be solved and the information it will take to provide a solution. In response to any problem, the question should be, “What needs to be seen, and how does it need to be analyzed?”
The what part of the question is usually a number of some sort. If there are quality control issues, what needs to be seen are the number of items produced, the defect rate, the cost to manufacture those items, and more. These numbers are called either
facts or measures (the terms are normally used interchangeably.) Therefore, what
ProClarity
PerformancePoint Excel
Custom Applications Users access the data in the
warehouse One or more cubes
are built using Analysis Services ETL process is performed,
pushing data into a relational data warehouse Data sources
are identified Business decides
what problem to address
Cube Integration Services Relational Data Warehouse SQL Oracle Excel XML