
SHORT REPORT
Innate immune defects in HIV permissive
cell lines
Antonio Rausell
1*, Miguel Muñoz
2, Raquel Martinez
2, Thierry Roger
3, Amalio Telenti
4and Angela Ciuffi
2Abstract
Background: Primary CD4+ T cells and cell lines differ in their permissiveness to HIV infection. Impaired innate immunity may contribute to this different phenotype.
Findings: We used transcriptome profiling of 1503 innate immunity genes in primary CD4+ T cells and permissive cell lines. Two clusters of differentially expressed genes were identified: a set of 249 genes that were highly expressed in primary cells and minimally expressed in cell lines and a set of 110 genes with the opposite pattern. Specific to HIV, HEK293T, Jurkat, SupT1 and CEM cell lines displayed unique patterns of downregulation of genes involved in viral sensing and restriction. Activation of primary CD4+ T cells resulted in reversal of the pattern of expression of those sets of innate immunity genes. Functional analysis of prototypical innate immunity pathways of permissive cell lines confirmed impaired responses identified in transcriptome analyses.
Conclusion: Integrity of innate immunity genes and pathways needs to be considered in designing gain/loss func-tional genomic screens of viral infection.
Keywords: Innate immunity, HIV, Cell lines, TCR activation, RNA-Seq
© 2016 The Author(s). This article is distributed under the terms of the Creative Commons Attribution 4.0 International License (http://creativecommons.org/licenses/by/4.0/), which permits unrestricted use, distribution, and reproduction in any medium, provided you give appropriate credit to the original author(s) and the source, provide a link to the Creative Commons license, and indicate if changes were made. The Creative Commons Public Domain Dedication waiver (http://creativecommons.org/ publicdomain/zero/1.0/) applies to the data made available in this article, unless otherwise stated.
Background
The success of viral replication depends on the ability of a virus to exploit host cell components and evade host cell defense and is thus affected by the specific cellular environment [1–3]. In the past decades, studies on HIV have often used established T cell lines to investigate the molecular mechanisms of viral replication and virus-host interactions because of ease of infection. In contrast, rest-ing primary CD4+ T cells are difficult to infect and need to be activated through T-Cell Receptor (TCR) stimulation in order to enhance their susceptibility to HIV infection [4, 5]. Despite stimulation, infection efficiency of primary cells rarely reaches the level observed in T cell lines, sug-gesting that the cellular environment is different. Many transformed cell lines show global or narrow defects in the Interferon (IFN) response, including deficits in sign-aling (eg., JAK1, [6, 7]) and in expression of transcrip-tion factors (eg., ISGF3 and STAT1, [8–12]). A reduced
responsiveness to IFN due to defects in the type I IFN pathway is also a common hallmark among malignant cells [13]. There is ample evidence of innate immunity defects in cell lines used in HIV research. For example, HEK293T do not express detectable levels of STING [14] or TLRs [15]. A link between antiviral defense and cell prolif-eration has been proposed for HEK293T and HeLa cells. Here, immune defects in the cGas-STING pathway may be explained by the constitutive expression of viral onco-proteins that interfere with the innate immune response while at the same time supporting cell transformation [16]. Although still responsive to IFN-α in terms of general ISG expression, Jurkat cells are unable to induce the expression of specific antiviral genes [17]. SupT1 and other cell lines exhibit a diversity of patterns in response to interferon [18]. Limited response to IFN-α and high permissiveness to HIV infection led to the identification of MX2 in CEM cells [19]. Thus, lack of integrity of the IFN pathway or the failure to induce antiviral factors is thought to underlie the ease of propagation of numerous viruses in cell lines [17].
We aimed at characterizing the transcriptional land-scape of innate immunity genes in cell lines used in HIV
Open Access
*Correspondence: [email protected]
1 Clinical Bioinformatics lab, Imagine Institute, Paris Descartes University - Sorbonne Paris Cité, 75015 Paris, France
Page 2 of 10 Rausell et al. Retrovirology (2016) 13:43
research, to contrast them with primary CD4+ T cells, and to validate some of the defects in functional assays. The emerging picture is that of a diversity of patterns of downregulation that support the concept of innate immunity defects underlying the high permissiveness of commonly used cell lines to HIV.
Findings
Innate immunity gene expression in primary cells and in HIV‑permissive cell lines
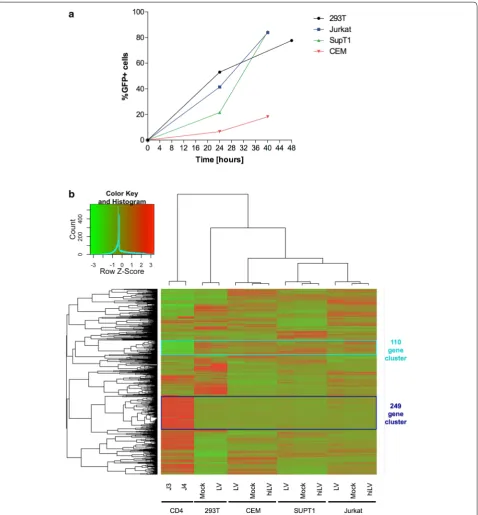
To investigate the impact of innate immunity on HIV permissiveness, we analyzed the transcriptional state of 1503 innate immunity genes (previously defined in [20]; Additional file 1: Table S1) by whole transcriptome pro-filing of resting primary CD4+ T lymphocytes isolated from two different healthy blood donors on one hand, and the panel of four human cell lines on the other hand: 3 lymphoblastic T cell lines—SupT1, Jurkat and CEM- and the human embryonic kidney (HEK) 293T cell line (Methods). For cell lines, transcriptome of uninfected cells as well as cells infected with a competent or heat-inactivated VSV-G pseudotyped HIV vector were inves-tigated. Of these, expression of 1473 innate immunity genes was detected in at least one sample and further analyzed. Cluster analysis of relative expression values grouped cell types according to their co-expression pro-files in innate immunity genes (Fig. 1), recapitulating the principal component analysis on the whole transcrip-tome and in line with previous studies [21] showing that cell identity was the major determinant compared to the influence of HIV infection (Additional file 2: Figure S1).
To identify innate immunity genes associated with HIV permissiveness at the cellular level, we focused on genes that were differentially expressed in resting CD4+ T cells compared to cell lines. Two clusters corresponding to such criteria were identified. First, a cluster of 249 innate immu-nity genes that were highly expressed in primary cells and lowly expressed or absent in cell lines (Fig. 1, dark blue cluster, 204 of them with a fold change higher than 2, Ben-jamini–Hochberg adjusted p value <0.01, Methods). This set included Toll-like receptors (TLRs), NOD-like recep-tors (NLRs), sialic acid binding Ig-like lectin (SIGLEC) and C-type lectin (CLEC) family members, interleukins and their receptors (ILs and ILRs), chemokine ligands and receptors (CCLs, CXCLs and CCRs), caspases, comple-ment components, MAP-kinases, transcription factors and regulators (Interferon -IFN- regulatory factors -IRFs, JAK/ STATs, FOS and JUN) among others (Additional file 3: Table S2). The second cluster included 110 innate immu-nity genes (Fig. 1, cyan cluster, 101 genes with a fold change higher than 2, Benjamini–Hochberg adjusted p value <0.01) with low expression in resting CD4+ T cells and high expression in cell lines. This cluster contained genes
acting as suppressors of the innate immune response (e.g. TYRO3, BIRC5), inhibitors of transcription factors (NKI-RAS2 -inhibitor of NFKB- and PIAS4 -inhibitor of acti-vated STAT4) and transcriptional repressors (HES4, CSDA, RCOR1) (Additional file 3: Table S2). Of note, excluding samples infected with HIV or exposed to heat-inactivated HIV from the analysis led to a highly similar clustering of genes (Spearman correlation of gene distances between the two clusterings of 0.96, p value <2.2e−16, Additional file 4: Figure S2), reproducing the same two clusters.
Effect of CD4+ T cell activation on relevant innate immunity genes
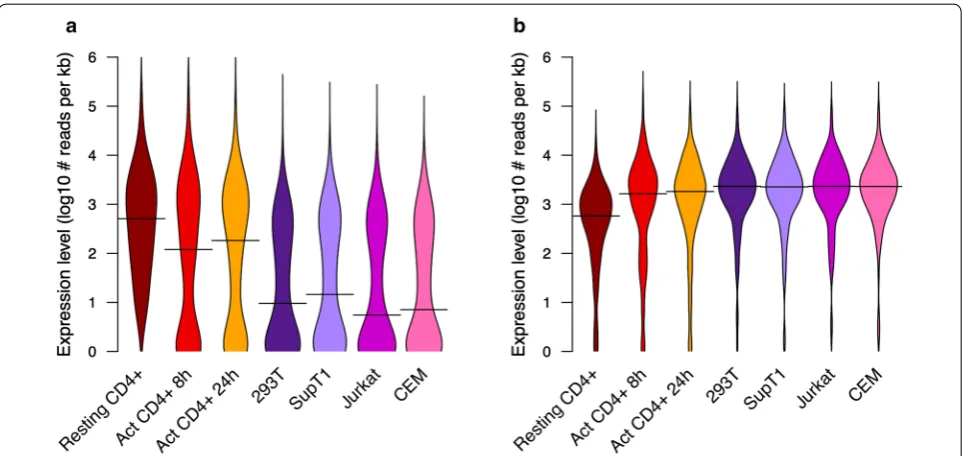
We then inspected the impact of cell activation on the 249- and 110-gene clusters. Activated CD4+ T cells displayed an intermediate phenotype (Additional files 5, 6: Figures S3, S4). For the 249-gene cluster, median expression levels at 8 and 24 h (m = 2.08 and 2.26 log10 reads per kilobase, respectively) of TCR activation were between those of primary resting CD4+ T cells (m = 2.71 log10 reads per kilobase) and cell lines (m = 0.74–1.16 log10 reads per kilobase; Fig. 2a). For the 110-gene cluster, median expression levels at 8 and 24 h (m = 3.21 and 3.26 log10 reads per kilobase, respectively) of TCR activation were closer to those of cell lines (m = 3.36–3.37 log10 reads per kilobase; Fig. 2b) than to primary resting CD4+ T cells (m = 2.76 log10 reads per kilobase) (Fig. 2b). The distributions of the expression levels of activated CD4+ T cells and cell lines were in all cases significantly different from those of the resting CD4+ T cells (Wilcoxon rank sum test, Bonferroni p-adjusted <1E−3).
Transcriptional and functional defects in innate immunity pathways in cell lines
Page 4 of 10 Rausell et al. Retrovirology (2016) 13:43
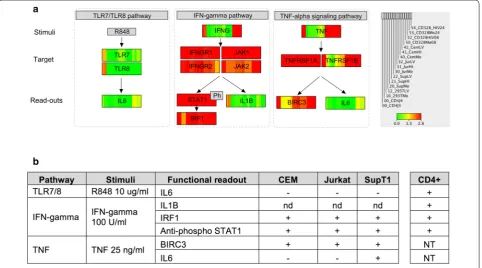
(Additional file 8: Figure S6) and the TNF-alpha signal-ing pathway (Additional file 9: Figure S7). Here, genes involved in the signaling cascade appeared well expressed across cell types. However, transcriptional differences are observed for genes triggering the signaling (IFN-gamma, TNF-alpha and TNFRSF18) and effector genes (e.g. IFN-stimulated genes in the case of IFN-gamma pathway and IL6 or BIRC3 in the TNF-alpha pathway).
We used functional assays to evaluate the consequences of diminished expression of genes involved in those selected pathways applying specific stimuli and record-ing the correspondrecord-ing read-outs, i.e. expression of spe-cific effectors or activation of STAT1 (Fig. 3; Additional file 10: Table S3). Consistent with the absence or reduced expression of TLR7 and TLR8 in permissive cell lines (Fig. 3a), stimulation of the TLR pathway with R848 failed to increase IL6 mRNA as measured by RT-qPCR, and in contrast to resting CD4+ T cells. As expected from the transcriptional integrity of the core STAT-dependent signaling of the IFN-gamma pathway, the addition of IFN-gamma to both resting CD4+ T cells and cell lines resulted in the successful phosphorylation of STAT1 (Additional file 11: Figure S8) and increased expression of IRF1 mRNA (Fig. 3b; Additional file 10: Table S3). IFN-gamma stimulation failed to result in detectable expres-sion of IL1B mRNA in cell lines, consistent with low
expression levels of key components in this cascade (e.g. IRF4; Additional file 8: Figure S6). In the case of the TNF-alpha signaling pathway, the integrity of the signaling cas-cade in cell lines at the transcriptional level was coherent with the detection of BIRC3 by RT-qPCR upon addition of TNF-alpha (Fig. 3b; Additional file 10: Table S3). How-ever, only SupT1 cells displayed an increase of IL6.
Expression of genes involved in HIV sensing and restriction Finally, we assessed the transcriptional pattern for paradigmatic genes involved in antiretroviral defense (APOBEC3G, TRIM5, BST2, MX2, GBP5, and SAMHD1) and signaling (JAK, STAT1, IFI16 and STING/TMEM173) relevant to HIV biology (Fig. 4). Primary CD4+ T cells transcribed all those genes (expression levels ranging from 2.64 to 3.94 log10 reads per kilobase). In contrast, a diversity of patterns of reduced gene expression were observed across the cell lines: 293T (downregulation of STING, JAK3, IFI16, APOBEC3G, GBP5, BST2, MX2, and to a lesser extent other genes), SupT1 (downregula-tion of JAK3, APOBEC3G, GBP5, BST2, SAMHD1, and to a lesser extent other genes), Jurkat (downregulation of GBP5, SAMHD1, MX2, and to a lesser extent other genes), and CEM (downregulation of SAMHD1 and to a lesser extent other genes). Globally, transcriptional data parallels protein expression levels and function across
Fig. 2 Activation of primary CD4+ T cells produces an intermediate expression phenotype in clusters of innate immunity genes differentiating resting CD4+ T cells from permissive cell lines. Distribution of expression levels of the 249 (a) and 110 (b) gene clusters represented as violin plots. Seven distributions are shown summarizing the average expression values in resting CD4+ T cells (dark red), activated CD4+ T cells at 8 h (red) and 24 h (orange) after TCR activation, and four human laboratory cell lines HEK293T (pink), Jurkat (light violet), SupT1 (magenta) and CEM (dark violet).
Lines within the plots represent the median of such distributions. All distributions are significantly different from the resting CD4+ T cells in both
[image:4.595.58.540.87.315.2]cell lines (www.proteinatlas.org and [19, 22–28]). Upon activation of primary CD4+ T cells, we observed a strong down-regulation of MX2 and to a lesser extent TRIM5. These results suggest a pattern of focal defects in cell lines and in specific pathways that is consistent with the observations from the global analysis of innate immunity genes and pathways presented in the sections above.
Conclusion
The innate immune response differs according to the cell type or cell state, such as activated vs resting CD4+ T cells, and this may in turn affect the outcome of viral infection [5, 29, 30]. Activated CD4+ T cells are more permissive to HIV infection in part because of reduced innate immune responses. This favors productive infec-tion and virus-induced cell death by apoptosis. In con-trast, resting CD4+ T cells are more resistant to HIV-1 infection, thanks to expression of innate immune defenses (SAMHD1-mediated impaired reverse transcription, IFI16-mediated viral nucleic acid sensing and signaling), leading to abortive infection and to cell death induced by
pyroptosis (although this is not observed in vitro upon cell-free virus infection). Changes in expression of innate immunity signaling and effector molecules impact the model of cell death induced by HIV-1 infection, whether triggered by apoptosis or pyroptosis [29]. Therefore, the cell lines used to investigate viral infection may only par-tially reflect physiological innate immune responses.
Overall, our results show that permissive laboratory cell lines have transcriptional and functional defects in components of key innate immunity signaling path-ways resulting in reduced activation or absence of effec-tor gene expression upon specific stimulation. Such defects may contribute to the success of viral infection in cell lines compared to primary cells. This study sup-ports the call for caution when investigating the interac-tion between viral and innate immunity factors using cell lines. Furthermore, it provides criteria for the choice of gain or loss of function screenings of viral infection; i.e., in the absence of expression of a target innate immunity factor, the best screen may be over-expression rather than knockdown.
[image:5.595.59.542.89.357.2]Page 6 of 10 Rausell et al. Retrovirology (2016) 13:43
Methods
Cell samples
Primary CD4+ T cells
Peripheral Blood Mononuclear Cells (PBMCs) from two different healthy blood donors were purified by Ficoll gradient separation followed by primary CD4+ T cell isolation using negative selection and magnetic separa-tion (human CD4+ T Cell Isolation kit II; Miltenyi Bio-tec) as previously described [21] and directly used for total RNA extraction.
Activated CD4+ T cells
Activated CD4+ T cell data were from Mohammadi et al [21]. Briefly, primary CD4+ T cells isolated from a healthy blood donor were activated using CD3/CD28 co-stimulation in presence of IL-2 (mimicking T-Cell
Receptor (TCR) stimulation). For this, CD3 anti-bodies (10 μg) were plated in 1 ml PBS per well of a 6-well plate and incubated for 1–2 h at 37 °C. Wells were washed once with 3 ml of PBS and filled with 106 cells/
ml of primary CD4+ T cells supplemented with 1 μg/ml anti-CD28 antibodies in R-10 culture medium contain-ing 100 U/ml human recombinant IL-2 (R&D Systems). Three days post-stimulation, activated CD4+ T cells (106 cells) were infected or not with 5 μg p24 equivalent
of HIVeGFP/VSV-G particles in presence of 2.5 μg/ml polybrene and in 300 μl final volume by spinoculation (1500 g, 25 °c, 2 h). Cells were left to return to a rest-ing state by co-culture on a feeder cell layer for 10 weeks. Mock or infected resting CD4+ T cells were re-activated by TCR stimulation for 8 and 24 h before total RNA extraction.
Fig. 4 Heatmap of expression values of paradigmatic genes involved in antiretroviral defense and signaling relevant to HIV biology. The figure shows the expression values of antiretroviral genes (APOBEC3G, TRIM5, BST2, MX2, GBP5, and SAMHD1) and signaling genes (JAK, STAT1, IFI16 and
STING/TMEM173) in RNA-seq libraries of resting CD4+ T cells, cell lines HEK293T, Jurkat, SupT1 and CEM -mock (Mock), heat-inactivated (hiLV) and HIV-infected (LV)- and activated CD4+ T cells at 8 and 24 h after TCR activation (Methods). The color-code scale in the inset represents the expression levels (log10 transformation of the number of library size-normalized reads per kilobase of exonic sequence), ranging from green (low) to red (high) expression. Complete hierarchical clustering of genes was based on Pearson correlation of the expression levels. Complete hierarchical clustering of samples was kept as assessed in Additional file 6: Figure S4. JAK1, JAK2, TMEM173 and GBP5 had a fold change higher than 2 between resting CD4+
[image:6.595.61.538.84.415.2]Cell lines
Three T lymphoblastic cell lines, SupT1, Jurkat and CEM cells were cultured in RPMI 1640 (Invitrogen) supple-mented with 10 % FCS and 50 μg/ml gentamicin (R-10 culture medium). Human embryonic kidney (HEK) 293T cells were cultured in Dulbecco’s Modified Eagle Medium (DMEM; Invitrogen) supplemented with 10 % heat-inac-tivated fetal calf serum (FCS) and 50 μg/ml gentamicin (D-10 culture medium).
Cell lines were infected or not by HIVeGFP/VSV-G for 24 h before total RNA extraction. Briefly HEK293T cells (200,000 cells) were plated in 12-well plates in 2 ml culture medium and let adhere over night before infec-tion by spinoculainfec-tion (1500 g, 25 °C, 3 h) with 1 μg p24 equivalent of HIVeGFP/VSV-G particles in presence of 20 μg/ml polybrene. SupT1, Jurkat and CEM T cell lines (106 cells) were infected with 3 μg p24 equivalent
of HIVeGFP/VSV-G particles in presence of 5 μg/ml polybrene and in 400 μl final volume by spinoculation (1500 g, 25 °c, 2 h). As controls, mock infection as well as infection using HIVeGFP/VSV-G heat-inactivated at 56 °C for 60 min were performed in parallel.
HIV‑based vector production
HEK293T cells were co-transfected with 15 μg pNL4-3ΔEnv-GFP (NIH AIDS Research and Reference Reagent program, Cat. #11100; [31]) and 5 μg pMD.G [32], using the calcium phosphate method (Invitrogen) to generate HIVeGFP/VSV-G particles as described previously [3]. HIV titer was measured by p24 ELISA (Abbott).
RNA seq and bioinformatic analyses
Cell lines infected with HIV-based vector, or mock infected, were collected for RNA extraction (Illustra RNAspin mini isolation kit; GE Healthcare) and subse-quent mRNA-Seq transcriptome analysis as described previously [21]. mRNA-Seq library preparation was done with TruSeq RNA sample prep kit (Illumina) start-ing with capture of polyA-containstart-ing transcripts, fol-lowed by cluster generation (TruSeq cluster generation kit, Illumina) and high-throughput sequencing on Illu-mina HiSeq2000 at the Genomics Technology Facility, University of Lausanne. Single read 100 base pairs were performed in all libraries except for primary CD4+ T cells (samples CD4J3 and CD4J4) that were paired-end 100 base pairs. Sequencing data were bioinformatically analyzed as if they were end. The 100 bp single-end reads were trimmed and filtered before alignment as described in [21]. RNA-Seq data for activated cells (TCR-stimulated for 8 and 24 h) were from Mohammadi et al. (PLoS Pathogens 2014). Filtered reads were aligned to the human reference genome with RUM aligner (version v2.0.4; [33]) using the Ensembl gene GRCh37 release 70
annotation file concatenated to the HIV vector sequence used for infection. The number of reads per gene was quantified with HTSeq-count v.0.6.1 [34] with parameters mode = union and type = exon. We obtained an average library size of 77,999,650 uniquely mapped reads. When indicated in downstream analysis, log-transformation of gene expression values was performed as the log10 of the number of library size-normalized reads per kilo-base of exonic sequence. A pseudo-count of 1 was added prior to the log10 transformation to avoid NA’s: log10(R PKM*77999650/1,000,000+1); RPKM: Reads per Kilobase per Million mapped Reads. Variance stabilization trans-formation was performed with R package DESeq [35] with parameters method “blind” for the computation of the empirical dispersion and fitType = “local” for fitting a dispersion-mean relation. The per-gene raw read-counts matrix and the RPKM matrix are provided as Addi-tional files 12 and 13: Tables S4 and S5, respectively (see also Additional file 14: Table S6). Differential expression analysis between primary cells and cell lines used DESeq2 package [36]. An R script with all statistical analyses per-formed necessary to reproduce results and figures is pro-vided as Additional file 15: File S1. Versions of R-packages used are detailed in Additional file 16: File S2.
Perimeter of innate immunity genes
A representative list of 1503 human innate immunity genes compiled as described in [20] was used (Addi-tional file 1: Table S1). The list represents the union of four resources: (1) genes annotated with the term “innate immunity response” (GO:0045087) in the Gene Ontol-ogy project (http://www.geneontolOntol-ogy.org/) [37]; (2) innate immunity genes manually annotated in the Innat-eDB database (http://www.innatedb.ca) [38]; (3) IFN-stimulated genes from the ISG database [39] identified through expression analyses, and (4) a list of IFN-stim-ulated genes used for extensive functional analyses in the context of viral infection, including HIV [40].1473 of the 1503 innate immunity genes were found expressed in at least one of the resting CD4+ T cell samples or labora-tory cell lines analyzed.
Functional analyses
Functional analysis of innate immunity pathway
SupT1, Jurkat and CEM T cells lines (106 cells) were seeded
Page 8 of 10 Rausell et al. Retrovirology (2016) 13:43
(Illustra RNAspin mini isolation kit; GE Healthcare) and gene expression analysis by RT-qPCR, or for cell lysis and immunoblot analysis. Primary resting CD4+ T cells (106
cells) isolated from two healthy blood donors were tested similarly in R-10 culture medium only (negative control), in presence of 10 μg/ml R848, 100 and 1000 U/ml IFN-γ, or TCR stimulation (anti-CD3/anti-CD28/IL2) for 24 h (Additional files 17 and 18: File S3 and S4).
Gene expression analysis
RNA (200 ng) was reverse transcribed using High-Capac-ity cDNA Reverse Transcription (Life Technologies) according to manufacturer’s instructions in a total volume of 20 μl. Eight genes representative of the selective path-ways were assessed in duplicate by qPCR using 2 μl cDNA, and commercially available Gene Expression Assays with FAM-MGB probes (Applied Biosystems) following manufacturer’s recommendations: IL1B (Hs01555410_ m1), IRF1 (Hs00971960_m1), IFNB1 (Hs01077958_s1), IL12B (Hs01011518_m1), IL6 (Hs00985639_m1), CASP1 (Hs00236158_m1), IL18 (Hs01038788_m1) and BIRC3 (Hs00985031_g1). PIGS mRNA with a VIC-MGB probe (Hs00264209_m1) was used as endogenous control. qPCR was carried out in a StepOnePlus (Applied Biosystems) using the following cycling conditions: 2′ at 50 °C, 10′ at 95 °C, 40 cycles of 15″ at 95 °C and 1’ at 60 °C. Calcula-tions were ΔΔCT = (CT gene − CT PIGS)compound − (CT
gene – CT PIGS)mock. Log2 fold change of RT-qPCR data
of compound over mock treated samples corresponds to the −ΔΔCT.
Immunoblot analysis
Cells (106) were lysed in RIPA buffer (50 mM Tris-HCl
[pH 8.0], 150 mM NaCl, 2 mM EDTA, 1 % NP-40, 0.1 % SDS, 0.5 % sodium deoxycholate) supplemented with protease inhibitors (Complete Mini; Roche) and phos-phatase inhibitors (PhosStop; Roche) for 45′ at 4 °C. Cell lysates were centrifuged and clean supernatants were fur-ther used for protein quantification (BCA Protein Assay kit; Pierce) following manufacturer’s instructions. Whole cell lysates (10 μg total proteins) were separated by SDS-polyacrylamide gel electrophoresis and transferred to a nitrocellulose membrane. Total phospho-Stat1 (Mouse anti-P-Y701 Stat1, 1:1000, #612132, BD Biosciences) and Stat1 (Rabbit anti-Stat1 antibody, 1:1000, #9172, Pri-mary Cell Signaling Technology) were detected using standard procedures with Tris-Buffered Saline (TBS)-0.2 % Tween-5 % BSA and PBS-(TBS)-0.2 % Tween-5 % milk as blocking buffers for Phospho-Stat1 and Stat1 respec-tively. Secondary antibodies were rabbit anti-mouse-HRP (1:5000, #P0260, DAKO) and swine anti-rabbit-HRP (1:1000, #P02117, DAKO) respectively. Membrane strip-ping was performed according to Blot Restore Membrane
Rejuvination kit (Millipore) followed by tubulin detection (Mouse anti-tubulin, 1:10,000, #T5168, Sigma). Detec-tion was finalized using ECL chemiluminescence detec-tion (LiteAblot; Euroclone).
Additional files
Additional file 1: Table S1. List of 1503 innate immunity genes used in this study.
Additional file 2: Figure S1. Principal component analysis of RNA-Seq libraries. The figure shows the first two principal axes of the whole transcriptome Principal Component Analysis (PCA) analysis of resting CD4+ T cells (dark red) from two donors and four human laboratory cell lines HEK293T (pink), Jurkat (light violet), SupT1 (magenta) and CEM (dark violet). Cell lines were evaluated in 3 conditions: uninfected mock (circles), infected with a heat-inactivated HIV vector (squares) and HIV-infected (triangles). The percentage of variance explained by each axis is indicated. PCA was performed on the variance-stabilized transformation of read counts as described in Methods. The first principal axis (PCA1) of the PCA of the RNA-Seq libraries separated samples according to their permis-siveness to HIV infection, from primary resting CD4+ T cells to permissive cell lines. The second principal axis distinguished lymphoblastic versus non-lymphoblastic cell lineages (PC2). Although HIV infection is known to modify the cellular transcriptome [3] it does not appear as a main factor of the distribution on the PCA space. Indeed, libraries of the same cell line, either in infected or uninfected conditions, clustered together, showing that main transcriptional differences are driven by cell type and not by infection state consistent with previous studies [21].
Additional file 3: Table S2. Description of the genes in the 249 and 110 clusters. A. List of 249 innate immunity genes that were had high expression in primary cells and low or absent expression in cell lines. B. List of 110 innate immunity genes that with low expression in resting CD4+ T cells and high expression in cell lines. The DESeq2 results of the differential expression analysis between primary CD4+ T cells and cell lines are indicated.
Additional file 4: Figure S2. Heatmap of expression values of innate immunity genes in resting CD4+ T cells, and laboratory cell lines in a uninfected state. The figure shows the expression values of 1473 innate immunity genes in the samples shown in Figure 1 excluding samples heat-inactivated (HI) and HIV-infected (HIV). Complete hierarchical clustering of genes and cell samples was based on Pearson correlation of variance-stabilized read counts (Methods). Color scale indicated in the legend corresponds to z-scores of RPKM distributions per gene, ranging from green (low) to red (high) expression. The genes belonging to the 249 genes and 110 genes clusters detected in Figure 1 are indicated in the left side of the heatmap as stripes colored in dark blue and cyan respectively.
Additional file 5: Figure S3. Principal component analysis of RNA-Seq libraries including activated CD4+ T cells. The figure shows the first two principal axes of the whole transcriptome Principal Component Analysis (PCA) analysis of the 13 samples shown in Supplemental Figure 1 plus 4 samples corresponding to Activated CD4+ T cells at 8h (red) and 24h (orange) after TCR activation. The percentage of variance explained by each axis is indicated. PCA was performed on the variance-stabilized transformation of read counts as described in Methods. As in Supplemen-tal Figure 1, the first principal axis (PC1) of the PCA separated samples according to their permissiveness to HIV infection. Thus, activated CD4+ T cells mapped in an intermediate position along PC1, between primary resting CD4+ T cells and permissive cell lines.
Authors’ contributions
Conceived and designed the experiments: AR, AT, AC. Performed the experi-ments: AR, RM, MM. Analyzed the data: AR, AT, AC. Contributed reagents/ materials/analysis tools: TR. Wrote the paper: AR, AT, AC. All authors read and approved the final manuscript.
Author details
1 Clinical Bioinformatics lab, Imagine Institute, Paris Descartes University - Sorbonne Paris Cité, 75015 Paris, France. 2 Institute of Microbiology, University Hospital of Lausanne (CHUV) and University of Lausanne, 1011 Lausanne, Switzerland. 3 Infectious Diseases Service, Department of Medicine, University Hospital of Lausanne (CHUV) and University of Lausanne, 1011 Lausanne, Swit-zerland. 4 Genetic Medicine, J. Craig Venter Institute, La Jolla, CA 92037, USA.
Acknowledgements
Authors are thankful to Nitisha Pyndiah for the Western blot experiments shown in Additional file 9: Figure S7. Part of the computations were performed at the Vital-IT (http://www.vital-it.ch) Center for high-performance computing of the SIB Swiss Institute of Bioinformatics.
Competing interests
The authors declare that they have no competing interests.
Funding
The research leading to these results has received funding from the European Union’s Seventh Framework Programme FP7/2007-2013/ under Grant Agreement No. 305762 /Hit Hidden HIV and from the Swiss National Science Foundation Grant No. 149724, 146579 and 149511.
Received: 11 February 2016 Accepted: 14 June 2016
References
1. Ciuffi A, Bleiber G, Muñoz M, Martinez R, Loeuillet C, Rehr M, et al. Entry and transcription as key determinants of differences in CD4 T-cell permis-siveness to human immunodeficiency virus type 1 infection. J Virol. 2004;78:10747–54. doi:10.1128/JVI.78.19.10747-10754.2004. 2. Ciuffi A, Bushman FD. Integration. In: Hope TJ,
Steven-son M, Richman D, editors. Encyclopedia of AIDS. New York: Springer; 2013. p. 1–10. http://link.springer.com/
referenceworkentry/10.1007/978-1-4614-9610-6_66-1.
3. Mohammadi P, Desfarges S, Bartha I, Joos B, Zangger N, Muñoz M, et al. 24 hours in the life of HIV-1 in a T cell line. PLoS Pathog. 2013;9:e1003161.
doi:10.1371/journal.ppat.1003161.
4. Zack JA, Arrigo SJ, Weitsman SR, Go AS, Haislip A, Chen IS. HIV-1 entry into quiescent primary lymphocytes: molecular analysis reveals a labile, latent viral structure. Cell. 1990;61:213–22.
5. Pan X, Baldauf H-M, Keppler OT, Fackler OT. Restrictions to HIV-1 replication in resting CD4+ T lymphocytes. Cell Res. 2013;23:876–85.
doi:10.1038/cr.2013.74.
6. Dunn GP, Sheehan KCF, Old LJ, Schreiber RD. IFN unresponsiveness in LNCaP cells due to the lack of JAK1 gene expression. Cancer Res. 2005;65:3447–53. doi:10.1158/0008-5472.CAN-04-4316.
7. Ren Y, Zhang Y, Liu RZ, Fenstermacher DA, Wright KL, Teer JK, et al. JAK1 truncating mutations in gynecologic cancer define new role of cancer-associated protein tyrosine kinase aberrations. Sci Rep. 2013;3:3042.
doi:10.1038/srep03042.
8. Dron M, Tovey MG. Interferon-resistant Daudi cells are deficient in inter-feron-alpha-induced ISGF3 alpha activation, but remain sensitive to the interferon-alpha-induced increase in ISGF3 gamma content. J Interferon Res. 1993;13:377–83.
9. Petricoin E, David M, Fang H, Grimley P, Larner AC, Vande Pol S. Human cancer cell lines express a negative transcriptional regulator of the Complete hierarchical clustering of genes and cell samples was based on
Pearson correlation of variance-stabilized read counts (Methods). Color scale indicated in the legend corresponds to z-scores of RPKM distribu-tions per gene, ranging from green (low) to red (high) expression. The genes belonging to the 249 genes and 110 genes clusters detected in Figure 1 are indicated in the left side of the heatmap as stripes colored in dark blue and cyan respectively.
[image:9.595.300.538.414.682.2]Additional file 7: Figure S5. Toll-like receptor (TLR) pathway. Repre-sentation of the TLR pathway taken from WikiPathways database [41]. Boxes representing genes display the transcriptional levels detected in RNA-seq libraries of resting CD4+ T cells, and the four human laboratory cell lines HEK293T, Jurkat, SupT1 and CEM -mock (MO), heat-inactivated (HI) and HIV-infected (HIV)- and 4 samples corresponding to Activated CD4+ T cells at 8h and 24h after TCR activation, following the same order of the libraries and color-code scale of expression levels as indicated in Figure 3A. The figure was generated using Pathvisio-3 software [42].
Additional file 8: Figure 6. Interferon (IFN) gamma signaling pathway. Representation of the IFN gamma signaling pathway taken from WikiPath-ways database [41]. Boxes representing genes display the transcriptional levels detected in RNA-seq libraries of resting CD4+ T cells, and the four human laboratory cell lines HEK293T, Jurkat, SupT1 and CEM -mock (MO), heat-inactivated (HI) and HIV-infected (HIV)- and 4 samples corresponding to Activated CD4+ T cells at 8h and 24h after TCR activation, following the same order of the libraries and color-code scale of expression levels as indicated in Figure 3A. The figure was generated using Pathvisio-3 software [42].
Additional file 9: Figure S7. TNF-alpha signaling pathway. Represen-tation of the TNF-alpha signaling pathway taken from WikiPathways database [41]. Boxes representing genes display the transcriptional levels detected in RNA-seq libraries of resting CD4+ T cells, and the four human laboratory cell lines HEK293T, Jurkat, SupT1 and CEM -mock (MO), heat-inactivated (HI) and HIV-infected (HIV)- and 4 samples corresponding to Activated CD4+ T cells at 8h and 24h after TCR activation, following the same order of the libraries and color-code scale of expression levels as indicated in Figure 3A. The figure was generated using Pathvisio-3 software [42].
Additional file 10: Table 3. RT-qPCR results.
Additional file 11: Figure S8. IFN-γ-induced phosphorylation of Stat1. (A) T cell lines (CEM, Jurkat, SupT1) were mock-stimulated (C-) or stimulated using 100 U IFN-γ for different times (1h, 4h, 24h), before cell lysis. Immunoblot analysis of whole cell lysates was performed using anti-phosphorylated Stat1, anti-Stat1 or anti-α-Tubulin detection. (B) Resting CD4+ T cells isolated from two healthy blood donors were either mock- treated (C-), simulated with 100 U IFN-γ or, stimulated using anti-CD3/ anti-CD28/IL2 (TCR) as positive control (C+) for 24h before immunoblot analysis as in A.
Additional file 12: Table S4. Raw read counts per library of the RNA-seq libraries sequenced in this work.
Additional file 13: Table S5. RPKMs of the RNA-seq libraries sequenced in this work.
Additional file 14: Table S6. Table describing RNA-seq libraries that is used as an input for DESeq2 functions in Supplemental File 1.
Additional file 15: File S1. R script gathering the different statistical analyses needed to reproduce the main figures and results of the paper.
Additional file 16: File S2. R package versions used during the execu-tion of Supplemental File 2.
Additional file 17: File S3. List of the 249-cluster used as input in Sup-plemental File 1.
Page 10 of 10 Rausell et al. Retrovirology (2016) 13:43
• We accept pre-submission inquiries
• Our selector tool helps you to find the most relevant journal • We provide round the clock customer support
• Convenient online submission • Thorough peer review
• Inclusion in PubMed and all major indexing services • Maximum visibility for your research
Submit your manuscript at www.biomedcentral.com/submit
Submit your next manuscript to BioMed Central
and we will help you at every step:
interferon regulatory factor family of DNA binding proteins. Mol Cell Biol. 1994;14:1477–86.
10. Improta T, Pine R, Pfeffer LM. Interferon-gamma potentiates the antiviral activity and the expression of interferon-stimulated genes induced by interferon-alpha in U937 cells. J Interferon Res. 1992;12:87–94. 11. Eilers A, Seegert D, Schindler C, Baccarini M, Decker T. The response of
gamma interferon activation factor is under developmental control in cells of the macrophage lineage. Mol Cell Biol. 1993;13:3245–54. 12. Matin SF, Rackley RR, Sadhukhan PC, Kim MS, Novick AC, Bandyopadhyay
SK. Impaired alpha-interferon signaling in transitional cell carcinoma: lack of p48 expression in 5637 cells. Cancer Res. 2001;61:2261–6.
13. Lin AH, Burrascano C, Pettersson PL, Ibañez CE, Gruber HE, Jolly DJ. Block-ade of type I interferon (IFN) production by retroviral replicating vectors and reduced tumor cell responses to IFN likely contribute to tumor selectivity. J Virol. 2014;88:10066–77. doi:10.1128/JVI.02300-13. 14. Burdette DL, Monroe KM, Sotelo-Troha K, Iwig JS, Eckert B, Hyodo M,
et al. STING is a direct innate immune sensor of cyclic di-GMP. Nature. 2011;478:515–8. doi:10.1038/nature10429.
15. Hornung V, Rothenfusser S, Britsch S, Krug A, Jahrsdörfer B, Giese T, et al. Quantitative expression of toll-like receptor 1-10 mRNA in cellular subsets of human peripheral blood mononuclear cells and sensitivity to CpG oligodeoxynucleotides. J Immunol Baltim Md. 1950;2002(168):4531–7. 16. Lau L, Gray EE, Brunette RL, Stetson DB. DNA tumor virus
onco-genes antagonize the cGAS-STING DNA-sensing pathway. Science. 2015;350:568–71. doi:10.1126/science.aab3291.
17. Goujon C, Malim MH. Characterization of the alpha interferon-induced postentry block to HIV-1 infection in primary human macrophages and T cells. J Virol. 2010;84:9254–66. doi:10.1128/JVI.00854-10.
18. Wathelet MG, Berr PM, Huez GA. Regulation of gene expression by cytokines and virus in human cells lacking the type-I interferon locus. Eur J Biochem FEBS. 1992;206:901–10.
19. Goujon C, Moncorgé O, Bauby H, Doyle T, Ward CC, Schaller T, et al. Human MX2 is an interferon-induced post-entry inhibitor of HIV-1 infec-tion. Nature. 2013;502:559–62. doi:10.1038/nature12542.
20. Rausell A, McLaren PJ, Telenti A. HIV and innate immunity—a genomics perspective. F1000Prime Rep. 2013;5:29. doi:10.12703/P5-29.
21. Mohammadi P, di Iulio J, Muñoz M, Martinez R, Bartha I, Cavassini M, et al. Dynamics of HIV latency and reactivation in a primary CD4+ T cell model. PLoS Pathog. 2014;10:e1004156. doi:10.1371/journal.ppat.1004156. 22. Mangeat B, Turelli P, Caron G, Friedli M, Perrin L, Trono D. Broad
antiret-roviral defence by human APOBEC3G through lethal editing of nascent reverse transcripts. Nature. 2003;424:99–103. doi:10.1038/nature01709. 23. Ishikawa H, Barber GN. STING is an endoplasmic reticulum adaptor that
facilitates innate immune signalling. Nature. 2008;455:674–8. doi:10.1038/
nature07317.
24. Sheehy AM, Gaddis NC, Choi JD, Malim MH. Isolation of a human gene that inhibits HIV-1 infection and is suppressed by the viral Vif protein. Nature. 2002;418:646–50. doi:10.1038/nature00939.
25. Neagu MR, Ziegler P, Pertel T, Strambio-De-Castillia C, Grütter C, Martinetti G, et al. Potent inhibition of HIV-1 by TRIM5-cyclophilin fusion proteins engineered from human components. J Clin Invest. 2009;119:3035–47.
doi:10.1172/JCI39354.
26. Laguette N, Sobhian B, Casartelli N, Ringeard M, Chable-Bessia C, Ségéral E, et al. SAMHD1 is the dendritic- and myeloid-cell-specific HIV-1 restric-tion factor counteracted by Vpx. Nature. 2011;474:654–7. doi:10.1038/
nature10117.
27. Schmidt S, Schenkova K, Adam T, Erikson E, Lehmann-Koch J, Sertel S, et al. SAMHD1’s protein expression profile in humans. J Leukoc Biol. 2015;98:5–14. doi:10.1189/jlb.4HI0714-338RR.
28. Krapp C, Hotter D, Gawanbacht A, McLaren PJ, Kluge SF, Stürzel CM, et al. Guanylate binding protein (GBP) 5 is an interferon-inducible inhibitor of HIV-1 infectivity. Cell Host Microbe. 2016;19:504–14. doi:10.1016/j.
chom.2016.02.019.
29. Doitsh G, Greene WC. Dissecting how CD4 T cells are lost dur-ing HIV infection. Cell Host Microbe. 2016;19:280–91. doi:10.1016/j.
chom.2016.02.012.
30. Jakobsen MR, Olagnier D, Hiscott J. Innate immune sensing of HIV-1 infection. Curr Opin HIV AIDS. 2015;10:96–102. doi:10.1097/
COH.0000000000000129.
31. Zhang H, Zhou Y, Alcock C, Kiefer T, Monie D, Siliciano J, et al. Novel single-cell-level phenotypic assay for residual drug susceptibility and reduced replication capacity of drug-resistant human immunodeficiency virus type 1. J Virol. 2004;78:1718–29. doi:10.1128/JVI.78.4.1718-1729.2004. 32. Naldini L, Blömer U, Gallay P, Ory D, Mulligan R, Gage FH, et al. In vivo
gene delivery and stable transduction of nondividing cells by a lentiviral vector. Science. 1996;272:263–7.
33. Grant GR, Farkas MH, Pizarro AD, Lahens NF, Schug J, Brunk BP, et al. Com-parative analysis of RNA-Seq alignment algorithms and the RNA-Seq uni-fied mapper (RUM). Bioinforma Oxf Engl. 2011;27:2518–28. doi:10.1093/
bioinformatics/btr427.
34. Anders S, Pyl PT, Huber W. HTSeq—a Python framework to work with high-throughput sequencing data. Bioinformatics. 2015;31:166–9.
doi:10.1093/bioinformatics/btu638.
35. Anders S, Huber W. Differential expression analysis for sequence count data. Genome Biol. 2010;11:R106. doi:10.1186/gb-2010-11-10-r106. 36. Love MI, Huber W, Anders S. Moderated estimation of fold change and
dispersion for RNA-seq data with DESeq2. Genome Biol. 2014;15:550.
doi:10.1186/s13059-014-0550-8.
37. Ashburner M, Ball CA, Blake JA, Botstein D, Butler H, Cherry JM, et al. Gene ontology: tool for the unification of biology. The gene ontology consor-tium. Nat Genet. 2000;25:25–9. doi:10.1038/75556.
38. Lynn DJ, Chan C, Naseer M, Yau M, Lo R, Sribnaia A, et al. Curat-ing the innate immunity interactome. BMC Syst Biol. 2010;4:117.
doi:10.1186/1752-0509-4-117.
39. Der SD, Zhou A, Williams BRG, Silverman RH. Identification of genes dif-ferentially regulated by interferon α, β, or γ using oligonucleotide arrays. Proc Natl Acad Sci. 1998;95:15623–8. doi:10.1073/pnas.95.26.15623. 40. Schoggins JW, Wilson SJ, Panis M, Murphy MY, Jones CT, Bieniasz P, et al.
A diverse range of gene products are effectors of the type I interferon antiviral response. Nature. 2011;472:481–5. doi:10.1038/nature09907. 41. Kutmon M, Riutta A, Nunes N, Hanspers K, Willighagen EL, Bohler A, et al.
WikiPathways: capturing the full diversity of pathway knowledge. Nucleic Acids Res. 2016;44:D488–94. doi:10.1093/nar/gkv1024.

![Figure 3A. The figure was generated using Pathvisio-3 software [42].](https://thumb-us.123doks.com/thumbv2/123dok_us/8325745.299497/9.595.300.538.414.682/figure-a-figure-generated-using-pathvisio-software.webp)
