Measuring basic skills
for longitudinal study
The design and development of instruments for
use with cohort members in the age 34 follow-up
in the 1970 British Cohort Study (BCS70)
Samantha Parsons and John Bynner,
with Vanessa Foudouli
This document is also available in pdf and text only format from the NRDC's website, www.nrdc.org.uk
For information on alterative formats, please contact:
Emily Brewer
Marketing and Publications Officer Institute of Education
University of London Tel: 020 7947 9501 Email: [email protected]
We welcome feedback on the content and accessibility of this publication. This should be sent to:
Publications NRDC
Institute of Education 20 Bedford Way London WC1H 0AL.
Telephone: +44 (0)20 7612 6476 Fax: +44 (0)20 7612 6671 email: [email protected]
ISBN 1-905188-08-0
© Crown Copyright 2005
Extracts from this publication may be used or reproduced for non-commercial, research, teaching or training purposes on condition that the source is acknowledged.
NRDC is a consortium of partners led by the Institute of Education, University of London (see back cover for a list of members) and is part of the Bedford Group for Lifecourse and Statistical Studies at the IoE. www.ioe.ac.uk/bedfordgroup
longitudinal study
Samantha Parsons and John Bynner
CONTENTS
Acknowledgements 8
Peer review 8
Summary 9
1 BACKGROUND TO THE ASSESSMENT 11
1.1 Skills for Life 11
1.2 The case for new assessments 12
1.3 Instrument design 14
1.4 Stucture of the report 14
2 COHORT STUDIES DESIGN OVERVIEW 16
2.1 Introduction 16
2.2 BCS70 in detail 16
2.3 Development of the 2004 survey 17
2.3.1 The Basic Skills Pilot 17
2.3.2 The Parent and Child Survey 18
2.3.3 The dress rehearsal 19
2.4 Coverage 19
3 BASIC SKILLS 21
3.1 Measurements of basic skills in the 2004 survey 21
3.2 Self-reported difficulties 21
3.2.1 Selecting the questions to pilot 22
3.2.2 Feedback from the Basic Skills Pilot 25
3.2.3 Results from the Basic Skills Pilot and dress rehearsal 26
3.3 Literacy and assessment items 29
3.3.1 Previous assessment of basic skills in BCS70 and NCDS 29
3.3.2 The Skills for Life Survey literacy and numeracy assessments 29
3.3.3 Research and design considerations 31
3.3.4 The Basic Skills Pilot: assessment design 31
3.3.5 Aims of the Basic Skills Pilot 32
3.4 Multiple-choice literacy and numeracy assessment items 33
3.4.1 Design of the multiple-choice assessment 35
3.4.2 The Basic Skills Pilot: feedback and results 37
3.4.3 Design of the final multiple-choice assessment 40
3.4.4 Selecting multiple-choice questions for the final assessment 40
3.5.1 Selecting the open-response questions 45
3.5.2 Amendments to questions for the Basic Skills Pilot 48
3.5.3 Results from the Basic Skills Pilot 48
3.5.4 Amendments to questions for the dress rehearsal 48
3.5.5 Results from the dress rehearsal 49
3.6 Converting overall performance in literacy and numeracy
assessments into levels 52
3.6.1 For literacy 52
3.6.2 For numeracy 53
3.7 Coverage of the National Curriculum 54
3.7.1 Literacy 54
3.7.2 Numeracy 54
3.8 Handwriting 54
4 DYSLEXIA 56
4.1 Measuring symptoms of dyslexia 56
4.2 The Dyslexia Adult Screening Test (DAST) 56
4.3 Selecting the DAST exercises 57
4.4 Adapting the DAST materials and interviewer instructions 59
4.5 DAST exercises and results from the Basic Skills Pilot and
dress rehearsal 62
4.5.1 Time taken to administer the DAST exercises 62
4.5.2 One-Minute Reading exercise 62
4.5.3 Two-Minute/One-Minute Spelling exercise 64
4.5.4 One-Minute Writing exercise 65
4.5.5 Phonemic Segmentation and Spoonerisms exercise 67
4.5.6 Nonsense Passage Reading exercise 69
5 PARENT AND CHILD INTERVIEW 71
5.1 Assessing the cognitive skills of children: which assessment 71
5.2 Introduction to the British Ability Scales II 73
5.3 Selection of particular subscales 74
5.4 Adapting BAS II for interviwer administration 75
5.5 Interviewer materials 75
5.6 Sample size 76
5.7 General interviewer feedback 76
5.8 Administering BAS II: the Early Years Battery 76
5.8.1 Timing 77
5.8.2 Naming Vocabulary 77
5.8.3 Early Number Concepts 79
5.9.3 Spelling 86
5.9.4 Number Skills 88
5.10 Overview of other components of the Parent and Child Interview 91
5.10.1 Additional interviewer (CAPI) questions 91
5.10.2 Paper self-completions 92
5.10.3 Parent self-completions 92
6 SUMMARY AND CONCLUSIONS 98
6.1 Aims of the assessments 98
6.1.1 Literacy and numeracy 98
6.1.2 Dyslexia 98
6.1.3 Intergenerational comparisons 98
6.2 Operations 99
6.2.1 Self-reported difficulties 100
6.2.2 The adult assessments 100
6.2.3 Dyslexia 101
6.2.4 The child assessments 102
6.3 Overall appraisal 102
REFERENCES 103
APPENDICES 107
Basic Skills appendix 108
Dyslexia appendix 119
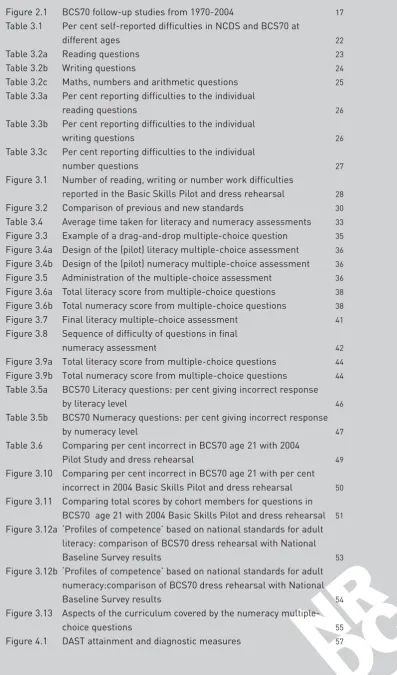
Table 3.1 Per cent self-reported difficulties in NCDS and BCS70 at
different ages 22
Table 3.2a Reading questions 23
Table 3.2b Writing questions 24
Table 3.2c Maths, numbers and arithmetic questions 25
Table 3.3a Per cent reporting difficulties to the individual
reading questions 26
Table 3.3b Per cent reporting difficulties to the individual
writing questions 26
Table 3.3c Per cent reporting difficulties to the individual
number questions 27
Figure 3.1 Number of reading, writing or number work difficulties
reported in the Basic Skills Pilot and dress rehearsal 28
Figure 3.2 Comparison of previous and new standards 30
Table 3.4 Average time taken for literacy and numeracy assessments 33
Figure 3.3 Example of a drag-and-drop multiple-choice question 35
Figure 3.4a Design of the (pilot) literacy multiple-choice assessment 36
Figure 3.4b Design of the (pilot) numeracy multiple-choice assessment 36
Figure 3.5 Administration of the multiple-choice assessment 36
Figure 3.6a Total literacy score from multiple-choice questions 38
Figure 3.6b Total numeracy score from multiple-choice questions 38
Figure 3.7 Final literacy multiple-choice assessment 41
Figure 3.8 Sequence of difficulty of questions in final
numeracy assessment 42
Figure 3.9a Total literacy score from multiple-choice questions 44
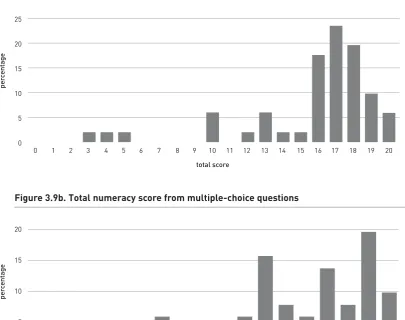
Figure 3.9b Total numeracy score from multiple-choice questions 44
Table 3.5a BCS70 Literacy questions: per cent giving incorrect response
by literacy level 46
Table 3.5b BCS70 Numeracy questions: per cent giving incorrect response
by numeracy level 47
Table 3.6 Comparing per cent incorrect in BCS70 age 21 with 2004
Pilot Study and dress rehearsal 49
Figure 3.10 Comparing per cent incorrect in BCS70 age 21 with per cent incorrect in 2004 Basic Skills Pilot and dress rehearsal 50
Figure 3.11 Comparing total scores by cohort members for questions in BCS70 age 21 with 2004 Basic Skills Pilot and dress rehearsal 51
Figure 3.12a ‘Profiles of competence’ based on national standards for adult literacy: comparison of BCS70 dress rehearsal with National
Baseline Survey results 53
Figure 3.12b ‘Profiles of competence’ based on national standards for adult numeracy:comparison of BCS70 dress rehearsal with National
Baseline Survey results 54
Figure 3.13 Aspects of the curriculum covered by the numeracy
multiple-choice questions 55
[image:6.595.69.467.116.792.2]Table 4.1 Average time taken to complete the DAST exercises 63
Table 4.2 Results of the One-Minute Reading exercise 64
Figure 4.4 Distribution of scores in the One-Minute Reading exercise 64
Table 4.3 Results of the Two/One-Minute Spelling exercise 65
Figure 4.5 Distribution of Two/One-Minute Spelling scores 66
Table 4.4a Results of the Phonemic segmentation exercise 68
Table 4.4b Results of the Spoonerisms exercise 68
Figure 4.6 Distribution of Spoonerism scores 69
Table 4.5 Results of the Nonsense reading exercise 70
Figure 4.7 Distribution of scores for the nonsense passage exercise 70
Figure 5.1 Selected BAS II subscales 75
Table 5.1 Average time taken to complete scales from the
Early Years Battery 77
Figure 5.2 BAS II Naming Vocabulary Image and CAPI screen 78
Figure 5.3 Early Years Battery: Naming Vocabulary ability scores 79
Figure 5.4 BAS II Early Number Concepts Image and CAPI Screen 80
Figure 5.5 Early Years Battery: Early Number Concepts ability scores 81
Figure 5.6 Example of a completed copying booklet 83
Table 5.2 Average time taken to complete scales from the School
Age Battery 83
Figure 5.7 BAS II Word Reading List 84
Figure 5.8 Ability scores in the School Age Word Reading scale 85
Figure 5.9 Revised BAS Spelling exercise 87
Figure 5.10 Rescaled School Age Spelling scores 88
Figure 5.11 Examples of modified BAS II formats 89
Figure 5.12 Examples of diversity of BAS II Number Skills questions
from each block 90
Figure 5.13 Ability scores in the School Age Number Skills Scale 91
This report is funded by the Department for Education and Skills as part of Skills for
Life: the national strategy for improving adult literacy and numeracy skills. The views
Acknowledgements
We would like to acknowledge all members of the research team at NatCen involved with the 2004 survey, without whom this report could not have been produced. Our special thanks are reserved for Carli Lessof, Liz Fuller and Nadine Simmonds whose innovative ideas in the design of survey instruments and interviewer briefings have shown the way forward. We would also like to express our gratitude to the NatCen interviewers whose feedback
throughout the development stages was of vital importance to the success of the final design of all survey instruments. The cohort studies support team, led by Peter Shepherd, played a vital role in the survey design team, as did Neville Butler, the founder of the 1970 British Cohort Study (BCS70), whose extensive knowledge and experience of the earlier stages of the cohort study was critical to its success. The CLS tracing team put in tremendous work to maximise response rates.
We would also like to acknowledge the earlier support given to the assessment of cohort members basic skills by The Basic Skills Agency, whose funding over a twelve year programme of research placed the antecedents and consequences of poor basic skills for adults firmly on the political and policy making agenda. We give particular thanks to Annabel Hemstedt and Alan Wells.
Special thanks are also owed to Peter Burke, John Gillespie and Bob Rainbow at the Centre for Developing and Evaluating Lifelong Learning (CDELL) for their advice and consultation on the re-design and selection of the items from the Baseline Survey, and to Angela Fawcett for her guidance on the use of the Dyslexia Adult Screening Test (DAST). We are also grateful to Richard White at the Department for Education and Skills (DfES) who helpfully commented on the final report.
We also want to thank the members of the public who willingly took part in the pilot surveys and, finally, the cohort BCS70 cohort members who took part in the dress rehearsal and main fieldwork. They freely gave up some of their precious time to take part in our assessments and to provide us once again with other vital information about their lives. We are particularly grateful to those who also consented to the involvement of their children.
Peer review
Summary
The work here took place against the background of a major new initiative in Britain, both to understand and to tackle the problem of poor basic skills in a substantial minority of the population. Concerns were driven by the growing body of international evidence that basic skills difficulties were a major impediment to successful functioning in modern society, not least in the UK. This culminated in the work of the Moser Committee, (Moser report (1999), A fresh start. Improving literacy and numeracy. DfEE), and the government strategy that flowed from it, Skills for Life.
The 1958 and 1970 British birth cohort studies, longitudinal studies that follow up all babies born in a single week throughout their lifetime, were an important source of evidence for the Moser Committee’s enquiry into adult basic skills (literacy and numeracy) that needed expanding and updating because of the relatively small sub-samples from which the original basic skills data were collected. The Skills for Life strategy, and the research programme NRDC set up to support it, offered the opportunity to extend measurement of literacy and numeracy skills to the whole of one of the birth cohorts – the 1970 cohort at the age of 34, for which funding was already available for a follow-up in 2004.
The 2004 survey has two main parts: the Core Interview, which every cohort member who agreed to take part completed, and the Parent and Child Interview, that only selected cohort members with resident natural or adopted children completed. The Core Interview also included:
■ the assessment of all BCS70 cohort members’ grasp of literacy and numeracy. ■ a number of exercises to assess the presence of symptoms associated with dyslexia. ■ a standard Computer Assisted Personal Interview (CAPI) and Computer Assisted Self
Interview (CASI) to update the record of cohort members’ lives and to observe their current situation in respect of education, housing, health, work and family life.
The Parent and Child Interview contained:
■ an additional CAPI section in the personal interview where cohort members answered questions about the health, care and education experiences of each of their resident natural or adopted children aged 16 years, 11 months or less.
■ a paper-based self-completion questionnaire, which required cohort members to answer questions covering parenting styles and the development of each eligible child.
■ the assessment of the cognitive skills of their children between age 3 and 16 years, 11 months.
■ resident natural or adopted children aged between 10 years and 16 years, 11 months inclusive also completed an additional questionnaire about their activities at home and school, their attitudes, self-esteem and educational aspirations.
adult literacy and numeracy assessments, for which two modes of questioning were used: multiple-choice and open response (interview) mode. The account of the dyslexia
assessments follows in chapter 4. Chapter 5 describes the child assessments and parent data. Chapter 6 provides an overview and some conclusions.
Each chapter aims to be informative about the work undertaken as an aid to interpretation of results, particularly for research and policy users of the data, and to supply the key
information needed for others to devise their own instruments for the assessment of basic skills. In this sense, the report’s major function is as a source book for future users of this new round of cohort studies basic skills data.
Despite the tight timetable and administrative constraints on the wide range of assessments to be used in the survey, the goals set for them have been achieved. We now have a battery of reliable instruments that we know can be effectively administered in people’s homes by appropriately trained interviewers. The assessments have validity in tapping the core dimensions of literacy and numeracy at the requisite levels with which the survey is concerned. We can also assess the presence of dyslexia as a factor in poor reading and on adult functioning more generally. Reliable children’s assessments of basic skills and broader cognitive measures spanning a wide age-range are available. Well developed questionnaires to tap family functioning and child development can be employed to unpack further the family factors involved in children’s cognitive development and basic skills acquisition.
The prime purposes of the report are to demonstrate ‘fitness for purpose’ of the instruments to be used in the research undertaken to support the Skills for Life strategy and to supply the details of design that will be of help in interpreting the research results. The report also serves in the nature of a source book enabling others to replicate the approach to assessment design on new samples of adults or children1. Overall, the development work represents a substantial contribution to the knowledge base on which the success of Skills for Life ultimately depends.
1 Background to the assessment
1.1 Skills for Life
The British 1958 and 1970 birth cohort studies are longitudinal studies of the British population followed up from birth through adult life. The National Child Development Study (NCDS) started with all the 17,000+ births in a single week in 1958 and the 1970 British Cohort Study (BCS70) started with all 17,000+ births in a single week in 1970. Evidence from the studies on the extent of, and correlates of, basic skills difficulties in the population reinforced television-based literacy campaigns of the 1980s2(continuing on from the very influential On the Move series which began in 1975), and was a major source of evidence underpinning the work of the Basic Skills Agency through the 1990s. The Moser Committee, in their report A Fresh Start, similarly relied heavily on cohort studies evidence in making the case for major new government initiatives on adult basic skills3. The picture painted of a population with significant numbers lacking basic functional literacy – up to 20 per cent – and perhaps twice this proportion unable to function effectively with numeracy, signalled a national problem that became a top government priority to solve. Impetus was added by international comparison of basic skills performance through the Organisation for Economic Cooperation and Development (OECD)’s International Adult Literacy Survey (IALS), suggesting that Britain was near the bottom of the functional literacy and numeracy league table – 22 per cent poor literacy compared with 7 per cent in Sweden4. This implied that one in five British adults had the literacy and numeracy skills that were not much above those expected of an 11-year-old.
The consequence of the literacy and numeracy gap had also been spelt out in the cohort studies work. Those with functional literacy and numeracy problems were much more likely to be unemployed or characterised by various kinds of disengagement and poor well-being. Moreover, their problems typically reflected a stunted educational career related to poor family circumstances and lack of parental interest in and support for educational progress. The education system had clearly failed such children who had entered adult life without the basic competencies and qualifications demanded for effective functioning in a modern industrialised society. The general conclusions drawn from the cohort studies evidence were:
■ Britain’s economic competitiveness was damaged in comparison with other countries through its high level of basic skills difficulties;
■ basic skills difficulties were a major factor in adult social exclusion – another key government concern; and
■ major efforts across the education system were required to ensure that subsequent generations left education with full basic skills competence.
The Moser Committee prescriptions for improvement concerned the first two of these challenges. The committee set targets for curtailing the problem among adults, with
reductions by 2010 to half the numbers in the poor literacy and poor numeracy categories, so
2. On the BBC: ‘Switch onto English’, 1984–5, ‘Write Now’, 1985–6, ‘Spelling it Out’, 1987–8, ‘Stepping Up’ and ‘Step Up to WordPower and NumberPower’, 1989. For Granada/ITV: World in Action documentary ‘Starting at the Bottom’, 1987. 3. Moser Report (1999). A Fresh Start: Improving Literacy and Numeracy.DfEE publication, ref CMBS1.
that by this date over 90 per cent of the population would be competent in both.
Taking up the challenge, the Department for Education and Skills (DfES) commissioned research on the savings to the taxpayer of reducing Britain’s basic skills deficit. Again, using cohort study data, the Institute of Fiscal Studies in collaboration with the Centre for Economic Performance at the London School of Economics and the Wider Benefits of Learning research centre at the Institute of Education, University of London estimated that the gain to the taxpayer would be as much as £2.54 billion if the Moser numeracy target was achieved and £0.44 billion for the achievement of the literacy target5. This analysis provided a major plank of the evidence base in support of the Department’s submission to the consolidated spending review at the time. The outcome was the release of the funding that led to the launch of the top priority government programme, Skills for Life6.
1.2 The case for new assessments
Despite the extensive use made of the cohort study evidence to support new policies, it had to be acknowledged that the collection of basics skills performance data in the cohort studies, at age 21 in the case of BCS70 (1991) and at age 37 in NCDS (1995), was limited to 10 per cent samples – reflecting the funding available at the time. This limited the scope of analysis quite significantly with respect to:
■ charting the career pathways of particular groups with basic skills difficulties;
■ investigating the functioning of people with poor skills in different kinds of occupational and social contexts; and
■ mapping geographical variation.
Apart from analysis limitations, each of the two basic skills assessments had been to a certain extent ad hoc in conception and use with different test instruments devised
respectively by Cambridge Training and Development Ltd (BCS70 – age 21) and the National Foundation for Educational Research (NCDS – age 37). Each attempted to map test scores onto the City and Guilds ‘Wordpower’ and ‘Numberpower’ standards in use at the time (see chapter 3), but this had only been partially successful. There was therefore a case for the development of a new test that would make good these deficiencies; i.e. could be
‘benchmarked’ against new national standards and would reflect more faithfully the new core curriculum for adult basic skills. It should also maintain a degree of comparability with the earlier sub-sample basic skills assessments.
Accordingly, when the National Research and Development Centre for Adult Literacy and Numeracy (NRDC) was established in the Institute of Education, University of London (as part of Skills for Life), a top priority was to use the funding available to carry out a comprehensive assessment of cohort members’ basic skills in at least one of the cohorts. The availability of NRDC funding coincided with funding made available by the Economic and Social Research Council (ESRC) for the planned interview follow-up at age 34 in BCS70 and a telephone interview survey at age 46 in NCDS. Accordingly, through this it was possible to build in a basic skills assessment for the whole BCS70 cohort at only a marginal cost to NRDC.
5. Bynner, J, McIntosh, S, Vignoles, A, Derden, L, Reed, H, Van Reenen, J (2001). Improving Adult Basic Skills: benefits to the individual and society.DfEE Research Report RR251. London: HMSO.
The BCS70 follow-up survey also offered other data collection opportunities of major relevance to the Skills for Life strategy:
■ subjective appraisal of difficulties; ■ writing assessment;
■ dyslexia assessment; and
■ assessment of cohort members’ children.
Until the adoption of objective assessment through specially designed tests in the BCS70 age-21 survey, previous data on basic skills difficulties had been collected by asking cohort members directly about them. This was the method used in the 1981 NCDS survey at age 23, analysis of which was influential in the 1987 World in Action documentary Starting at the Bottom7. The method was subsequently repeated in the NCDS age-33 and age-42 surveys and used alongside the objective assessment in the age-37 survey. Subjective assessments were also included in the BCS70 age-21 and age-30 surveys. Such assessments, which correlate only weakly with objective measures, are particularly useful in gauging motivation to sign up for remedial courses. Accordingly, it was also decided to use subjective appraisals in an improved form for the new BCS70 follow-up.
Samples of cohort members’ writing were collected in the BCS70 age-21 and NCDS age-37 surveys. These required extensive coding and have not been used much in subsequent research. The new opportunities the NRDC funding offered led to the decision to include a similar collection of writing samples in the new survey.
Throughout their childhoods, BCS70 cohort members had received regular assessments of their cognitive skills development, including reading and mathematics. At age 10, they had also taken a number of sub-tests from the Bangor Dyslexia Test8, specially designed to measure the reading disorder dyslexia in children (see chapter 4). It was decided to capitalise on this earlier experience by investigating continuities in dyslexia symptoms and their consequences from childhood to adulthood by including an assessment of adult dyslexia in the follow-up survey.
Finally in the follow-up at age 33 in NCDS, one third of cohort members and all their eligible children took part in a sub-study that included assessments of the children’s cognitive development using an English adaptation of American tests9. Through funding that became available to NRDC by a grant from the European Social Fund (ESF), it was possible to include a similar, though trimmed down, assessment of cohort members’ children in the BCS70 follow-up. This would have the advantage of enabling intergenerational continuities and discontinuities in basic skills acquisition from parents to children to be investigated. It also offered opportunities for cross-cohort comparison at comparable ages to identify any changes in the processes of literacy and numeracy acquisition across the 12 years separating the births of the two cohorts. For the new surveys, however, it was necessary to increase the
7. Mary Hamilton discussed findings reported in Hamilton, M (1987) Literacy, Numeracy and Adults.London: ALBSU (Adult Literacy and Basic Skills Unit, now The Basic Skills Agency).
8. Miles, TR, (1982/1997) The Bangor Dyslexia Test. Wisbech, Cambs: Learning Development Aids.
9. Funded through a special grant by the US National Institute for Child Health and Development. Some examples of research using this data: Verropoulou, G, Joshi, H and Wiggins, R D (2002) ‘Migration, Family Structure and Children’s Well-being: a Multilevel Analysis of the Second Generation of the 1958 Birth Cohort Study’, Children and Society, vol 16, pp 219–231. McCulloch, A and Joshi, H (2002). ‘Child Development and Family Resources: an exploration of evidence from the second generation of the 1958 Birth Cohort’, Journal of Population Economics, vol 15, pp 283–304. McCulloch, A and Joshi, H (2001). ‘Neighbourhood and family influences on the cognitive ability of children in the British National Child Development Study’,
sample of cohort members from one third to one half, reflecting the delayed parenting, and consequently smaller number of children eligible for assessment, in the more recent 1970 cohort10.
1.3 Instrument design
The standard design protocol for a cohort study follow-up survey comprises piloting some or all parts of the instrumentation on general population samples. The piloting is followed by a comprehensive ‘dress rehearsal’ pilot survey for testing the whole data collection package on a representative sample of cohort members before putting the main survey into the field. Because of the need to develop a new adult literacy and numeracy assessment and assess the feasibility of the dyslexia assessment, in this case the piloting included a more substantial developmental stage. A large-scale pilot survey was used, encompassing 177 respondents to generate enough data for item analysis. The results supplied the basis for finalising the test design within the context of the preferred survey method, Computer Assisted Personal Interview (CAPI).
For the child assessments, following an extensive review of alternative standard instruments for use with children ranging from age 3 through (potentially) to 16, piloting was used (on a smaller sample) principally to test timings and feasibility in the different field settings in which the assessment was to be administered. (As in the previous BCS70 adult follow-up at age 30, all data collection was to take place in cohort members’ homes.) Apart from the assessment, the cohort member parent (including the cohort member father whenever possible) supplied much information about each individual child and family life more generally. The mode of data collection included, written (supplied on paper), and
computer–administered self-completion questionnaires. Children of 10 years and over also completed a paper self-completion questionnaire about their lives.
The dress rehearsal survey brought all of the different assessment components together with the cohort member interview. The interview was used to update the picture of the cohort members’ current situation in relation to employment, family, education, health, social participation and attitudes and to fill the gap in job and other histories between the present and the previous follow-up at age 30. It also supplied the opportunity to collect cohort
members’ own assessments of their basic skills difficulties and, at the end of the interview, to collect samples of their writing.
1.4 Structure of the report
The following chapters set out in detail the steps taken in the design of the NRDC-funded components of the 34-year-old BCS70 follow-up survey. The account includes the different piloting stages, the analysis of the data collected and the conclusions leading to final design decisions. This work was carried out in close collaboration with our colleagues in the National Centre for Social Research11who were contracted to undertake the surveys and whose
professionalism and experience was absolutely vital to the success of the design process. Interviewer feedback on the difficulties they faced in delivering such complex survey instruments in the field was also critically important.
Chapter 2 sets out in more detail the main design features of the 1970 cohort study and the components of the 34 year-old follow-up. Chapter 3 describes the design of the adult literacy and numeracy assessments, for which two modes of questioning were used: multiple-choice and open response (interview) mode. The account of the dyslexia assessments follows in chapter 4. Chapter 5 describes the child assessments and parent data.
2 Cohort studies design overview
2.1 Introduction
Britain’s nationwide birth cohort studies follow the same group of people from birth into and through adulthood giving a picture of whole generations. By following up people from birth, it is possible to find out how present situations relate to past circumstances and predict future functioning. Cohort studies are one of the richest resources for the study of human
development, covering all aspects of life and are widely used by government and in academic research, nationally and internationally.
There are four such surveys in Britain:
■ National Survey of Health and Development (NSHD) which began in 1946. ■ National Child Development Study (NCDS) which began in 1958.
■ 1970 British Cohort Study (BCS70) which began in 1970. ■ Millennium Cohort Study (MCS) which began in 2000.
The first three of those studies are based on all births in Great Britain in one week in 1946, 1958 and 1970, whereas the MCS is based on births over 12 months in selected areas within the United Kingdom. NCDS, BCS70 and MCS are all managed by the Centre for Longitudinal Studies (CLS) at the Institute of Education, University of London. NSHD is based in the Department of Epidemiology and Community Health at University College, London.
2.2 BCS70 in detail
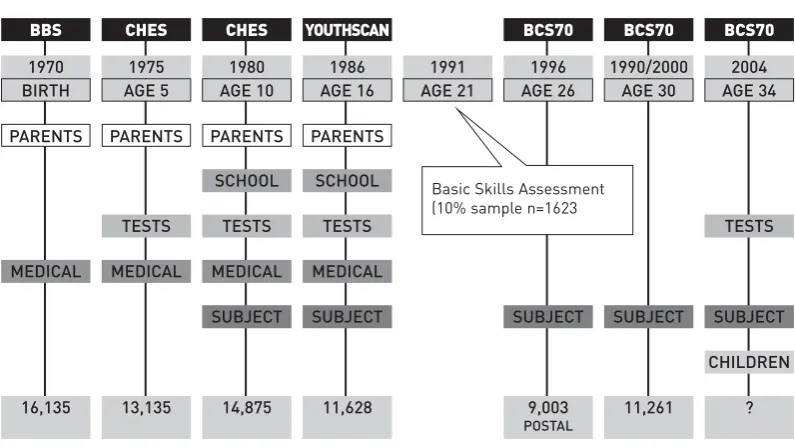
BCS70 began when data were collected about all the babies born in England, Scotland and Wales12in one week of April 1970. As shown in figure 2.1, cohort members have since been followed up five times, at ages 5, 10, 16, 26 and 30, to collect data about their health, educational, social and economic circumstances. (A representative 10 per cent sample were also interviewed at age 21). The most recent (sixth) follow up was carried out in 2004 when cohort members were aged 33 or 34. It is estimated that the final sample will be close to 10,000.
2.3 Development of the 2004 survey
Development work to establish robust survey instruments, with special emphasis on the new literacy and numeracy assessments, began in 2002. The first design of the adult assessments was piloted on 177 members of the general public in their 30s in July 2003 (The Basic Skills Pilot). The child assessments were similarly piloted in September-October 2003 on 127 children from 60 households (The Child Assessment Pilot). After revisions to the design of some assessments, all survey instruments were piloted in a ‘dress rehearsal’ of the final survey design on 64 BCS70 cohort members and 40 of their children in November 2003 (The dress rehearsal). The main fieldwork for the 2004 survey began in February 2004. All possible interviews were completed by June 2005.
2.3.1 The Basic Skills Pilot
The sample was recruited from the general population, with interviewers aiming to interview equal numbers of men and women aged between 29 and 39, as BCS70 cohort members would be 34 when interviewed. No formal socio-economic criteria were given, but interviewers were initially instructed to recruit from a diverse range of housing types. 16 interviewers were briefed by the research team on either 22 or 23 July 2003. The fieldwork took place from 24 July 2003 – 6 August 2003. The interviewer de-briefing was on 7 or 8 August 2003.
Interviewers approached potential respondents on the doorstep, or by ‘snowballing’ from respondents and other contacts, i.e. asking those who had taken part in the study if they knew of anyone else who might be willing to participate. Those who agreed to take part were given a letter explaining the study. In most cases, an appointment was made for a later time, although in some cases respondents were interviewed immediately contact was made. Everyone who completed the interview was given a £10 gift voucher as a token of appreciation.
[image:17.595.141.539.106.330.2]The sample was originally to be boosted by up to 20 respondents recruited from students attending adult basic skills courses at colleges within London. This was to ensure that there Figure 2.1. BCS70 follow-up studies from 1970–2004
CHILDREN
BBS CHES CHES YOUTHSCAN BCS70 BCS70 BCS70
1970 1975 1980 1986 1991 1996 1990/2000 2004 BIRTH AGE 5 AGE 10 AGE 16 AGE 21 AGE 26 AGE 30 AGE 34
PARENTS PARENTS PARENTS PARENTS
SCHOOL SCHOOL
TESTS TESTS TESTS TESTS
MEDICAL MEDICAL MEDICAL MEDICAL
SUBJECT SUBJECT SUBJECT SUBJECT SUBJECT
16,135 13,135 14,875 11,628 9,003 POSTAL
11,261 ?
would be sufficient respondents with poor literacy skills to effectively pilot the easier part of the literacy multiple-choice assessment (a group estimated to make up between 5 per cent and 10 per cent of the target population). Numerous efforts were made to recruit adult learners13 – however, the scheduling of the pilot during the summer holidays meant that such a group could not be contacted and recruited in time.
Instead, the interviewers were asked to target respondents who might be more likely than average to have poor basic skills. Since this could not be done explicitly without the risk of causing offence, the following tactics were recommended:
■ Concentrating recruitment in low income areas, where individuals with low basic skills might be expected to be more likely to be found;
■ Encouraging respondents whose reluctance to take part seemed to be linked to the content of the interview; and
■ Using ‘snowballing’ techniques – respondents who had qualified for the easier literacy questions and had seemed to enjoy the interview were asked to suggest friends who might be interested in taking part.
In total, 14 interviewers achieved 177 interviews across England and Scotland14. The sample was:
■ 58 per cent women (102), 42 per cent men (75); ■ 94 per cent White British;
■ aged between 25 and 45, with 89 per cent falling within the desired 29 to 39 age range; and ■ 66 per cent of men and 57 per cent of women had first left full-time education at 16.
2.3.2 The Parent and Child Pilot
The sample was once again recruited from the general population, with some interviewers returning to households who had participated in the Basic Skills Pilot. For ‘new’ respondents, the same procedures were followed as detailed above. Every adult who took part in the interview was again given a £10 gift voucher as a token of appreciation; every child was given a ‘goody bag’. Interviewers were briefed by the research team on 22 September 2003. The fieldwork took place from 27 September 2003–12 October 2003. The interviewer de-briefing was on 20 October.
Once the interviewer had collected the basic demographics of all household members in the CAPI, for each eligible child the parent (figure) was asked a number of questions about their health and education on the CAPI and filled out a self-completion paper questionnaire for each eligible child. Each child in the household between age 3 and 16 years, 11 months who agreed to take part completed a number of assessments. In total, information was collected on 127 children from 60 households. 99 children completed at least one of the three
assessments. There were two versions of the assessments: the BAS II Early Years
assessments for children aged 3–5 years, 11 months, the BAS II School Age assessments for children between ages 6 and 16 years, 11 months15.
13. Organisations contacted for that purpose include the Tower Hamlets College (Judith Hinman) and the University of London, Institute of Education (Irene Schwab).
14. Two interviewers were briefed but did not return complete interviews. No interviews took place in Wales.
■ 32 per cent (n=32) of children completed the Early Years assessment. ■ 68 per cent (n=67) of children completed the School Age assessment.
2.3.3 The dress rehearsal
Briefings were held on 20, 21 and 24 November. Ten interviewers completed interviews from 25 November–7 December 2003. The de-briefing of interviewers took place on 10–11
December.
A representative sample of 140 BCS70 cohort members was issued to NatCen. Of these:
■ 81 per cent had been interviewed in 1999/2000. ■ 19 per cent had been interviewed in 1986.
Overall, interviews with 64 cohort members and 40 of their children were completed. Of these children:
■ 35 per cent (n=14) completed the BAS II Early Years assessments. ■ 65 per cent (n=26) completed the BAS II School Age assessments.
2.3.4 Main fieldwork
The issued sample for the main fieldwork from the CLS database to NatCen was 13,197 cohort members. All of these cohort members met the following criteria:
■ living in Great Britain and outlying islands;
■ interviewed in 1986 or later (i.e. since they were 16); and ■ contact details confirmed since 1996.
In total, 85 per cent of the sample had been interviewed by NatCen interviewers in 1999/2000. Of the remaining 15 per cent, 9 per cent had participated in the 1996 postal survey and 6 per cent were last interviewed in 1986. Cohort members who have withdrawn permanently from the study were excluded, as were a very few who were difficult or unpleasant when last interviewed.
2.4 Coverage
The 2004 survey has two main parts, the Core Interview, which every cohort member who agreed to take part completed, and the Parent and Child Interview that only selected cohort members with resident natural or adopted children completed.
The Core Interview involved a personal interview and an adult assessment:
■ Personal Interview: a standard Computer Assisted Personal Interview (CAPI) and Computer Assisted Self Interview (CASI) were used to update the cohort members’ lives and to observe their current situation in respect to education, housing, health, work and family life. The estimated average time for completion of the CAPI and CASI was 50 minutes.
assessment, comprising:
• test items from the National Survey of Adult Basic Skills Needs16, carried out to assess the general public’s basic skills problems;
• test items used in the previous 1991 BCS70 basic skills survey17; and • test items adapted from the Dyslexia Adult Screening Test18.
The Parent and Child Interview contained an additional CAPI section in the personal interview, paper based self-completion questionnaires and the assessment of their children’s cognitive skills19.
■ CAPI interview module: cohort members answered questions about the health, care and education experiences of each of their resident natural or adopted children, who lived in the same household, aged 16 years, 11 months or less. The estimated average time for
completion of this section was 10 minutes per child, though time would vary according to the age of a child.
■ Parent self-completion paper questionnaire: cohort members answered questions covering parenting styles and the development of children aged 0–16, 11 months. There was a questionnaire to complete for each of their resident natural or adopted children. The estimated average time for completion of a questionnaire was 10 minutes.
■ Child self-completion paper questionnaire: resident natural or adopted children aged between 10 years and 16 years, 11 months inclusive completed a questionnaire about their activities at home and school, their attitudes, self-esteem and educational aspirations. The estimated average time for completion was 15 minutes.
■ Child assessments: resident natural or adopted children aged between 3 and 16 years, 11 months had their cognitive skills assessed. The assessments were selected from the battery of assessment tools that make up the British Ability Scales, or BAS II20. The estimated average time for completion was 20 minutes.
A technical report containing a more detailed description of the content of each questionnaire included in the 2004 survey will be published after the main fieldwork has been completed.
16. Williams, J, Clemens, S, Oleinikova, K and Tarvin, K (2003). The Skills for Life survey: A national needs and impact survey of literacy, numeracy and ICT skills.DfES Research Report 490. Department for Education and Skills. Crown copyright. 17. These items concerning the use of functional literacy and numeracy were developed by the Cambridge Training and Development Agency. For full details of all assessment items, see Ekinsmyth, C and Bynner, J (1994). The Basic Skills of Young Adults.London: The Basic Skills Agency.
18. Fawcett, A. J and Nicolson, R. I. (1998). The Dyslexia Adult Screening Test (DAST).London: The Psychological Corporation. 19. All cohort members and eligible children participated in the assessments unless they were prevented from doing so by learning difficulties or communication difficulties to do with their sight, hearing or speech. The assessments were not carried out if the cohort member or their child refused, or it was stopped if they became distressed. There were stopping rules specific to most of the assessments, but interviewers were instructed to stop the exercise if the cohort member or child showed any signs of becoming distressed.
3 Basic skills
3.1 Measurement of basic skills in the 2004 survey
Three ways of measuring basic skills were adopted in the 2004 survey. Cohort members answered questions on self-reported difficulties in the Core Interview before attempting multiple-choice and open-response literacy and numeracy assessment items.
These three separate measures of basic skills and results from the pilot studies carried out during the development of the final survey instruments are discussed in the order presented to BCS70 cohort members in the main interview: self reported difficulties, multiple-choice literacy and numeracy assessment items, and open-response literacy and numeracy assessment items.
3.2 Self-reported difficulties
Self-reported difficulties with basic skills have a long history in cohort data, first being asked about in 1981 when NCDS cohort members were age 23. NCDS cohort members have subsequently answered questions on difficulties they had with reading, writing and basic number work at ages 33, 37 and 42, BCS70 cohort members when aged 21 and 30. These questions provided one of the first real insights into the literacy and numeracy difficulties experienced by adults in Britain (ALBSU, 1987)21. As noted in the previous chapter, such questions also have particular value in identifying likely response to new provision offered under the Skills for Life programme. If people do not perceive a difficulty, then clearly the incentive to join classes to improve their skills is missing.
The questions expanded between ages 23 and 33 in NCDS, with this wider coverage being similarly adopted at age 21 in BCS70 and at age 37 in NCDS, although there was a slight alteration to the writing/spelling question (see table 3.2b). In the last round of data collection in 2000, when NCDS cohort members were age 42 and BCS70 age 30, the initial general questions that asked if a cohort member had a skills difficulty were withdrawn. Cohort members were asked a more specific question about the nature of the problems they had with reading, writing or basic maths/numbers/arithmetic, not if they had difficulties per se.
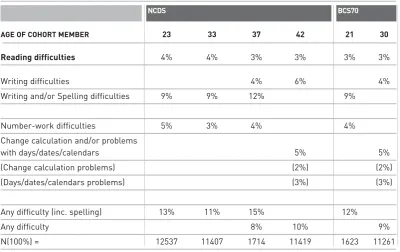
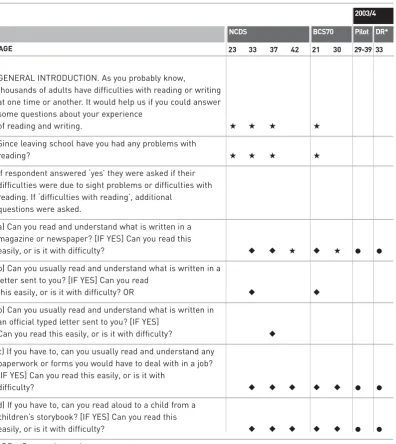
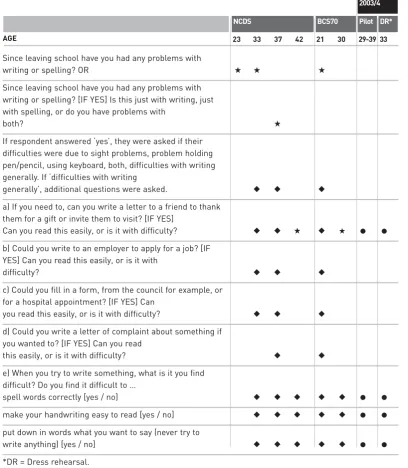
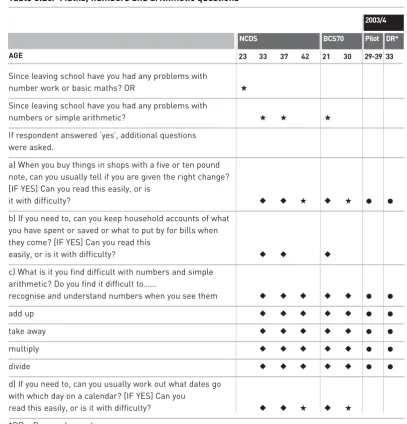
Table 3.1 shows just how remarkably consistent the percentage of cohort members reporting reading, writing/spelling or basic number and arithmetic problems has been over time: 3–4 per cent reading, 3–5 per cent numbers and between 4–12 per cent for writing and/or spelling. The variation for writing/spelling is primarily dependent on whether spelling difficulties were reported separately from writing difficulties22. Tables 3.2a, 3.2b and 3.2c indicate which questions were asked at which sweep of data collection. ‘★’ indicates the question was asked of all respondents, ‘◆indicates the question was filtered i.e. only asked if the response was ‘yes’ to the first question.
21. Hamilton, M (1987). Literacy, Numeracy and Adults.London: ALBSU (Adult Literacy and Basic Skills Unit, now The Basic Skills Agency).
Table 3.1. Per cent self-reported difficulties in NCDS and BCS70 at different ages
AGE OF COHORT MEMBER 23 33 37 42 21 30
Reading difficulties 4% 4% 3% 3% 3% 3%
Writing difficulties 4% 6% 4%
Writing and/or Spelling difficulties 9% 9% 12% 9%
Number-work difficulties 5% 3% 4% 4%
Change calculation and/or problems
with days/dates/calendars 5% 5%
(Change calculation problems) (2%) (2%)
(Days/dates/calendars problems) (3%) (3%)
Any difficulty (inc. spelling) 13% 11% 15% 12%
Any difficulty 8% 10% 9%
N(100%) = 12537 11407 1714 11419 1623 11261
3.2.1 Selecting the questions to pilot
When preparations for the 2004 pilot study began, the value of repeating the same self-reported questions for the benefit of longitudinal consistency, or dropping the filter question in an attempt to capture more specific difficulties cohort members might be experiencing, were weighed up, along with interviewee burden. For example, in the 2000 survey, if a cohort member had reported they have no difficulties to the question, ‘When you buy things in shops with a five or ten pound note, can you usually tell if you are given the right change?’, they would not be asked any further questions. By dropping the filter on this question, cohort members would now be asked if they experienced difficulties with other types of number or maths calculations. After much consideration, the filter was dropped for the pilot study, and all but one of the basic skills questions included in 1999/2000 were asked in 2004. In total, this amounted to three questions on reading difficulties, four questions on writing difficulties and six on number and maths difficulties23. The questions selected are indicated with a ‘●’ in tables 3.2a, 3.2b and 3.2c.
23. The question ‘If you need to, can you usually work out what dates go with days on a calendar?’ was not included. Questions selected concentrated on money, numbers and mathematical calculations.
Table 3.2a. Reading questions
GENERAL INTRODUCTION. As you probably know,
thousands of adults have difficulties with reading or writing at one time or another. It would help us if you could answer some questions about your experience
of reading and writing. ★ ★ ★ ★
Since leaving school have you had any problems with
reading? ★ ★ ★ ★
If respondent answered ‘yes’ they were asked if their difficulties were due to sight problems or difficulties with reading. If ‘difficulties with reading’, additional
questions were asked.
a) Can you read and understand what is written in a magazine or newspaper? [IF YES] Can you read this
easily, or is it with difficulty? ◆ ◆ ★ ◆ ★ ● ●
b) Can you usually read and understand what is written in a letter sent to you? [IF YES] Can you read
this easily, or is it with difficulty? OR ◆ ◆
b) Can you usually read and understand what is written in an official typed letter sent to you? [IF YES]
Can you read this easily, or is it with difficulty? ◆
c) If you have to, can you usually read and understand any paperwork or forms you would have to deal with in a job? [IF YES] Can you read this easily, or is it with
difficulty? ◆ ◆ ◆ ◆ ◆ ● ●
d) If you have to, can you read aloud to a child from a children’s storybook? [IF YES] Can you read this
easily, or is it with difficulty? ◆ ◆ ◆ ◆ ◆ ● ●
*DR = Dress rehearsal.
key: ★= ask all; ◆= filtered; ●= ask all in 2004
23 33 37 42 21 30 29-39 33
Pilot 2003/4
DR* BCS70
NCDS
Table 3.2b. Writing questions
Since leaving school have you had any problems with
writing or spelling? OR ★ ★ ★
Since leaving school have you had any problems with writing or spelling? [IF YES] Is this just with writing, just with spelling, or do you have problems with
both? ★
If respondent answered ‘yes’, they were asked if their difficulties were due to sight problems, problem holding pen/pencil, using keyboard, both, difficulties with writing generally. If ‘difficulties with writing
generally’, additional questions were asked. ◆ ◆ ◆
a) If you need to, can you write a letter to a friend to thank them for a gift or invite them to visit? [IF YES]
Can you read this easily, or is it with difficulty? ◆ ◆ ★ ◆ ★ ● ●
b) Could you write to an employer to apply for a job? [IF YES] Can you read this easily, or is it with
difficulty? ◆ ◆ ◆
c) Could you fill in a form, from the council for example, or for a hospital appointment? [IF YES] Can
you read this easily, or is it with difficulty? ◆ ◆ ◆
d) Could you write a letter of complaint about something if you wanted to? [IF YES] Can you read
this easily, or is it with difficulty? ◆ ◆
e) When you try to write something, what is it you find difficult? Do you find it difficult to …
spell words correctly [yes / no] ◆ ◆ ◆ ◆ ◆ ● ●
make your handwriting easy to read [yes / no] ◆ ◆ ◆ ◆ ◆ ● ●
put down in words what you want to say (never try to
write anything) [yes / no] ◆ ◆ ◆ ◆ ◆ ● ●
*DR = Dress rehearsal.
key: ★= ask all; ◆= filtered; ●= ask all in 2004
23 33 37 42 21 30 29-39 33
Pilot 2003/4
DR* BCS70
NCDS
Table 3.2c. Maths, numbers and arithmetic questions
Since leaving school have you had any problems with
number work or basic maths? OR ★
Since leaving school have you had any problems with
numbers or simple arithmetic? ★ ★ ★
If respondent answered ‘yes’, additional questions were asked.
a) When you buy things in shops with a five or ten pound note, can you usually tell if you are given the right change? [IF YES] Can you read this easily, or is
it with difficulty? ◆ ◆ ★ ◆ ★ ● ●
b) If you need to, can you keep household accounts of what you have spent or saved or what to put by for bills when they come? [IF YES] Can you read this
easily, or is it with difficulty? ◆ ◆ ◆
c) What is it you find difficult with numbers and simple arithmetic? Do you find it difficult to……
recognise and understand numbers when you see them ◆ ◆ ◆ ◆ ◆ ● ●
add up ◆ ◆ ◆ ◆ ◆ ● ●
take away ◆ ◆ ◆ ◆ ◆ ● ●
multiply ◆ ◆ ◆ ◆ ◆ ● ●
divide ◆ ◆ ◆ ◆ ◆ ● ●
d) If you need to, can you usually work out what dates go with which day on a calendar? [IF YES] Can you
read this easily, or is it with difficulty? ◆ ◆ ★ ◆ ★
*DR = Dress rehearsal.
key: ★= ask all; ◆= filtered; ●= ask all in 2004
3.2.2 Feedback from the Basic Skills Pilot
All questions that asked about skills difficulties in the pilot study were of a simple ‘yes’ or ‘no’ format. However, the feedback from interviewers involved in the pilot study indicated that respondents often wanted an additional intermediate response option, such as ‘sometimes’ or ‘it depends’. Taking this on board, additional response options were introduced to some questions for the dress rehearsal.
23 33 37 42 21 30 29-39 33
Pilot 2003/4
DR* BCS70
NCDS
3.2.3 Results from the Basic Skills Pilot and dress rehearsal
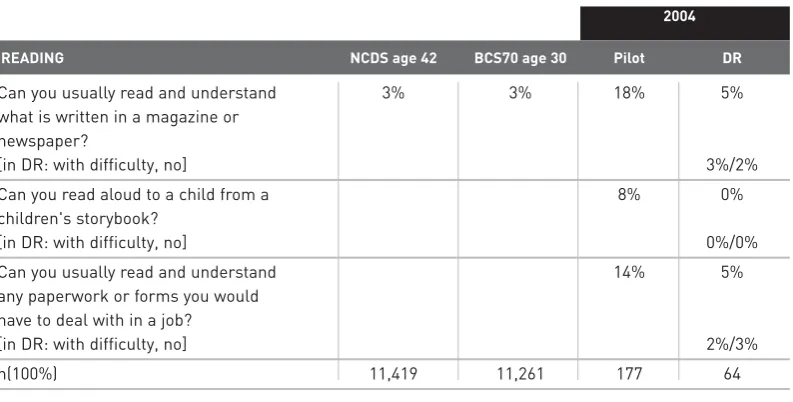
The results from the pilot study and dress rehearsal are shown in tables 3.3a, 3.3b and 3.3c below compared, where possible, with the results for the same questions in the most recent NCDS and BCS70 surveys.
Table 3.3a. Per cent reporting difficulties to the individual reading questions 2004
READING NCDS age 42 BCS70 age 30 Pilot DR
Can you usually read and understand 3% 3% 18% 5%
what is written in a magazine or newspaper?
[in DR: with difficulty, no] 3%/2%
Can you read aloud to a child from a 8% 0%
children's storybook?
[in DR: with difficulty, no] 0%/0%
Can you usually read and understand 14% 5%
any paperwork or forms you would have to deal with in a job?
[in DR: with difficulty, no] 2%/3%
n(100%) 11,419 11,261 177 64
[image:26.595.75.472.176.377.2]DR = Dress rehearsal.
Table 3.3b. Per cent reporting difficulties to the individual writing questions 2004
WRITING NCDS age 42 BCS70 age 30 Pilot DR
Can you write a letter to a friend to thank 6% 4% 7% 2%
them for a gift or to invite them to visit?
[in DR: with difficulty, no] 2%/0%
When you try to write something do you 37% 14%
find it difficult to spell some words correctly?
Do you find it difficult to make your 24% 19%
handwriting easy to read?
Do you find it difficult to put down in 33% 13%
words what you want to say?
n(100%) 11,419 11,261 177 64
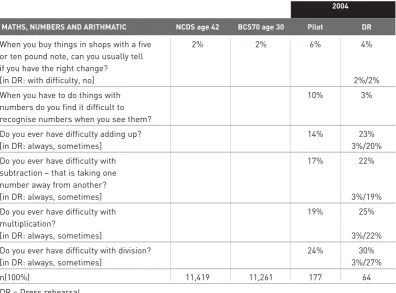
Table 3.3c. Per cent reporting difficulties to the individual number questions 2004
MATHS, NUMBERS AND ARITHMATIC NCDS age 42 BCS70 age 30 Pilot DR
When you buy things in shops with a five 2% 2% 6% 4%
or ten pound note, can you usually tell if you have the right change?
[in DR: with difficulty, no] 2%/2%
When you have to do things with 10% 3%
numbers do you find it difficult to recognise numbers when you see them?
Do you ever have difficulty adding up? 14% 23%
[in DR: always, sometimes] 3%/20%
Do you ever have difficulty with 17% 22%
subtraction – that is taking one number away from another?
[in DR: always, sometimes] 3%/19%
Do you ever have difficulty with 19% 25%
multiplication?
[in DR: always, sometimes] 3%/22%
Do you ever have difficulty with division? 24% 30%
[in DR: always, sometimes] 3%/27%
n(100%) 11,419 11,261 177 64
DR = Dress rehearsal.
For the three questions previously asked to cohort members, we can see that the percentages who reported difficulties in previous sweeps were very similar to the percentages who
reported difficulties in the dress rehearsal. Interestingly, the percentages from responses given by the general population sample used in the Basic Skills Pilot were higher. This might suggest that:
■ levels of self-reported or indeed assessed difficulties in the adult population of Britain are in fact higher than the estimates provided by cohort data over the years24;
■ the location of the Basic Skills Pilot in areas with socio-economic characteristics associated with cohort members with poor basic skills was a well chosen strategy as a higher than the expected percentage of people reported difficulties with one or more of the basic skills; and/or ■ the ‘snowballing’ technique employed by interviewers to try and reach people who had poor
basic skills was productive.
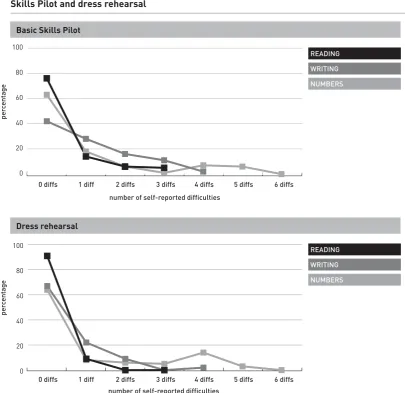
For the questions not previously asked to all cohort members in previous sweeps, many of the Basic Skills Pilot and dress rehearsal population samples reported difficulties with at least one aspect of reading, writing or numberwork. This was highest at 37 per cent for spelling (pilot sample), and 30 per cent for division (dress rehearsal). Interestingly, a higher percentage of the general population sample used in the Basic Skills Pilot consistently reported specific reading and writing difficulties, but a higher percentage of cohort members in the dress rehearsal pilot reported difficulties with the mathematical calculations of addition, subtraction, multiplication and division. Figure 2.1 shows the percentages reporting the specific number of reading, writing or numberwork difficulties. It can be seen that broadly
the same pattern emerged in both pilot surveys with difficulties with numbers showing up most frequently, followed by difficulties with writing and then reading.
[image:28.595.63.469.203.596.2]This will make for interesting analysis opportunities when the data are made available in early 2005. The complete list of questions asked on basic skills difficulties is included in tables A3.1a, A3.1b, A3.1c in the basic skills appendix.
Figure 3.1: number of reading, writing or number work difficulties reported in the Basic Skills Pilot and dress rehearsal
READING WRITING NUMBERS
Dress rehearsal
per
cent
age
0 diffs 1 diff 2 diffs 3 diffs
number of self-reported difficulties
4 diffs 5 diffs 6 diffs
0 20 40 60 80 100
READING WRITING NUMBERS
Basic Skills Pilot
per
cent
age
0 diffs 1 diff 2 diffs 3 diffs 4 diffs 5 diffs 6 diffs
0 20 40 60 80 100
3.3 Literacy and numeracy assessment items
A review of available assessment instruments that had been used to assess adult reading, writing and numeracy in English in a UK setting was carried out by Greg Brooks and
colleagues25for NRDC. The principal aims of this review were to identify the best instrument for different research purposes:
■ progress in response to teaching; and
■ investigation of the origins and consequences of basic skills difficulties.
The latter helped in the choice of assessment instruments for use in the 2004 cohort survey. The two best candidate instruments that emerged were:
■ tests previously used in the 1958 and 1970 cohort studies;
■ theSkills for Life Survey (also known as the National Survey of Adult Basic Skills Needs and as the Adult Basic Skills Baseline Survey)26.
The baseline survey was devised by the Centre for the Development and Evaluation of Lifelong Learning (CDELL) at the University of Nottingham, for the Department for Education and Skills (DfES). Following much consultation with colleagues at CDELL27and in the Institute of Education, a new assessment tool for piloting was designed from these two sources. By retaining some tasks that cohort members completed in the earlier surveys, and importing new tasks from the baseline survey, the new assessment tool would aim to:
■ enhance longitudinal analysis by measuring individual improvement and deterioration over time;
■ extend the scope of the assessment by being comparable with the current national Skills for Life Survey; and
■ maintain continuity with the earlier basic skills surveys.
3.3.1 Previous assessment of basic skills in BCS70 and NCDS
These previous assessments were administered as part of larger paper-based surveys, and as such took no more than 30 minutes of total interview time. In both BCS70 and NCDS surveys, each of the functional literacy and numeracy assessment tasks consisted of giving cohort members a visual stimulus and then asking a number of questions about it. Questions were set at levels of difficulty in accordance with the City and Guilds WordPower and
NumberPower standards at the time: foundation level, level 1, level 2 and level 3 (literacy only) and were ‘open response’ in format.
3.3.2 The Skills for Life Survey literacy and numeracy assessments
The Baseline Survey was carried out by BMRB Social Research28on behalf of the DfES in 2002. The aim of the survey was to produce a national profile of adult literacy and numeracy competence using computer-based multiple-choice items. The numeracy items are based on
25. Brooks, G, Heath, K and Pollard, A (2005). Assessing adult literacy and numeracy: a review of Research Instruments.
London: NRDC.
26. Williams, J, Clemens, S, Oleinikova, K and Tarvin, K (2003). The Skills for Life survey: A national needs and impact survey of literacy, numeracy and ICT skills.DfES Research Report 490.
the Adult Numeracy Core Curriculum for England, the literacy items on the National Adult Literacy Standards29.
The items are set at five levels of difficulty: entry level 1, entry level 2, entry level 3, level 1 and level 2, the most difficult. Figure 3.2 gives a comparison of the old and new standards.
The assessment was carried out in the style of adaptive testing. With this approach, algorithms route the individual respondent to items at an appropriate level for that person, based on their previous response(s). Each respondent who completed the literacy assessment answered between 17 and 20 items from a total of 70 items. Similarly, each respondent who completed the numeracy assessment answered 19 from a total of 48 numeracy items. Each of the literacy and numeracy tests was designed to take 20 to 25 minutes (on average) to complete.
The assessment items were presented to respondents on a laptop computer. The interviewer typically sat alongside the respondent so both could see the screen. After going through some introduction screens with the interviewer on how to do the assessment, the respondent would read the question and corresponding information on the screen for each question, then select from (in most cases) four alternative answers. The interviewer would input this choice into the laptop: the next question was then selected automatically according to the algorithm and displayed.
Figure 3.2. Comparison of previous and new standards
Previous standards New standards
(before 2000)
Source: The Adult Literacy Core Curriculum Trainers’ Pack (2001). Module 1, Unit 2, OHT8, page 36. Department for Education and Skills / The Basic Skills Agency.
L = Level EL = Entry level
28. Key players: Joel Williams, Sam Clemens, Karin Oleinikova and Karen Tarvin.
29. At the time when the survey was designed, the Adult Basic Skills Core Skills Literacy Curriculum was not available and the CDELL team had therefore to select and adapt the QCA Key Skills criteria and ‘Standards for Adult Literacy’ when creating the survey.
L2
L1
EL3
EL2
EL1 L2
L1
3.3.3 Research and design considerations
The two assessment tools identified as the most appropriate for use in the 2004 survey presented many research questions and design challenges before preparations for piloting could begin. The main issues were as follows.
■ Multiple-choice or open-response question format: – One method of question or a combination of both?
– Would changing the question format from multiple-choice or open-response alter the task difficulty, making it easier, more difficult?
■ Adaptive testing or answer all approach:
– Assessing the need for overall percentage pass/fail rates against adaptive testing and ‘spiky profiling’ (detailed below).
■ Paper based or computer assisted:
– The Blaise computer programme used by NatCen has different strengths and weaknesses compared to the programme used by BMRB. Some of the images and questions used in the Baseline survey would need to be altered before they could be Blaise compatible. – Would changing the presentation of a question alter the task difficulty?
– Computer-aided testing sets limits on questions being asked and has ‘corrections’ to answers supplied by respondents built in to the computer programme. Although similar rules can be adopted for paper-based versions, the much greater degree of control the interviewer (and respondent) has over the testing situation with the paper-based test, means that there is less assurance that the rules are being strictly applied.
A combined approach was decided upon. This ensured that the proven strengths of the two chosen assessments were retained. All questions used would be presented in their original format and medium, i.e. questions from the Baseline Survey would be multiple-choice in format and presented on the computer; questions from the previous cohort assessment would be open-response and paper-based. A simple method of adaptive testing that involved two tiers would be adopted for the pilot study. Essentially, all respondents answered an initial set of questions. Depending on the number of correct answers a respondent gave to these initial questions, they either progressed to:
■ a set of harder questions – the ‘upper tier’; or ■ a set of easier questions – the ‘lower tier’.
It was hoped that this approach would permit an overall score based on all respondents to be calculated, along with allowing a ‘spiky profile’ to be built for those with the poorest grasp of the basic skills (those on the lower tier). Such profiles reflect a respondent’s ability through practice to show a high level of competence in one domain of the skill, while performing very badly in other domains. For example, individual experiences mean most people develop particularly competent numeracy skills in some application areas, while needing help in others. By giving respondents who struggled with the initial set of questions an additional set of easier questions, we have an opportunity to really see just what the men and women assessed with the poorest skills are capable of, rather than just knowing what they cannot do. We also needed to provide a distribution of cohort members across test score ‘levels’, in line with the Baseline Survey.
3.3.4 The Basic Skills Pilot: assessment design
familiar with the multiple-choice procedure, the interviewer went through the rules of the assessment and a practice question before the start of the literacy and the numeracy assessment. The order of the assessment was:
■ one practice multiple-choice literacy question; ■ multiple-choice literacy questions;
■ open-response literacy questions;
■ one practice multiple-choice numeracy question; ■ multiple-choice numeracy questions; and ■ open-response numeracy questions.
3.3.5 Aims of the Basic Skills Pilot
The main objective of the basic skills pilot was to gain the information required to design an assessment tool based on the best combination of multiple-choice questions that, in conjunction with the open-response questions, would take an average of 30 minutes to administer. Timing was crucial. While considerations for the selection of specific multiple-choice and open-response questions will be discussed in detail later on in this report, the development of the assessment following ‘time taken’ information from the basic skills pilot is now described.
The CAPI programme included a number of ‘time stamps’ that recorded when particular questions were reached during the interview. The overall mean and median times taken to complete the literacy and numeracy assessments are given in table 3.430. As we can see, respondents took on average between 32 minutes, 30 seconds – 44 minutes, 42 seconds to complete both the literacy and numeracy assessments, dependent upon if progress was along the ‘lower’ or ‘upper’ tiers. To reduce the average time to the allocated 30 minutes of survey time, a minimum of 2 minutes, 30 seconds – 14 minutes, 42 seconds needed to be saved. More questions were piloted than we would hope to include in the final assessment, so ‘time taken’ was recorded for every multiple-choice question. This way, time taken, question difficulty and curriculum coverage could all help inform question selection. As the open-response questions were far fewer and integral to the aims of the overall assessment, the time saving revisions to the assessment for the dress rehearsal were made within the multiple-choice section of the assessment.
Feedback from interviewers indicated that respondents who felt they should have been able to answer a question – generally those with more education – tended to persist until they achieved a satisfactory answer, no matter how long that took. Less able – or less confident – respondents clearly guessed responses to questions that they felt they had no likelihood of answering correctly. This may have been one, though not the only, reason why items in the upper tier in the numeracy assessment took longer on average than those in the lower tier. If the level of difficulty was pitched too high, response time would be more likely to have been polarised in this way.
Given the restrictions, which do not permit details of the original baseline questions to be published, the value of a detailed description of which questions were the most difficult or
took the longest, etc.) has obvious limitations31. However, the longer time taken for the fewer numeracy questions indicates that, not unexpectedly, the sample as a whole found the numeracy multiple-choice questions harder than those assessing literacy skills.
After the rigorous selection criteria had been applied to all multiple-choice questions included in the Basic Skills Pilot, the estimated average time for completion of the 20 selected literacy multiple-choice questions based on results from the Basic Skills Pilot was 9:31 minutes (upper tier); 8:52 minutes (lower tier). The estimated average time for
completion of the 17 selected numeracy multiple-choice questions, again based on results from the Basic Skill Pilot, was 13:06 minutes32. As shown in table 3.4, these estimates were very accurate and the average time taken to complete all parts of the literacy and numeracy assessments in the dress rehearsal was 29 minutes, 22 seconds. No further amendments were necessary. The design of the assessment used in the dress rehearsal was taken forward to the main fieldwork.
Table 3.4. Average time taken for literacy and numeracy assessments
Basic Skills Pilot Dress rehearsal
minutes : seconds minutes : seconds
Literacy multiple-choice* 13:18 9:28
Literacy open-response 3:47 4:21
Combined literacy time 17:05 13:49
upper tier lower tier
Numeracy multiple-choice 17 : 50 9 :47 11:57
Numeracy open-response 4 : 38 4