doi: 10.20964/101041
Int. J. Electrochem. Sci., 11 (2016) 3311 - 3324
International Journal of
ELECTROCHEMICAL
SCIENCE
www.electrochemsci.org
Electrochemical Preparation of Sub-micrometer Sn-Sb Alloy
powder in ChCl-EG deep eutectic solvent
Zhaolei Su1,2, Cunying Xu1,2,*, Yixin Hua1,2, Jian Li1,2, Juanjian Ru1,2, Mengmeng Wang1,2,Li Xiong1,2, Yadong Zhang1,2
1
Faculty of Metallurgical and Energy Engineering, Kunming University of Science and Technology, Kunming 650093, P. R. China
2
State Key Laboratory of Complex Nonferrous Metal Resources Cleaning Utilization,Kunming,650093,P. R. China
*
E-mail: [email protected], [email protected]
Received: 7February 2016 / Accepted: 11 March 2016 / Published: 1April 2016
The sub-micrometer Sn-Sb alloy powders were electrochemically prepared on a titanium substrate in choline chloride-ethylene glycol (ChCl-EG, 1:2 molar ratio) deep eutectic solvent containing 0.2 M SbCl3 and 0.2 M SnCl2. The electrochemical behaviors of Sb(III) and Sn(II) were investigated using
cyclic voltammetry techniques. It revealed that the reduction of Sb(III) and Sn(II), as well as co-reduction of them in ChCl-EG involved the irreversible process controlled by diffusion. The diffusion coefficients of Sb(III) and Sn(II) species were in the range of 10-7 and 10-6 cm2 s-1, respectively. Potentiostatically deposited Sn-Sb alloys were characterized by inductively coupled plasma atomic emission spectrometry (ICP-AES), scanning electron microscopic (SEM) and X-ray diffraction (XRD). The deposition potential played an important role in controlling the composition, but had little effect on surface morphology. Depending on the deposition potential, sub-micrometer Sn-Sn alloy powders containing about 2.7–67.4 at.% Sn were obtained.
Keywords: Deep eutectic solvent; Sn-Sb alloy; Dlectrodeposition; Sub-micrometer.
1. INTRODUCTION
and hydrogen arc plasma have been investigated in recent years [6]. In particular, the electrodeposition technique is a very suitable method for preparation of Sn-Sb powders. The advantages of this way over the others are low capital investment and operational costs, as well as well-controlled composition of the deposited alloy powders [7-9]. The electrolytes mainly used for electrodeposition are aqueous acids or alkalis. However, these acids or alkalis aqueous solutions are fraught with inherent problems such as the unstable composition and large particle size of the deposition alloys[10-11].In this context, room temperature ionic liquids (RTILs) have been developed as promising electrolytes for electrodeposition application due to their wide electrochemical windows and good conductivity[12]. In this field, imidazole ionic liquids have been widely investigated for metals and alloys electrodeposition [13-15]. However, the cost and complex synthesis of imidazole ILs has delayed progress in their use. Alternative, primarily ionic systems called deep eutectic solvents (DESs), which are made from quaternary ammonium salts mixed with simple hydrogen bond donors, are found to have considerable advantages such as cheap, nontoxicity, convenient synthesis, wide electrochemical windows, and acceptable conductivity [16-18]. Recently, some metals and alloys have been successfully electrodeposited from DESs, but few studies have been focused on the electrodeposition of tin and antimony in DESs.
In the present work, we have investigated the electrochemical preparation Sn-Sb alloy powders in the ChCl-EG eutectic melt. Cyclic voltammetry is carried out to analyze the electrochemical behavior of Sn(II) and Sb(III) in ChCl-EG DES. The effects of deposition potential on the composition and morphology of deposits are also examined.
2. EXPERIMENTAL
2.1 Chemicals
All the chemicals used in this work were purchased commercially with analytical grade (purity >99%) from Chemical Reagent Co., Shanghai, China. Choline chloride (ChCl) and ethylene glycol (EG) were dried under vacuum at 373 K prior to use. SnCl2·2H2O was dried at 393 K for 48 hours
under vacuum. Anhydrous SbCl3 was used as received. Prior to use, silver wire (99.95%) were
polished with emery paper, cleaned with acetone, treated with deionized water and dried.
2.2 Synthesis of electrolyte
The ChCl-EG deep eutectic solvent (DES) was synthetized by mixing ChCl and EG (mole ratio 1:2) together at 333 K until a homogeneous, colorless liquid formed.
The colorless transparent solution was obtained by dissolving a certain amount of SnCl2 and
SbCl3 into the ChCl-EG DES at 333 K until the electrolytes dissolved completely.We can obtained
three ionic liquids: ChCl-EG-SbCl3(contained 0.2M SbCl3), ChCl-EG-SnCl2 (contained 0.2M SnCl2),
2.3 Electrolysis and electrochemical measurements
All electrochemical experiments were conducted in a nitrogen gas-filled glove box (O2 and
H2O < 5 ppm). All electrochemical measurements were carried out using a CHI760C electrochemical
workstation (Shanghai CH Instruments Company, China). Electrochemical studies were based on the analysis of cyclic voltammetric measurements. A three-electrode electrochemical cell was used for these experiments. The glassy carbon electrode (geometric area = 0.1256 cm2) fabricated by inserting a piece of glassy carbon rod into a Teflon tube is working electrode. A platinum wire (Aldrich, 99.9%) is the counter electrode, and the quasi-reference electrode is an Ag wire (Aldrich, 99.99%) placed in a separate fritted glass tube containing pure ChCl-EG deep eutectic solvent (DES) of the same composition as the bulk solution. The glassy carbon working electrode was polished by alumina of 0.05 μm in size, cleaned in an ultrasonic acetone bath, rinsed with distilled water and dried before each measurement.
Bulk electrodeposits were prepared on titanium sheet (Aldrich, 10 mm 10 mm). The titanium electrode was polished with increasingly finer grades of emery paper, and then rinsed with distilled water. All the electrolysis experiments were conducted for 2 h at 343K by constant potential method under stirring. After electrolysis, the product was removed from the cell and washed thoroughly with ethanol and dried.
2.4 Measurement and characterization
The morphology of the Sn-Sb powders was characterized by using a scanning electron microscope (SEM, Hitachi S-4800). SEM samples were prepared by dispersing the sample with ethanol and deposited onto crystal silicon. The amounts of Sn and Sb in the Sn-Sb deposits were determined by inductively coupled plasma atomic emission spectrometry (ICP-AES, Perkin 108 Elmer, 300DV). The phase analysis of the electrodeposition was examined by a Rigaku D/max 2400 X-ray diffractometer (XRD) which uses monochromatic CuKα radiation(λ=1.5406 Å).
3. RESULTS AND DISCUSSION
3.1 Voltammetric analysis
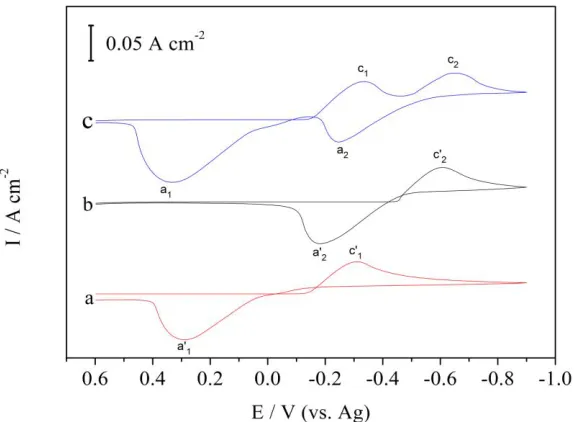
Cyclic voltammograms (CVs) were used to define the major characteristics of the Sn(II) and Sb (III) reduction process. The typical examples of CV are presented in Fig. 1. The Sn and Sb were deposited onto a glassy carbon electrode in ChCl-EG DES containing 0.2 M SnCl2 and 0.2 M SbCl3,
and the CV was recorded at a sweep rate of 75 mV s-1 and 343 K. As shown in Fig. 1a, the ChCl-EG DES containing 0.2 M SbCl3 displays a couple of reduction and oxidation peaks at -0.30 V and 0.30 V
(vs. Ag), which correspond to the deposition and stripping of metal Sb. The existence of a cathodic current loop indicates that nucleation overpotential is required for Sb deposition on the glassy carbon surface. In the ChCl-EG DES containing 0.2 M SnCl2 (Fig. 1b), the reduction and oxidation waves
deposition and stripping of metal Sn. In the ChCl-EG DES containing both SnCl2 and SbCl3, two
separate reduction waves and two oxidation peaks were observed. Furthermore, the cathodic current loop also appeared. The first cathodic wave (c1) with a peak potential at -0.31 V (vs. Ag) is attributed
to the reduction of Sb(III) to Sb.
Figure 1. Cyclic voltammograms recorded at a glassy carbon electrode in ChCl-EG DES at 343K: (a) containing 0.2 M SbCl3; (b) containing 0.2 M SnCl2; (c) containing 0.2 M SbCl3 and 0.2 M
SnCl2. Scan rate is 75 mV s-1.
Results from XRD analysis of the deposits obtained by constant potential electrolysis at -0.31 V indicated that pure Sb was obtained and no metal Sn was observed. The second wave (c2) with
potential range from -0.46 to -0.81 V (vs. Ag) can be assigned to the codeposition of Sb and Sn since two of them could be detected on the deposits by constant potential electrolysis at -0.5 V. In addition, the deposition potentials of Sb (c1) and Sn-Sb codeposition (c2) shift negatively (see table 1), which
demonstrate that reduction of Sb(III) or Sn(II) in this DES is inhibited in the presence of SnCl2 or
SbCl3. It is well known that Sn-Sb codeposition does not occur until the electrode potential reaches the
reduction potential of Sn. When SnCl2 is added to electrolyte, the ternary system becomes a quaternary
system, resulting in ion atmosphere around a Sb(III) complex anion change and reducing its activity. Further, the mole fraction concentration of Sb(III) complex anion decreases with addition of SnCl2.
The reduction potential for a Sb(III) decreases based on the Nernst equation. Similarly, the reduction potential of Sn shifts negatively in the presence of SbCl3. During the reverse the first oxidation peak
(a2) appears with a peak potential at -0.25 V (vs. Ag), which is at a more negative potential than that of
the bulk Sn oxidation. This stripping wave is attributed to the oxidation of Sn-Sb alloys that are more instable toward oxidation than pure Sn. The second oxidation peak (a1) is evident at 0.32 V (vs. Ag),
[image:4.596.149.436.176.387.2]
Table 1. The Initial reduction potential, peak reduction potential(Epc) and Peak reduction current(Ipc)
in ChCl-EG DES on GC electrode at 343K with a potential scan rate of 75 mV s-1.
electrolyte chemical Reaction EInitial / V EpSb(III) / V Ip / A cm-2
ChCl-EG-SbCl3 Sb(III)→Sb0 -0.125 -0.295 0.032
ChCl-EG-SnCl2 Sn(II)→Sn0 -0.430 -0.582 0.034
ChCl-EG-SbCl3-SnCl2
Sb(III)→Sb0
-0.130 -0.312 0.037
Sn(II)→Sn0
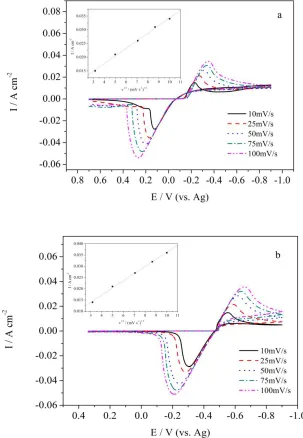
Figure 2. Cyclic voltammograms recorded at glassy carbon electrode in ChCl-EG DES at 343K with different scan rate. The insert shows the linear relationship between the cathodic peak current (Ip) and the square root of the scan rate (ν1/2). (a) containing 0.2 M SbCl3; (b) containing 0.2 M
SnCl2; (c) containing 0.2 M SbCl3 and 0.2 M SnCl2.
To obtain further understanding, the dependence of the CVs of Sb(III) and Sn(II) in ChCl-EG DES recorded on a glassy carbon electrode as a function of sweep rate at 343 K is shown in Fig. 2.
It is observed that with the increase of the scan rate, cathodic peak current (Ip) increases and the
cathodic peak potential (Ep) shifts cathodically. The difference in the value of |Ep - Ep/2|, for the
reduction of Sb(III) , is obviously larger (ca. 89 mV) than expected for a three-electron reversible process (22 mV) at 343 K, indicating that the reduction of Sb(III) in ChCl-EG DES on the glassy carbon electrode is irreversible [19]. Meanwhile, the differences for the reduction of Sn(II) as well as co-reduction of Sn(II) and Sb(III) are considerably larger compared to the theoretical value of 33 mV expected for a two-electron reversible reaction at 343 K, suggesting that these two electrode reactions are also irreversible processes. The relation between the cathodic peak potential (Ep) and the half-peak
potential (Ep/2) for an irreversible reduction reaction is given by Eq. (1) [20]:
nF
RT
.
|
-E
|E
p p/
857
1
2
(1)
where R, T, Ep, Ep/2, , n and F stand for gas constant, absolute temperature, peak potential,
half peak potential, transfer coefficient electron transfer number and Faraday coefficient, respectively. The value of for these irreversible electrode reactions can be calculated according to Eq. (1) and the results are listed in Table 2. The linear dependence of the cathodic peak current (Ip) on the square root
of the scan rate (ν1/2), shown in the inset of Fig. 2a and 2b, confirms that the reduction of Sb(III) or Sn(II) in ChCl-EG DES is a diffusion controlled process [21] and allows the determination of the diffusion coefficient according to the following equation [22]:
2 / 1
496
0 )
RT nFDv nFAc(
. Ip
(2)
[image:6.596.128.431.92.298.2]
where Ip, A, D and c mean the peak current, electrode area, diffusion coefficient and Sb(III) or
Sn(II) concentration, respectively. Substituting the value of n obtained above and other parameters in Eq. (2), the diffusion coefficients, DSb and DSn, of Sb(III) and Sn(II) species in ChCl-EG DES is
respectively determined to be 8.86×10⁻⁷ cm2 s-1 and 2.16×10⁻⁶ cm2 s-1 at 343 K from the slope of the Ip
ν1/2
plot obtained in the inset of Fig. 2a and Fig. 2b. The diffusion coefficient of Sb(III) in this solvent is close to the value in acidic AlCl3-EMIC melts, but greater that in the [Emim]BF4 ionic liquid (see
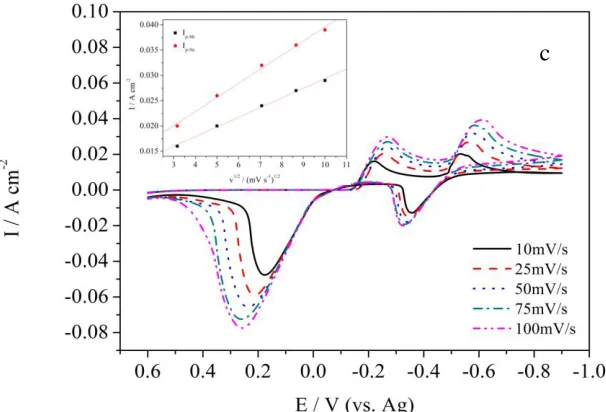
[image:7.596.103.457.293.564.2]Table 3). Analogously, co-reduction of Sb(III) and Sn(II) is also diffusion controlled (see the inset of Fig. 2c). In order to further examine the separate reduction of Sb(III) and Sn(II) in ChCl-EG DES containing both of them, linear sweep voltammetric (LSV) curve was recorded at glassy carbon electrode and well fitted by a Gaussian shape.
Figure 3. Partial current density jSn, jSb and j obtained by peak separation and fitting. The linear sweep
voltammetric (LSV) curve was recorded at glassy carbon electrode at 343K. Scan rate is 75 mV s-1.
The results are shown in Fig. 3. By means of separatining two sub-currents(jFitting-Sn,jFitting-Sb)
from the total current(jExperiment), we can know that the two reduction reactions of Sb(III) and Sn (II)
as they coexist in DES, which may be mainly due to the synergistic action of them and the change in activity coefficient of metal ions.
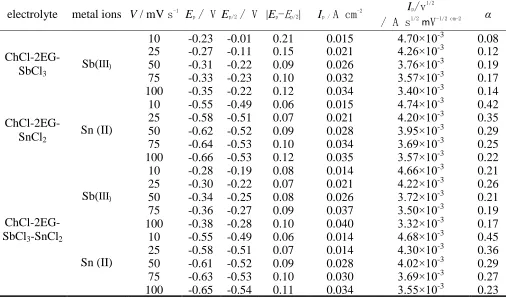
Table 2. The parameters obtained from CVs of Sb(III) or Sn(II) in ChCl-EG DES recorded at a GC electrode at 343K.
electrolyte metal ions V / mV s-1 Ep / V Ep/2 / V |Ep-Ep/2| Ip / A cm
-2 Ip/v
1/2
/ A s1/2
mV-1/2 cm-2 α
ChCl-2EG- SbCl3
Sb(III)
10 -0.23 -0.01 0.21 0.015 4.70×10⁻³ 0.08
25 -0.27 -0.11 0.15 0.021 4.26×10⁻³ 0.12
50 -0.31 -0.22 0.09 0.026 3.76×10⁻³ 0.19
75 -0.33 -0.23 0.10 0.032 3.57×10⁻³ 0.17
100 -0.35 -0.22 0.12 0.034 3.40×10⁻³ 0.14
ChCl-2EG- SnCl2
Sn (II)
10 -0.55 -0.49 0.06 0.015 4.74×10⁻³ 0.42
25 -0.58 -0.51 0.07 0.021 4.20×10⁻³ 0.35
50 -0.62 -0.52 0.09 0.028 3.95×10⁻³ 0.29
75 -0.64 -0.53 0.10 0.034 3.69×10⁻³ 0.25
100 -0.66 -0.53 0.12 0.035 3.57×10⁻³ 0.22
ChCl-2EG- SbCl3-SnCl2
Sb(III)
10 -0.28 -0.19 0.08 0.014 4.66×10⁻³ 0.21
25 -0.30 -0.22 0.07 0.021 4.22×10⁻³ 0.26
50 -0.34 -0.25 0.08 0.026 3.72×10⁻³ 0.21
75 -0.36 -0.27 0.09 0.037 3.50×10⁻³ 0.19
100 -0.38 -0.28 0.10 0.040 3.32×10⁻³ 0.17
Sn (II)
10 -0.55 -0.49 0.06 0.014 4.68×10⁻³ 0.45
25 -0.58 -0.51 0.07 0.014 4.30×10⁻³ 0.36
50 -0.61 -0.52 0.09 0.028 4.02×10⁻³ 0.29
75 -0.63 -0.53 0.10 0.030 3.69×10⁻³ 0.27
[image:8.596.46.552.192.490.2]100 -0.65 -0.54 0.11 0.034 3.55×10⁻³ 0.23
Table 3. Comparison of the diffusion coefficient of Sb(III) and Sn(II) ions in various solution system.
electrolyte metal ions
ions ionss T / K α D / cm
-2 S-1
references ChCl-EG-SbCl3 Sb(III) 343 0.140 8.86×10
-7
This work ChCl-EG-SnCl2 Sn(II) 343 0.306 2.16×10
-6
This work ChCl-EG-SbCl3-SnCl2
Sb(III) 343 0.208 7.77×10⁻⁷
This work
Sn(II) 343 0.321 2.01×10⁻⁶ This work
AlCl3-[EMIm]Cl-SbCl3 Sb(III) 303 6.88×10
-7 T. Katayama, S. Dan, T. Miura
[23] AlCl3-[EMIm]Cl-SnCl2 Sn(II) 313 5.30×10
-7
X. H. Xu, C. L. Hussey [24] [EMIm]BF4-SbCl3 Sb(III) 298 0.508 1.96×10
-7
W. Z. Yang,H. Cang [25] [EMIm]BF4-SnCl2 Sn(II) 298 0.537 6.07×10
[image:8.596.49.550.543.734.2]
3.2 Electrodeposition of Sn-Sb alloy
The electrodeposition of Sn-Sb on a titanium substrate in ChCl-EG containing 0.2 M SbCl3 and
0.2 M SnCl2 were performed using different potentials for 2 h. The compositions of these deposits
were analyzed by ICP-AES.
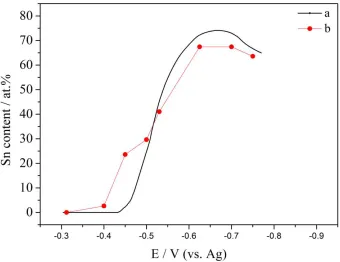
Figure 4. Relationship between the deposition potential and Sn content of the Sn-Sb alloys (a) theoretical value calculated from partial current densities; (b) experimental value. Bulk electrodeposits were prepared on titanium sheet at 343K.
Fig. 4 shows an abridged summary of the composition of the electrodeposited Sb-Sn alloys as a function of the deposition potential. It is obvious that the Sn content of electrodeposited Sn-Sb deposits increase as the deposition potential increased from -0.31 to -0.63 V, and then decreases at potential more negative -0.7 V. This result can be reconciled in part by comparing the diffusion coefficient of Sb(III) with that of Sn(II) in the DES. It is clear from the above analysis results that the diffusion coefficient of Sn(II) is larger than that of Sb(III). This fact is also corresponded to Xu's study about the electrodeposition of Zn-Ti alloy in the ZnCl2-urea-TiCl4 ionic liquid[26], that the Ti content in Zn-Ti
alloy increases with increasing potential from -1.3 to -1.8 V, but the Ti content tends to decrease as potential increased from -1.8 to -2.2 V.
In addition, it can be seen from the Fig. 3 that the LSV recorded at GC electrode was well fitted using two peak (c1 and c2).The total current density (jt) is divided into two parts: the partial current
[image:9.596.118.458.226.488.2]
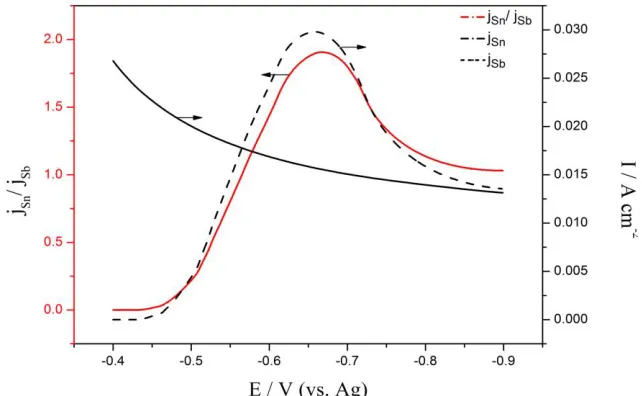
Figure 5. Variation of jSn and jSn/jSb with the deposition potential recorded at glassy carbon electrode in
ChCl-EG DES at 343K.
Considering the different working electrode used in LSV and deposition experiment, the data in Fig. 3 only provides a qualitative analysis for the observation, the Sn content of the electrodeposited Sn–Sb alloys vary with current density or potential. Through analyzing and processing the data from Fig. 3, the –jSn, –jSb and –jSn/−jSb were obtained as the function of deposition potential and shown in
Fig. 5. The –jSn and –jSn/−jSb respectively increased with deposition potential up to −0.66 V and -0.67
V, then decreased.
The Sn content (mole fraction) in the electrodeposited Sn-Sb alloy was analyzed by combining the Faraday’s law and partial current densities Eqs. (3-6). The theoretical weight (m) gain on the cathode is expressed by Faraday’s law
It nF M Q nF M
m
(3)
Where Q, F, M and n are the electric quantity (C), Faraday constant, atomic weight of deposited metal and number of electron exchanged, respectively. The mole fraction of Sn in the Sn-Sb alloy was calculated by using the following expressions.
) ( Sb Sb Sn Sn Sn Sn Sn M m M m M m x
(4)
Where xSn is the mole fraction of Sn in the Sn-Sb alloy; mSn and mSb are the weight of Sn and
Sb, respectively; Msn and MSb represent the atomic weight of the quality of Sn and Sb, respectively. By
substituting Eq. (3) into Eq. (4) and rearranging it, the relationship between xSn (xSb) and partial current
densities was obtained as follow [14]:
Sn Sb Sn j j x 3 2 1 1
[image:10.596.151.472.95.293.2]
Sn Sb x
x 1
( 6)
Where xSb is the mole fraction of Sn in the Sn-Sb alloy; the jSn and jSb represent the partial
current densities for Sn and Sb, respectively.
In order to insight into the dependence of the Sn content of the alloy on deposition potential, the partial current densities in Fig. 5 were converted to theoretical composition data using the Eq. (5). Plots of xSn vs deposition potential are also shown in Fig. 4 and they are in accord with that of the
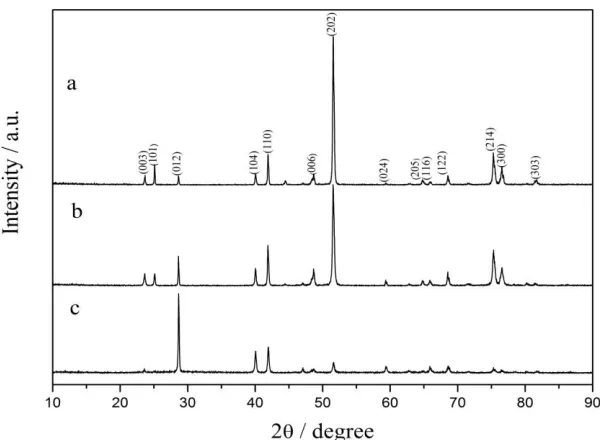
experimental data. This analysis provides a qualitative explanation for the general result that composition in alloys varies with deposition potential or current density. The electrodeposits containing 0-67 atom% Sn were examined by XRD, and the diffraction patterns for selected deposits are shown in Fig. 6. All of the deposits have diffraction patterns that can be indexed to a hexagonal structure very similar to that of pure antimony, indicating that the Sn-Sb alloy is a single phase, solid solution. Since the solubility of Sn is very high in Sb and the difference of atomic radius between Sn and Sb is very small at room temperature, the observed single phase Sn-Sb alloys must be solid solutions.
Figure 6. XRD patterns from the pure Sb and Sn-Sb alloy containing different Sn content: (a) pure Sb; (b) 29.7 at.% Sn; (c) 67.0 at.% Sn.
[image:11.596.139.439.352.572.2]
Figure 7. Lattice parameters for Sb as a function of Sn-Sb alloy composition.
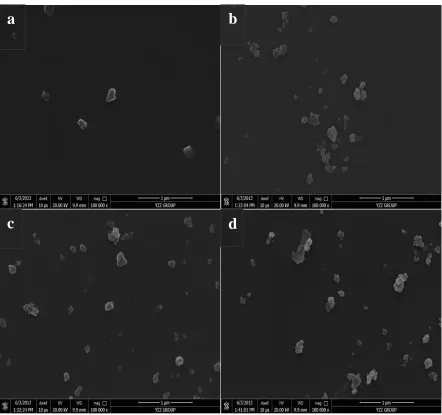
Figure 8. Surface SEM micrographs of the Sn-Sb deposits with different Sn content obtained at various potential at 343K; (a) 23.5 at.% Sn, -0.45 V; (b) 67.5 at.% Sn, -0.63 V; (c) 67.3 at.% Sn, -0.70 V; (d) 63.4 at.% Sn, -0.75 V.
c
d
[image:12.596.171.433.84.228.2] [image:12.596.78.520.259.674.2]
Fig. 8 shows the surface morphology of Sn-Sb alloy electrodeposited on Cu substrate at different deposition potentials from ChCl-EG DES containing 0.2 M SnCl2 and 0.2 M SbCl3. It can be
found from Fig. 8 that the surface morphology is independent on the deposition potential and Sn content. When the deposition potential is -0.45 V, Sn-Sb alloy nanoparticles of diameter ranging approximately from 100 to 150 nm are formed. With the deposition potential negative shift, the deposited Sn-Sb alloy particles do not grow up obviously.
4. CONCLUSIONS
In this paper, we have demonstrated, for the first time, that sub-micrometer Sn-Sb alloy powder can be electrochemically preparation in ChCl-EG DES with antimony chloride and tin chloride as the precursors. The electroreduction behavior of Sn(III) and Sb(II) in this DES was found to be a diffusion controlled irreversible process. The diffusion coefficient value of either Sb(III) or Sn(II) species slightly decrease as they both coexist, which may be mainly due to the synergistic actions of them and the change in activity coefficients of metal ions. The electrodeposition potential played a central role in tuning the composition of alloy, but had little effect on their surface morphology. Depending on the deposition potential, sub-micrometer Sn-Sn alloy powders with Sn content varying from 2.7 to 67.4 at% can be obtained. The results observed in this study suggest that the ChCl based DESs may be a kind of promising media for electrochemical preparation of submicrometer Sn-Sb alloy powders. ACKNOWLEDGEMENT
The authors gratefully acknowledge the financial support of the National Natural Science Foundation of China (Project No. 21263007, 51274108).
References
1. P. Patel, S. Roy, L. S. Kim, P. N. Kumta, Materials Science & Engineering B, 111 (2-3) (2004) 237-241.
2. N. Nitta, G. Yushin, Particle & Particle Systems Characterization, 31 (3) (2014) 317-336. 3. J. Yang, Y. Takeda, Q. Li, N. Imanishi, O. Yamamoto, Solid State Ionics, 135 (1-4) (2000)
175-180.
4. J. O. Besenhard, J. Yang, M. Winter, J. Power Sources, 68 (1997) 87-90.
5. I. Rom, M. Wachtler, I. Papst, M. Schmied, J. O. Besenhard, F. Hofer, M. Winter, Solid State Ionics, 143 (3-4) (2001) 329-336.
6. Z. Wang, W. H. Tian, X. G. Li, Phys Chim. Sin. Acta, 22 (6) (2006) 752-755.
7. W. Z. Yang, H. Cang, Y. M. Tang, J. T. Wang, Y. X. Shi, Modern Chemical Industry, 27 (2) (2007) 203-206.
8. A. Sulcius, E. Griskonis, R. Balciunas, P. Diaz-Arista, Transactions of the IMF, 92 (1) (2014) 20-28.
9. S. Wang, C. Zeng, Y. Ling, J. Wang, G. Xu, Surface & Coatings Technology, 286 (2016) 36-41. 10. A. M. Alfantazi, A. Shakshouki, J. Electrochem. Soc., 149 (10) (2002) C506-C510.
11. C. Lupi, M. Pasquali, A. Dell’Era, Miner. Eng., 19 (12) (2006) 1246-1250.
12. P. X. Yang, M. Z. An, S. M. Liang, Eelectroplat & Pollut. Control, 26 (5) (2006) 1-5.
13. M. Tulodziecki, J. M. Tarascon, P. L. Taberna, 223rd ECS Meeting Manchester. Soc., ( 2013) 237. 14. S. Rao, Y. X. Hua, C. Y. Xu, P. Q. Li, J. J. Ru, K. Gong, J. Materials Science & Engineering, 31
15. R. A. Robinson, R. H. Stokes, Electrolyte solutions, Mineola, Dover Pub (2011).
16. A. P. Abbott, G. Capper, D. L. Davies, R. K. Rasheed, V. Tambyrajah, Chemical Communications, 1 (1) (2003) 70-71.
17. A. P. Abbott, D. Boothby, G. Capper, D. L. Davies, R. K. Rasheed, J. Am. Chem. Soc., 126 (126) (2004) 9142-7.
18. Z. Zhang, J. Li, Y. X. Hua, J. Kunming University of Science and Technology, 38 (6) (2013) 6. 19. J. F. Huang, I. W. Sun, J. Electrochemical. Soc., 149 (9) (2002) E348—E355.
20. X. Y. Tong, L. Z. Liu, C. W. Xu, G. H. Liu, Q. Q. Yang, Trans Nonfer. Metal. Soc., 11 (3) (2001) 451-454.
21. C. A. Zell, W. Freyland, Chem. Phys. Lett., 337 (2001) 293.
22. A. J. Bard, L. R. Faulkner, Electrochemical Methods-Fundamentals and Applications, John Wiley&Sons, New York (2001).
23. Y. Katayama, S. Dan, T. Miura,T. Kishi, J. Electrochem. Soc., 148 (2) (2001) C102-C105. 24. X. H. Xu, C. L. Hussey, J. Electrochem. Soc., 140 (3) (1993) 618-626.
25. W. Yang, H. Cang, Y. Cang, J. Wang, Y. Shi, J. Appl. Electrochem, 38 (2008) 537-542. 26. C. Xu, Q. Wu, Y. Hua, J. Li, J. Solid State Electrochemistry, 18 (8) (2014) 2149-2155.