RESEARCH NOTE
miR-MaGiC improves quantification
accuracy for small RNA-seq
Pamela H. Russell
1*, Brian Vestal
5, Wen Shi
2, Pratyaydipta D. Rudra
1, Robin Dowell
3, Richard Radcliffe
4,
Laura Saba
4and Katerina Kechris
1Abstract
Objective: Many tools have been developed to profile microRNA (miRNA) expression from small RNA-seq data. These tools must contend with several issues: the small size of miRNAs, the small number of unique miRNAs, the fact that similar miRNAs can be transcribed from multiple loci, and the presence of miRNA isoforms known as isomiRs. Methods failing to address these issues can return misleading information. We propose a novel quantification method designed to address these concerns.
Results: We present miR-MaGiC, a novel miRNA quantification method, implemented as a cross-platform tool in Java. miR-MaGiC performs stringent mapping to a core region of each miRNA and defines a meaningful set of target miRNA sequences by collapsing the miRNA space to “functional groups”. We hypothesize that these two features, mapping stringency and collapsing, provide more optimal quantification to a more meaningful unit (i.e., miRNA fam-ily). We test miR-MaGiC and several published methods on 210 small RNA-seq libraries, evaluating each method’s abil-ity to accurately reflect global miRNA expression profiles. We define accuracy as total counts close to the total number of input reads originating from miRNAs. We find that miR-MaGiC, which incorporates both stringency and collapsing, provides the most accurate counts.
Keywords: MicroRNA, miRNA, Small RNA-seq, Expression quantification
© The Author(s) 2018. This article is distributed under the terms of the Creative Commons Attribution 4.0 International License (http://creat iveco mmons .org/licen ses/by/4.0/), which permits unrestricted use, distribution, and reproduction in any medium, provided you give appropriate credit to the original author(s) and the source, provide a link to the Creative Commons license,
and indicate if changes were made. The Creative Commons Public Domain Dedication waiver (http://creat iveco mmons .org/
publi cdoma in/zero/1.0/) applies to the data made available in this article, unless otherwise stated. Introduction
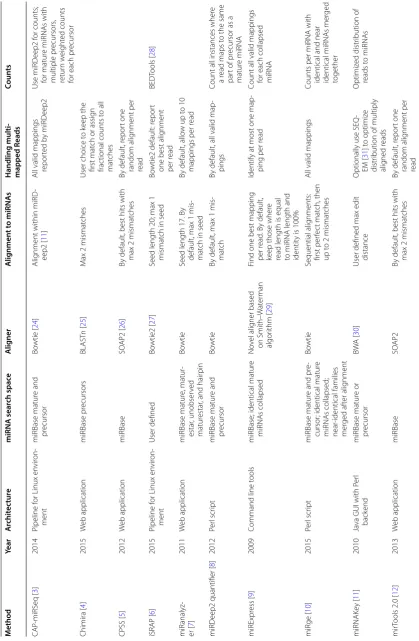
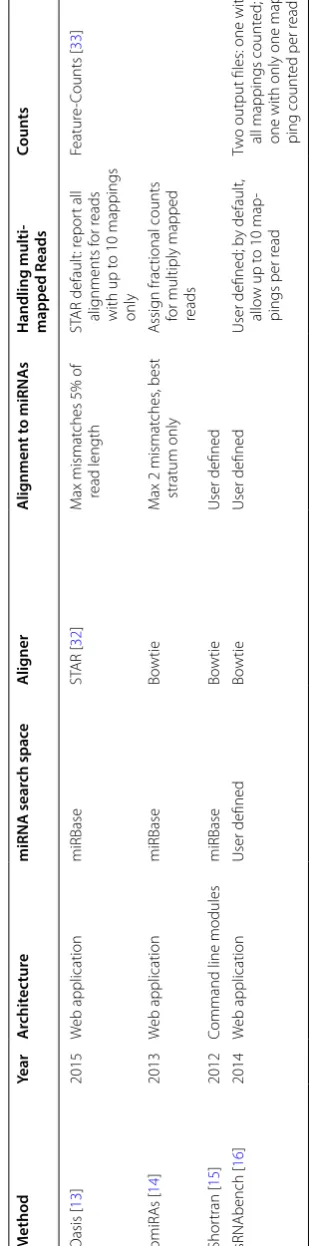
MicroRNAs (miRNAs) are endogenous small (~ 23 nt) RNA molecules that contribute to post-transcriptional regulation of target messenger RNAs (mRNAs) in plants and animals [1, 2]. In recent years, many tools have been developed to estimate miRNA expression from small RNA-seq data. These include CAP-miRSeq [3], Chimira [4], CPSS [5], iSRAP [6], miRanalyzer [7], the miRDeep2 quantifier [8], miRExpress [9], miRge [10], miRNAKey [11], mirTools [12], Oasis [13], omiRAs [14], Shortran [15], and sRNAbench [16]. Table 1 summarizes these methods. In a typical workflow, the read counts form the foundation for downstream analyses such as differ-ential expression and co-expression analysis. Therefore,
accurate expression quantification is essential for the validity of downstream results.
The effectiveness of quantification methods may be affected by three issues particular to miRNAs. One issue involves mapping accuracy. The small size of miRNA molecules leads to short sequencing reads after adapter removal. Short reads are less likely to be aligned uniquely to the genome [17]; this issue could be compounded by individual genetic variation at the endogenous locus producing the read [18]. The second issue involves chal-lenges of functional interpretation. Identical or near-identical miRNAs are often transcribed from multiple genomic loci [19, 20]. So as not to introduce count bias, quantification methods must deal with reads that map ambiguously to multiple loci or miRNA sequences. In addition, there are many fewer unique miRNA molecules than large RNAs. Normalization methods such as total read count or quantile normalization are less robust with fewer features and highly skewed distributions. There-fore, the handling of multi-mapped reads can have a
Open Access
*Correspondence: [email protected]
1 Department of Biostatistics and Informatics, Colorado School of Public Health, Aurora, CO 80045, USA
Table 1 miRNA quan tific ation metho ds f or small RNA -seq M ethod Year A rchit ec tur e miRNA sear ch spac e A lig ner A lig nmen t t o miRNA s
Handling multi- mapped R
eads Coun ts CAP -miRS eq [ 3 ] 2014 Pipeline f
or Linux en
vir on-ment miRBase matur e and pr ecursor Bo wtie [ 24 ] Alig
nment within miRD
-eep2 [
11
]
All valid mappings repor
ted b y miRD eep2 Use miRD eep2 f or counts; for matur e miRNA s with multiple pr ecursors , retur n w eight ed counts
for each pr
ecursor Chimira [ 4 ] 2015 W eb application miRBase pr ecursors BLAST n [ 25 ] M
ax 2 mismat
ches
User choice t
o k
eep the
first mat
ch or assig
n
frac
tional counts t
o all mat ches CPSS [ 5 ] 2012 W eb application miRBase SO AP2 [ 26 ]
By default, best hits with max 2 mismat
ches
By default, r
epor t one random alig nment per read iSRAP [ 6 ] 2015 Pipeline f
or Linux en
vir on -ment User defined Bo wtie2 [ 27 ]
Seed length 20; max 1 mismat
ch in seed
Bo
wtie2 default: r
epor
t
one best alig
nment per r ead BED Tools [ 28 ] miR analyz-er [ 7 ] 2011 W eb application miRBase matur e, matur -estar , unobser ved matur estar
, and hair
pin
Bo
wtie
Seed length 17. B
y
default, max 1 mis
-mat
ch in seed
By default, allo
w up t
o 10
mappings per r
ead
miRD
eep2 quantifier [
8 ] 2012 Per l scr ipt miRBase matur e and pr ecursor Bo wtie
By default, max 1 mis
-mat
ch
By default, all valid map
-pings
Count all instances wher
e
a r
ead maps t
o the same
par
t of pr
ecursor as a
matur e miRNA miRExpr ess [ 9 ] 2009
Command line t
ools
miRBase; identical matur
e miRNA s collapsed No vel alig ner based on Smith– W at er man algor ithm [ 29 ]
Find one best mapping per r
ead
. B
y default,
keep those wher
e
read length is equal to miRNA length and identit
y is 100%
Identify at most one map
-ping per r
ead
Count all valid mappings for each collapsed miRNA
miRge [ 10 ] 2015 Per l scr ipt miRBase matur
e and pr
e-cursor
; identical matur
e miRNA s collapsed; near -identical families mer ged af ter alig nment Bo wtie Sequential alig nments: first per fec t mat ch, then up t
o 2 mismat
ches
All valid mappings
Counts per miRNA with identical and near identical miRNA
s mer ged together miRNAK ey [ 11 ] 2010 Ja
va GUI with P
er l back end miRBase matur e or pr ecursor BWA [ 30 ]
User defined max edit distance
Optionally use SEQ
-EM [ 31 ] t o optimiz e distr
ibution of multiply
alig ned r eads Optimiz ed distr ibution of reads t o miRNA s mir
Tools 2.0 [
12 ] 2013 W eb application miRBase SO AP2
By default, best hits with max 2 mismat
ches
By default, r
epor
t one
random alig
nment per
[image:2.595.69.489.87.729.2]Implemen
ta
tion details of sev
er
al r
ec
en
tly published methods f
or miRNA e
xpr
ession quan
tifica
tion fr
om small RNA
-seq
Table
1
(c
on
tinued)
M
ethod
Year
A
rchit
ec
tur
e
miRNA sear
ch spac
e
A
lig
ner
A
lig
nmen
t t
o miRNA
s
Handling multi- mapped R
eads
Coun
ts
Oasis [
13
]
2015
W
eb application
miRBase
ST
AR [
32
]
M
ax mismat
ches 5% of
read length
ST
AR default: r
epor
t all
alig
nments f
or r
eads
with up t
o 10 mappings
only
Featur
e-Counts [
33
]
omiRA
s [
14
]
2013
W
eb application
miRBase
Bo
wtie
M
ax 2 mismat
ches
, best
stratum only
A
ssig
n frac
tional counts
for multiply mapped reads
Shor
tran [
15
]
2012
Command line modules
miRBase
Bo
wtie
User defined
sRNAbench [
16
]
2014
W
eb application
User defined
Bo
wtie
User defined
User defined; b
y default,
allo
w up t
o 10 map
-pings per r
ead
Tw
o output files: one with all mappings count
ed;
one with only one map
-ping count
ed per r
[image:3.595.220.375.98.723.2]larger impact on normalized counts for miRNAs com-pared to larger RNAs. Third, isomiRs—miRNA variants that can be expressed in a cell type specific manner— present a challenge for mapping and functional inter-pretation. Research suggests that the three main classes of isomiRs (5′ isomiRs, 3′ isomiRs, and polymorphic isomiRs) may have differing functional consequences [21, 22]. The question of whether isomiRs should be counted and, if so, which ones should be merged with their parent miRNA for expression analysis, is nontrivial and should be addressed by quantification methods.
Methods that fail to adequately address these issues can return misleading quantification results. We examined the accuracy of several published methods as well as a novel quantification pipeline that incorporates stringent mapping and collapsing of the miRNA space into mean-ingful functional units.
Main text Results
We designed a quantification method with the following objectives: (1) perform highly stringent mapping to a core region of miRNA sequences, minimizing the number of ambiguous mappings, and (2) perform collapsing to asso-ciate reads with functional classes of miRNAs instead of individual annotated miRNAs. Functional classes of miR-NAs, subsequently referred to as “functional groups”, are defined by the user to be groups of miRNAs that are con-sidered equivalent in the context of the study goals. For instance, if the study aims to address binding of target mRNAs, families of highly similar miRNAs that bind the same targets can be considered equivalent. This consid-eration allows reads to be counted at most once per func-tional group; counts are then returned at the group level. We implemented a pipeline, miR-MaGiC, that incorpo-rates these features. For details of the software and work-flow, see Additional file 1: Additional material and Figure S1.
We tested miR-MaGiC and several publicly available methods on 210 mouse brain small RNA-seq libraries. This dataset was chosen due to the large number of sam-ples and high sequencing depth, making it a valuable test case for comparing methods, while the variability in proportion of miRNA reads between libraries provided an interesting testing scenario. We ran 7 quantification schemes for each library: iSRAP [6], the miRDeep2 quan-tifier [8], miRge [10], a modified version of miRge, and three collapsing conditions for miR-MaGiC. Our modi-fied version of miRge removed its final round of align-ments to mature miRNAs, a highly permissive alignment step that allowed up to two mismatches per read; we sus-pected that this step may introduce noise to the counts. See Additional file 1: Table S1 and Additional material.
To evaluate the methods, we reasoned that methods which correctly handle the issues particular to miRNA quantification should return total counts that reflect the number of reads originating from miRNAs in the input library. We estimated the number of miRNA reads in each library as the number of adapter-clipped reads between 19 and 23 nucleotides in length; 95% of miRNA loci and 91% of unique mature miRNAs in miRBase fall in this length range. The libraries each had between 50% and 72% of reads in this range. We examined how well each method reflected this estimated number of input miRNA reads in terms of total output read count, calculating the mean squared error between the estimated number of input miRNA reads and the output total counts. A lower score would indicate more accurate counts and therefore less distortion and bias introduced during normalization by the method-dependent total count.
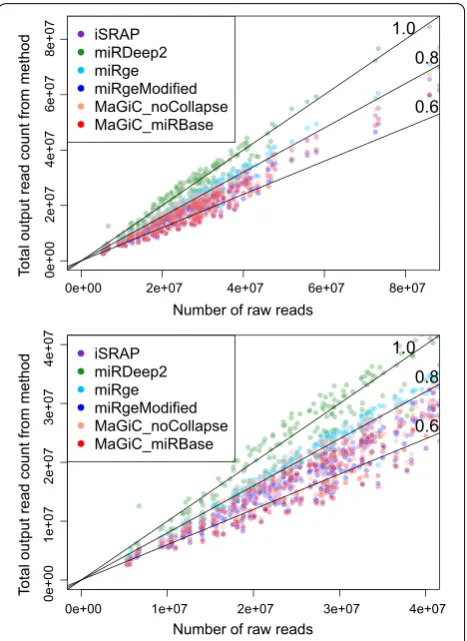
Due to different implementation choices, the meth-ods systematically return different levels of total abso-lute counts (Fig. 1). The miRDeep2 quantifier returns the highest counts because it first matches mature miRNAs to precursors in a many-to-many mapping, then counts every instance of a read matching one of these mature miRNA/precursor pairs. As expected, miR-MaGiC returns reduced total counts when functional group collapsing is performed, as opposed to no collapsing. Because the read counts for miRNAs are right skewed (Additional file 1: Figure S2), double counting in any of the highly expressed miRNAs can dramatically change the total read count. See Additional file 1: Additional material and Figure S3 for a case study of miRNAs that are treated differently by different methods.
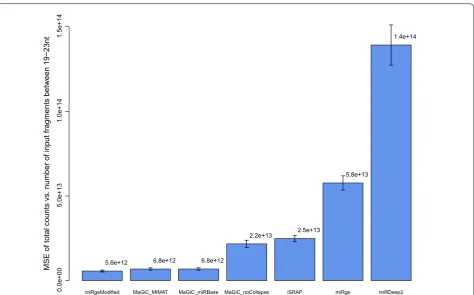
Comparing MaGiC to published software, miR-MaGiC with collapsing by functional group showed the best accuracy (Fig. 2). The least accurate method is the miRDeep2 quantifier, probably due to double count-ing reads that map to multiple precursors. The closest method to miR-MaGiC is miRge, which also incorporates collapsing but uses permissive mapping. As expected, miR-MaGiC with no functional group collapsing is less accurate than with collapsing. When we modified the miRge code to remove the final round of highly permis-sive alignments, performance improved dramatically and the method gained a slight advantage over miR-MaGiC with collapsing. One possible explanation for why the published version of miRge is less accurate than the more stringent modified version is that the permissive align-ment step allows some non-miRNA reads to be mapped to miRNAs.
Conclusions
including their small size, low complexity, family struc-ture, and isoforms. miR-MaGiC uses stringent mapping to reduce noise associated with the small size and low complexity of miRNAs, while allowing for uncertainty at the endpoints of reads and miRNAs. Final counts are returned at the group level instead of the individual miRNA level. Recommended group tables are provided for common species on the miR-MaGiC web page, https ://githu b.com/Kechr isLab /miR-MaGiC .
We tested miR-MaGiC as well as three published meth-ods on a set of 210 small RNA-seq libraries. We evaluated
the faithfulness of the final total counts to the original number of miRNA reads per library. Importantly, we found that methods which specifically address the above issues produced the greatest accuracy in overall counts. The novelty of miR-MaGiC is the combination of strin-gent mapping to a core region of each miRNA and col-lapsing by functional group.
To evaluate this combination of features we tested miR-MaGiC with and without collapsing, observing that collapsing in fact improves accuracy. Regarding map-ping stringency, the published version of miRge, which performs collapsing, performed poorly according to our accuracy metric, but we suspected this may be due to over-permissiveness of one of its alignment steps. Once we modified this detail, miRge emerged as comparable to miR-MaGiC, with a slight advantage in accuracy. In sum-mary, when methods use one feature but not the other (i.e., miR-MaGiC_noCollapse and miRge in Fig. 2), or neither feature (i.e., iSRAP and miRDeep2 in Fig. 2) there is a notable drop in accuracy.
Our analysis of miRge indicated that more noise than signal is introduced if methods try to capture isomiRs simply by allowing more mismatches. miR-MaGiC uses stringent mapping to reduce noise associated with the small size and low complexity of miRNAs. This deci-sion effectively causes 5′ and 3′ isomiRs to be merged with their parent miRNA while discarding polymorphic isomiRs. 3′ isomiRs are the most common class of isomiR and are thought to be largely functionally redundant, while 5′ and polymorphic isomiRs are less common but can affect target binding [21, 22]. Therefore, miR-MaGiC merges most functionally redundant miRNA isoforms with their parent miRNA while also possibly including 5′
isoforms that may affect function. This decision has the effect of including the largest class of isomiRs which are currently believed to be largely functionally redundant while excluding polymorphic isomiRs which may have distinct functions.
Discussion
In this work, we examined accurate quantification of miRNA expression based on sequencing. Several issues particular to miRNAs can affect the accuracy of quan-tification methods based on small RNA-seq. These issues include the small size of miRNAs, the low com-plexity of the overall repertoire of miRNAs, the fact that highly similar miRNAs can be processed from different genomic loci, and the presence of isomiRs. Furthermore, it is important that quantification be performed at an appropriate level of granularity to be functionally meaningful. Implementation choices at the quantification step can have a significant impact on common downstream steps such as normalization and Number of raw reads
To
tal output read count from method
1.0 0.8 0.6
●
●
●
●
● ●
iSRAP miRDeep2 miRge miRgeModified MaGiC_noCollapse MaGiC_miRBase
0e+00 2e+07 4e+07 6e+07 8e+07
0e+00
2e+07
4e+07
6e+0
78
e+07
0e+00 1e+07 2e+07 3e+07 4e+07
0e+00
1e+07
2e+07
3e+07
4e+07
Number of raw reads
To
tal output read count from method
1.0 0.8 0.6
●
●
●
●
● ●
iSRAP miRDeep2 miRge miRgeModified MaGiC_noCollapse MaGiC_miRBase
[image:5.595.58.292.87.408.2]interpretation of expression results. When counts are split over multiple features, the multiple testing bur-den is increased and statistical power is reduced. In addition, the relatively low complexity of the miRNA repertoire means that a handful of highly expressed miRNAs can have an impact on the library size used for normalization.
Our work demonstrates the importance of identifying the most meaningful unit of information when studying miRNA expression. We find that results are most accu-rate when we associate each read with one meaningful unit such as a miRNA family. To accomplish this, our proposed method, miR-MaGiC, looks for a stringent match to one or more members of the family and then ignores which member(s) it matched and reports results for the family. The mapping is stringent in one sense, but also flexible at the ends of each miRNA, as these can be affected by isomiRs or artifacts in the reads. The most meaningful level of granularity for a particular study may vary. We therefore recommend that investigators under-stand the implementation details of various quantifica-tion methods and choose a method that will return the most meaningful expression profile for their study.
Materials and methods
Known miRNAs and creation of individualized miRNA sequences
We used the mouse miRNA database in miRBase version 21 [23]. See Additional file 1 for details.
Defining functional groups of miRNAs
Our pipeline, miR-MaGiC, counts mappings of reads to functional groups of miRNAs instead of individual miR-NAs. We evaluated three different groupings of miRmiR-NAs. The first was no collapsing by functional group. The sec-ond combined miRNAs with the same miRBase acces-sion number (“MIMAT” number) before an underscore. The final grouping combined miRNAs with the same core number, letter (if applicable), and 3p/5p identifier. See Additional file 1 for details.
Test with publicly available software packages
We chose publicly available methods to include in our comparison based on several criteria: (1) ability to be run in batch jobs on a Linux cluster, (2) success of installa-tion and execuinstalla-tion on our Linux environment, and (3) miRgeModified MaGiC_MIMAT MaGiC_miRBase MaGiC_noCollapse iSRAP miRge miRDeep2
MSE of total counts vs
. number of input fragments between 19−23nt
0.0e+0
0
5.0e+1
31
.0e+14
1.5e+14
5.6e+12 6.8e+12 6.8e+12
2.2e+13 2.5e+13
5.8e+13
1.4e+14
[image:6.595.64.539.85.380.2]methods representing a variety of quantification strate-gies. These criteria led to choosing iSRAP [6], the miR-Deep2 quantifier [8], and miRge [10]. 210 mouse whole brain small RNA-seq libraries were analyzed. Run details are in Additional file 1: Table S1 and Additional material.
Limitations
Our analysis demonstrates that for short sequences from a low-complexity repertoire, a high level of mapping stringency is important for minimizing noise. However, a limitation of this high stringency is that errors in reads or individual variation in miRNAs could lead to incorrectly missed read mappings, i.e., an increase in false negative mappings. Another limitation is that miR-MaGiC only generates counts and does not perform analyses such as normalization and differential expression, in contrast to other small RNA-seq analysis tools that perform multiple analyses in a pipeline fashion. Nonetheless, the resulting miR-MaGiC quantification is easily plugged into other downstream analyses.
Abbreviations
miRNA: microRNA; mRNA: messenger RNA; MSE: mean squared error; RPM: reads per million.
Authors’ contributions
PHR carried out the analysis and took the lead with writing the manuscript. BV, WS, and PDR provided feedback on the development of the analysis and interpretation of results. RR and RD generated the genetic data for the study. PHR, LS and KK conceived the analysis and LS and KK were in charge of overall direction and planning. All authors read and approved the final manuscript.
Author details
1 Department of Biostatistics and Informatics, Colorado School of Public Health, Aurora, CO 80045, USA. 2 Computational Bioscience Program, Univer-sity of Colorado, Aurora, CO 80045, USA. 3 Department of Molecular, Cellular, and Developmental Biology, University of Colorado, Boulder, CO 80309, USA. 4 Department of Pharmaceutical Sciences, University of Colorado Skaggs School of Pharmacy and Pharmaceutical Sciences, Aurora, CO 80045, USA. 5 Center for Genes, Environment and Health, National Jewish Health, Denver, CO 80206, USA.
Acknowledgements
We thank Spencer Mahaffey, University of Colorado Skaggs School of Phar-macy, for his assistance in making the sequencing data available over the Web.
Competing interests
The authors declare they have no competing interests.
Availability of data and materials
The sequencing data supporting the conclusions of this article are available for download at https ://pheno gen.ucden ver.edu/Pheno Gen/web/sysbi o/ resou rces.jsp?secti on=pub&publi catio n=150 or http://bit.ly/2vSu0 a6. miR-MaGiC software is distributed under the MIT license at https ://githu b.com/ Kechr isLab /miR-MaGiC . The software is written in Java and is platform-inde-pendent, requiring only Java 8 or higher and Snakemake.
Additional file
Additional file 1. Additional materials, methods, figures, and tables.
Consent to publish
Not applicable.
Ethics approval and consent to participate
Not applicable.
Funding
This work was supported by the National Institute on Alcohol Abuse and Alcoholism of the National Institutes of Health (Grant Numbers R01AA021131, R01AA016957). WS acknowledges support from National Library of Medicine Institutional Training Grant (Grant Number T15LM009451).
Publisher’s Note
Springer Nature remains neutral with regard to jurisdictional claims in pub-lished maps and institutional affiliations.
Received: 22 March 2018 Accepted: 9 May 2018
References
1. Bartel DP. MicroRNAs: genomics, biogenesis, mechanism, and function. Cell. 2004;116:281–97.
2. Bartel DP. MicroRNAs: target recognition and regulatory functions. Cell. 2009;136:215–33. https ://doi.org/10.1016/j.cell.2009.01.002.
3. Sun Z, Evans J, Bhagwate A, Middha S, Bockol M, Yan H, et al. CAP-miRSeq: a comprehensive analysis pipeline for microRNA sequencing data. BMC Genomics. 2014;15:423. https ://doi.org/10.1186/1471-2164-15-423. 4. Vitsios DM, Enright AJ. Chimira: analysis of small RNA sequencing data
and microRNA modifications. Bioinformatics. 2015;31:3365–7. https ://doi. org/10.1093/bioin forma tics/btv38 0.
5. Zhang Y, Xu B, Yang Y, Ban R, Zhang H, Jiang X, et al. CPSS: a compu-tational platform for the analysis of small RNA deep sequencing data. Bioinformatics. 2012;28:1925–7. https ://doi.org/10.1093/bioin forma tics/ bts28 2.
6. Quek C, Jung CH, Bellingham SA, Lonie A, Hill AF. iSRAP—a one-touch research tool for rapid profiling of small RNA-seq data. J Extracell Vesicles. 2015;4:29454. https ://doi.org/10.3402/jev.v4.29454 .
7. Hackenberg M, Rodríguez-Ezpeleta N, Aransay AM. miRanalyzer: an update on the detection and analysis of microRNAs in high-throughput sequencing experiments. Nucleic Acids Res. 2011;39:W132–8. https ://doi. org/10.1093/nar/gkr24 7.
8. Friedländer MR, Mackowiak SD, Li N, Chen W, Rajewsky N. miRDeep2 accurately identifies known and hundreds of novel microRNA genes in seven animal clades. Nucleic Acids Res. 2012;40:37–52. https ://doi. org/10.1093/nar/gkr68 8.
9. Wang W-C, Lin F-M, Chang W-C, Lin K-Y, Huang H-D, Lin N-S. miR-Express: analyzing high-throughput sequencing data for profiling microRNA expression. BMC Bioinform. 2009;10:328. https ://doi. org/10.1186/1471-2105-10-328.
10. Baras AS, Mitchell CJ, Myers JR, Gupta S, Weng L-C, Ashton JM, et al. miRge—a multiplexed method of processing small RNA-Seq data to determine MicroRNA entropy. PLoS ONE. 2015;10:e0143066. https ://doi. org/10.1371/journ al.pone.01430 66&type=print able.
11. Ronen R, Gan I, Modai S, Sukacheov A, Dror G, Halperin E, et al. miRNAkey: a software for microRNA deep sequencing analysis. Bioinformatics. 2010;26:2615–6. https ://doi.org/10.1093/bioin forma tics/btq49 3. 12. Wu J, Liu Q, Wang X, Zheng J, Wang T, You M, et al. mirTools 20 for
non-coding RNA discovery, profiling, and functional annotation based on high-throughput sequencing. RNA Biol. 2013;10:1087–92. https ://doi. org/10.4161/rna.25193 .
13. Capece V, Garcia Vizcaino JC, Vidal R, Rahman R-U, Pena Centeno T, Shom-roni O, et al. Oasis: online analysis of small RNA deep sequencing data. Bioinformatics. 2015;31:2205–7. https ://doi.org/10.1093/bioin forma tics/ btv11 3.
•fast, convenient online submission •
thorough peer review by experienced researchers in your field • rapid publication on acceptance
• support for research data, including large and complex data types •
gold Open Access which fosters wider collaboration and increased citations maximum visibility for your research: over 100M website views per year •
At BMC, research is always in progress.
Learn more biomedcentral.com/submissions
Ready to submit your research? Choose BMC and benefit from:
15. Gupta V, Markmann K, Pedersen CNS, Stougaard J, Andersen SU. shortran: a pipeline for small RNA-seq data analysis. Bioinformatics. 2012;28:2698– 700. https ://doi.org/10.1093/bioin forma tics/bts49 6.
16. Barturen G, Rueda A, Hamberg M, Alganza A, Lebron R, Kotsyfakis M, Shi B-J, Koppers-Lalic D, Hackenberg M. sRNAbench: profiling of small RNAs and its sequence variants in single or multi-species high-throughput experiments. Methods Next-Generation Seq. 2014;1:21–31. 17. Li W, Freudenberg J, Miramontes P. Diminishing return for increased
mappability with longer sequencing reads: implications of the k-mer distributions in the human genome. BMC Bioinform. 2014;15:2. https :// doi.org/10.1186/1471-2105-15-2.
18. Hatem A, Bozdağ D, Toland AE, Çatalyürek ÜV. Benchmarking short sequence mapping tools. BMC Bioinform. 2013;14:184. https ://doi. org/10.1186/1471-2105-14-184.
19. Griffiths-Jones S, Saini HK, van Dongen S, Enright AJ. miRBase: tools for microRNA genomics. Nucleic Acids Res. 2008;36:D154–8. https ://doi. org/10.1093/nar/gkm95 2.
20. Meyers BC, Axtell MJ, Bartel B, Bartel DP, Baulcombe D, Bowman JL, et al. Criteria for annotation of plant MicroRNAs. Plant Cell. 2008;20:3186–90.
https ://doi.org/10.1105/tpc.108.06431 1.
21. Neilsen CT, Goodall GJ, Bracken CP. IsomiRs–the overlooked repertoire in the dynamic microRNAome. Trends Genet. 2012;28:544–9. https ://doi. org/10.1016/j.tig.2012.07.005.
22. Tan GC, Chan E, Molnar A, Sarkar R, Alexieva D, Isa IM, et al. 5′ isomiR variation is of functional and evolutionary importance. Nucleic Acids Res. 2014;42:9424–35. https ://doi.org/10.1093/nar/gku65 6.
23. Griffiths-Jones S, Grocock RJ, van Dongen S, Bateman A, Enright AJ. miRBase: microRNA sequences, targets and gene nomenclature. Nucleic Acids Res. 2006;34:D140–4. https ://doi.org/10.1093/nar/gkj11 2.
24. Langmead B, Trapnell C, Pop M, Salzberg SL. Ultrafast and memory-efficient alignment of short DNA sequences to the human genome. Genome Biol. 2009;10:R25. https ://doi.org/10.1186/gb-2009-10-3-r25. 25. Johnson M, Zaretskaya I, Raytselis Y, Merezhuk Y, McGinnis S, Madden
TL. NCBI BLAST: a better web interface. Nucleic Acids Res. 2008;36:W5–9.
https ://doi.org/10.1093/nar/gkn20 1.
26. Li R, Yu C, Li Y, Lam T-W, Yiu S-M, Kristiansen K, et al. SOAP2: an improved ultrafast tool for short read alignment. Bioinformatics. 2009;25:1966–7.
https ://doi.org/10.1093/bioin forma tics/btp33 6.
27. Langmead B, Salzberg SL. Fast gapped-read alignment with Bowtie 2. Nat Methods. 2012;9:357–9. https ://doi.org/10.1038/nmeth .1923.
28. Quinlan AR, Hall IM. BEDTools: a flexible suite of utilities for comparing genomic features. Bioinformatics. 2010;26:841–2. https ://doi.org/10.1093/ bioin forma tics/btq03 3.
29. Smith TF, Waterman MS. Identification of common molecular subse-quences. J Mol Biol. 1981;147:195–7.
30. Li H, Durbin R. Fast and accurate short read alignment with Bur-rows–Wheeler transform. Bioinformatics. 2009;25:1754–60. https ://doi. org/10.1093/bioin forma tics/btp32 4.
31. Paşaniuc B, Zaitlen N, Halperin E. Accurate estimation of expression levels of homologous genes in RNA-seq experiments. J Comput Biol. 2011;18:459–68. https ://doi.org/10.1089/cmb.2010.0259.
32. Dobin A, Davis CA, Schlesinger F, Drenkow J, Zaleski C, Jha S, et al. STAR: ultrafast universal RNA-seq aligner. Bioinformatics. 2013;29:15–21. https :// doi.org/10.1093/bioin forma tics/bts63 5.