International Journal of Innovative Technology and Exploring Engineering (IJITEE) ISSN: 2278-3075,Volume-8 Issue-3C, January 2019
Abstract: Background/Objectives: Incomplete data that can be easily accessed in the ubiquitous environment has a great impact on the performance of the classification system depending on the degree of information loss, and thus it is essential to overcome the problem. Methods/Statistical analysis: Therefore, this paper proposes a data model that can compensate lost data by probability technique and assign weight to each event. Two existing classification models(FLDF, EBP) are extended to perform learning in accordance with the structure of this data model. It is confirmed that performance evaluation of both models can play a role as incomplete data processing system while varying degrees of loss information. Findings: The extended data format has been applied to various loss data by applying a probability concept to each attribute value and assigning a weight indicating importance to each event in general data. The main view point in this paper is to modify the learning structure so that this data structure can be applied to two different algorithms, and to verify whether the damage can be preserved according to the original purpose by inputting the damaged data. Two classification algorithms have been selected for this purpose. FLDF is a gradual expansion model using Fisher 's equation widely used in statistics, and EBP is a basic idea of deep learning that repeatedly weights are learned in a given model. The experimental procedure shows that the loss data can be handled properly in both models. Especially, in EBP, one attribute value is distributed to several input nodes, and it is confirmed that they are excellent in recovering the lost part even though they learn in the next layer. Improvements/Applications: Experiments are carried out to confirm that the two models are applied for a given purpose. In the experimental data, a certain percentage of events and attributes are arbitrarily selected and damaged, and then used as experimental data. For fairness, 10 runs are performed per experiment and the average value of these values is calculated as the result of the experiment. This paper suggests that it is useful to use the proposed restoration method in the field where the damaged data should be used for learning due to various factors.
Keywords: Extended data expression, FLDF, EBP, Missing data, Deep learning.
I.INTRODUCTION
As long as the data is gathered from a separate device to be used for other purposes, its format must be different. For example, when data is collected in different environments, it can happen that there is not one specific variable. The processing of incomplete data is called a missing data problem[1,2]. Research to solve this problem is divided into methods of neglecting missing values and filling in missing values. This paper uses the latter method to solve this problem based on the data extension technique[3-6]. The data extension is divided into a portion to fill in the value of the
Revised Manuscript Received on January 03, 2019.
Jong Chan Lee, Dept. of Computer Engineering, Chungwoon Univ., Incheon, 22100, Korea,
lost variable and a weight to handle the importance of each event record. In other words, if a variable value is lost in a particular record, it is filled with a probability value using cardinality, which means the number of values that this variable can have. Also, each record has a different weight value, which indicates the importance of each record and reflects the influence of each record in the learning process. This can be useful for algorithms that use data weights for each event record, such as AdaBoost learning. Therefore, the advantage of this method is that it does not require additional information about the data such as the fuzzy probability value or the degree of membership. In addition, the algorithm is simple and easy to handle.
After processing incomplete pattern data with extended data representation technique, it is applied to classification algorithm using FLDF (Fisher's Linear Discriminant Function)[7]. The extended representation technique also applies to deep learning algorithms that extract features included in data and perform learning[7]. And compare the results of both methods. First, the FLDF classification algorithm[7] determines the optimal projection plane for classifying the pattern using Fisher's linear discriminant function. This is a method of repeatedly classifying the learning patterns according to the learning pattern by projecting the learning patterns onto the projection surface and then determining the threshold value using an entropy function. Secondly, this paper deals with deep learning algorithms[9-12]. Among them, CNN (Convolution Neural Network) is based on Neocognitron of Fukushima in 1980. Neocognitron was developed to recognize handwritten letters. First, in order to extract the characteristics of each character, the structure divides the small parts of the character into cell parts. Then, the recognized cell parts are stacked in a multi-layer structure to construct a layer for combining recognition parts. In 1989, LeCun et al. developed a 3-layer recognizer that automatically recognizes zip codes by adding the EBP algorithm to this feature extraction structure, which is now the source of CNN. CNN, which has strengths in multi-layer structure, is being made into a neural network model consisting of several tens of layers with deep-learning research being activated. The advantage of CNN is that it is robust to positional changes of features, which is good for image recognition. RNN (Recurrent Neural Network) based algorithms are mainly used to identify time series data such as voice. The basic RNN has a recursive structure that, unlike other neural network algorithms, propagates its output to the next layer and delivers it to
itself at the same time.
Classification Models for Handling Missing
Data
1
This recursive structure plays the same role as memory, allowing you to model changes over time. However, as the length of the input data becomes longer, the RNN has a problem that information of the input data is gradually forgotten. However, the RNN has a problem of losing information of the previously input data as the length of the input data becomes longer. Hochreiter and Jurgen have solved this problem by constructing a circular algorithm of long short-term memory (LSTM) in 1997 to control the value by adding a cell called gate to the input and output of the RNN[13,14].
II.BACKGROUND 2.1. Data representation for missing value
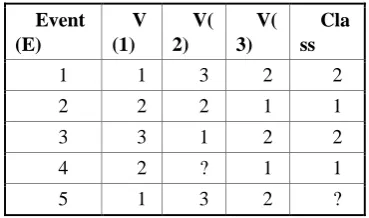
Table 1 shows an example of training data having lost values. This table consists of three variables and one class. The V(1) and V(2) variables have 3 cardinalities, and the V(3) and class variables have 2 cardinalities[3-6]. Here, Event 4 has a missing value in V(2), and Event 5 has a missing value in its class.
Table 1. Example of training data containing missing data
Event (E)
V (1)
V( 2)
V( 3)
Cla ss
1 1 3 2 2
2 2 2 1 1
3 3 1 2 2
4 2 ? 1 1
[image:2.595.76.261.334.443.2]5 1 3 2 ?
Table 2 shows the results of transforming the training data in Table 1 into extended data representations. Here, variable values of an event that does not contain a missing value are filled with 0 or 1 in the corresponding entry. On the other hand, each entry of the missed event is filled with a probability value between 0 and 1. In this process, the concept of weight (W) is added to redefine each record. The weight value may be a value determined by an expert, indicating how important the event of each record is, or may be a value calculated by an algorithm such as the AdaBoost algorithm. For example, assuming that the weight of event 1 in Table 2 is 20, it can be seen that this event has the same significance as 20 of the event with a weight of 1.
Table 2. The extended data representation Event Weigh
t
V(1) V(2) V(3) Class
1 2 3 1 2 3 1 2 1 2
1 20 1 0 0 0 0 1 0 1 0 1
2 1 0 1 0 0 1 0 1 0 1 0
3 1 0 0 1 1 0 0 0 1 0 1
4 1 0 1 0 1/3 1/3 1/3 1 0 1 0
5 1 1 0 0 0 0 1 0 1 1/2 1/2
2.2. Deep learning algorithm
The learning process of the EBP network[8] is divided into
function is a forward step. In the backward step, the error between the expected output value and the actual output value is obtained, and the weight between the layers is adjusted by propagating the difference backward. These two processes are repeated until the predetermined value is stabilized, that is, until the total error sum is smaller than the error criterion. The forward step for one pattern is performed as in (1).
Input value : (1)
Output value :
Here, with a sign opposite to the threshold value is always a value of 1, and represents a sigmoid function. At the end of the forward step, the mean square error (MSE) error is obtained as in Eq. (2). Also, the total error for the entire pattern is given by (3).
= 1/2 (2)
(3) To minimize this error, we use the generalized delta rule as in (4) in the backward step.
(4)
= -
In the output layer, is obtained as in Eq. (5). In the
hidden layer, is obtained as in Eq. (6). After the error
value is calculated at each node, the connection weights as shown in Eq. (7) are gradually changed and learning is performed.
(5)
(6)
)+ (7)
Where is the learning rate and is the momentum rate.
2.3. FLDF model with extended data representation In the extended data representation method for processing an incomplete data set, a new weighting concept was included and the representation method of each data entry changed[7]. Therefore, the projection plane and the entropy function must be newly defined.
cardty[j] : The cardinality number of the variable j (Vj). num[i] : Number of events with class i.
vanum :Number of variables in training data (n). evnum :Number of events in the training data. clanum :Number of classes in training data (k).
To obtain the actual data value considering the weight value, we define the function as follows (8).
m (8) Using Eq. (8), the mean vector of each class in the learning pattern is derived as follows.
[image:2.595.311.549.577.834.2]International Journal of Innovative Technology and Exploring Engineering (IJITEE) ISSN: 2278-3075,Volume-8 Issue-3C, January 2019
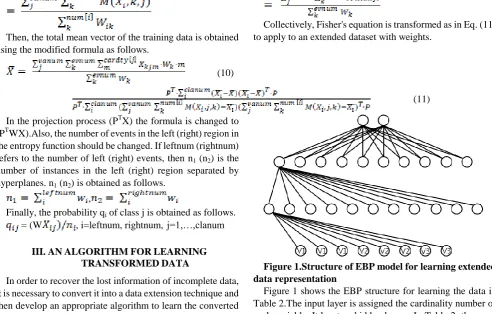
Then, the total mean vector of the training data is obtained using the modified formula as follows.
(10)
Collectively, Fisher's equation is transformed as in Eq. (11) to apply to an extended dataset with weights.
(11)
In the projection process (PTX) the formula is changed to (PTWX).Also, the number of events in the left (right) region in the entropy function should be changed. If leftnum (rightnum) refers to the number of left (right) events, then n1 (n2) is the number of instances in the left (right) region separated by hyperplanes. n1 (n2) is obtained as follows.
,
Finally, the probability qi of class j is obtained as follows. = (W , i=leftnum, rightnum, j=1,…,clanum
III.ANALGORITHMFORLEARNING
TRANSFORMEDDATA
In order to recover the lost information of incomplete data, it is necessary to convert it into a data extension technique and then develop an appropriate algorithm to learn the converted data. In other words, the learning algorithm must be extended to accommodate the newly defined data structure. This paper uses FLDF model and EBP model for this purpose. The approach between the two classification models is very different. The FLDF model extracts important feature values from data and constructs them as variables, and then uses them as learning data. On the other hand, the EBP model repeats the learning of data and becomes more evident by finding out more and more characteristic values. These features determine the connection values of nodes.
First, the FLDF classification algorithm determines the optimal projection plane for classifying the pattern using Fisher's linear discriminant function. This is a method of repeatedly classifying the learning patterns according to the learning pattern by projecting the learning patterns onto the projection surface and then determining the threshold value using an entropy function. Second, the learning process of the EBP network is divided into forward and backward stages. In each neuron, calculating the output using the input function and the activation function is a forward step. In the backward step, the error between the expected output value and the actual output value is obtained, and the weight between the layers is adjusted by propagating the difference backward. These two processes are repeated until the predetermined value is stabilized, that is, until the total error sum is smaller than the error criterion.
Figure 1.Structure of EBP model for learning extended data representation
[image:3.595.51.544.59.373.2]Figure 1 shows the EBP structure for learning the data in Table 2.The input layer is assigned the cardinality number of each variable. It has two hidden layers. In Table 2, there are two classes, so the output layer has two nodes. A unique feature of this learning model is that entries in the input layer are listed by the entry of each variable and enter the input of the next layer. Nevertheless, the convergence of learning to the objective value means that learning is performed by automatically combining information by variable during learning as in the CNN model of Deep Learning.
IV.EXPERIMENTALRESULTS
To analyze these results, it is necessary to experiment with more data. However, in the case of EBP, it is interpreted that
[image:4.595.65.411.62.649.2]the loss data more influence the learning process of determining the connection strength between nodes.
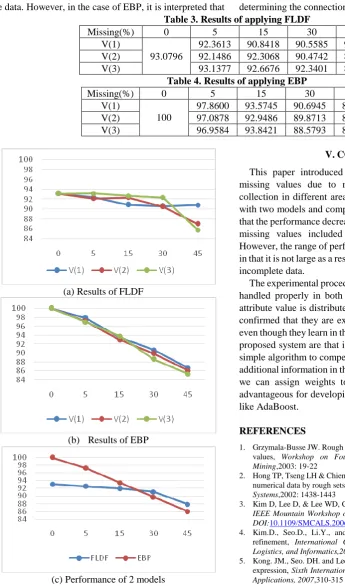
Table 3. Results of applying FLDF
Missing(%) 0 5 15 30 45
V(1)
93.0796
92.3613 90.8418 90.5585 90.8028
V(2) 92.1486 92.3068 90.4742 86.9847
V(3) 93.1377 92.6676 92.3401 85.7389
Table 4. Results of applying EBP
Missing(%) 0 5 15 30 45
V(1)
100
97.8600 93.5745 90.6945 86.6622
V(2) 97.0878 92.9486 89.8713 86.0364
V(3) 96.9584 93.8421 88.5793 85.2840
(a) Results of FLDF
(b) Results of EBP
[image:4.595.63.285.204.653.2](c) Performance of 2 models
Figure 2.Comparison of experimental results From these results, it can be seen that there are some differences depending on the data or variables, but the better results are obtained from the experiments containing less losses. On the other hand, even if the ratio of the missing part is somewhat higher, the performance of the experimental results does not show much difference. This is interpreted as a result of minimizing the effect of information loss through the process of extending the data to fill the missing value.
V.CONCLUSION
This paper introduced a method to process data with missing values due to malfunction of some sensors or collection in different areas. And this paper implemented it with two models and compared the results. The results show that the performance decreases somewhat as the percentage of missing values included in the training data increases. However, the range of performance degradation is significant in that it is not large as a result of learning using data including incomplete data.
The experimental procedure shows that the loss data can be handled properly in both models. Especially, in EBP, one attribute value is distributed to several input nodes, and it is confirmed that they are excellent in recovering the lost part even though they learn in the next layer. The advantages of the proposed system are that it is easy to process because of the simple algorithm to compensate the loss and it does not need additional information in the process. In addition, the fact that we can assign weights to each record in the data set is advantageous for developing into a system that uses weights like AdaBoost.
REFERENCES
1. Grzymala-Busse JW. Rough set strategies to data with missing attribute
values, Workshop on Foundations & New Directions in Data
Mining,2003: 19-22
2. Hong TP, Tseng LH & Chien BC. Learning fuzzy rules from incomplete
numerical data by rough sets, IEEE international Conference on Fuzzy Systems,2002: 1438-1443
3. Kim D, Lee D, & Lee WD, Classifier using Extended Data Expression,
IEEE Mountain Workshop on Adaptive and Learning Systems, 2006. DOI:10.1109/SMCALS.2006. 250708
4. Kim.D., Seo.D., Li.Y., and Lee.WD., A classifier capable of rule
refinement, International Conference on Service Operations and
Logistics, and Informatics,2008, 168-173
5. Kong. JM., Seo. DH. and Lee WD, Rule refinement with extended data
expression, Sixth International Conference on Machine Learning and Applications, 2007,310-315
6. Lee. JC, and Lee. WD, Biological early warning system using UChoo
algorithm, Journal of Information and Communication Convergence Engineering, 2012, 16(1)
7. Lee JC, Seo DH, Song CH, & Lee WD, FLDF based Decision Tree using
Extended Data Expression, Conference on Machine Learning &
Cybernetics, 2007,Hong Kong, 3478- 3483
8. Rumelhart DE, Hinton GE, & Williams RJ, Learning Internal
Representations by Error Propagation, PDP, I, 1986, 318-362
9. LeCun Y, Bengio Y & Hinton.GE. Deep learning, Nature, 2016, 521,
International Journal of Innovative Technology and Exploring Engineering (IJITEE) ISSN: 2278-3075,Volume-8 Issue-3C, January 2019
10. Deng L &Yu D, Deep learning: methods and applications, Foundations
and Trends in Signal Processing, 2014, 7, 197-387.
11. Schmidhuber J, Deep learning in neural networks : An overview,
Elsevier. 2015
12. Keogh E, Blake C, Merz.CJ, UCI Repository of Machine Learning
Databases, http://www.ics.uci.edu/~mlearn/ MLRepository.html,.
13. Pradeep KM, Debahuti M, Srikanta P and Kailash S, A Hybrid
Approach for Simultaneous Gene Clustering and Gene Selection for
Pattern Classification, Indian Journal of Science and Technology,
Volume : 9(21), DOI: 10.17485/ijst/2016/v9i21/94175, 2016, ISSN (Print) : 0974-6846. ISSN (Online) : 0974-5645.
14. Pradeep KM, Debahuti M, Srikanta P and Kailash S, A Novel