This is a repository copy of Recommendations on multiple testing adjustment in multi-arm trials with a shared control group.
White Rose Research Online URL for this paper: http://eprints.whiterose.ac.uk/103025/
Version: Accepted Version
Article:
Howard, DR orcid.org/0000-0003-3333-9783, Brown, JM orcid.org/0000-0002-2719-7064, Todd, S et al. (1 more author) (2018) Recommendations on multiple testing adjustment in multi-arm trials with a shared control group. Statistical Methods in Medical Research, 27 (5). pp. 1513-1530. ISSN 0962-2802
https://doi.org/10.1177/0962280216664759
© 2016, The Author(s). This is an author produced version of a paper published in Statistical Methods in Medical Research. Reprinted by permission of SAGE Publications.
[email protected] https://eprints.whiterose.ac.uk/ Reuse
Items deposited in White Rose Research Online are protected by copyright, with all rights reserved unless indicated otherwise. They may be downloaded and/or printed for private study, or other acts as permitted by national copyright laws. The publisher or other rights holders may allow further reproduction and re-use of the full text version. This is indicated by the licence information on the White Rose Research Online record for the item.
Takedown
If you consider content in White Rose Research Online to be in breach of UK law, please notify us by
1
Recommendations on multiple testing adjustment in multi-arm trials with a shared control
group
Dena R Howard1, Julia M Brown1, Susan Todd2, Walter M Gregory1
1Leeds Institute of Clinical Trials Research, University of Leeds, Leeds, United Kingdom 2Department of Mathematics and Statistics, University of Reading, Reading, United Kingdom
Correspondence to: Dena Howard
Author contact details: Dena Howard
Leeds Institute of Clinical Trials Research University of Leeds
Leeds LS2 9JT
United Kingdom
Email: [email protected] Tel: 0113 343 1475
2
Recommendations on multiple testing adjustment in multi-arm trials with a shared control
group
Short Title
Recommendations on multiple testing adjustment in multi-arm trials
Abstract
Multi-arm clinical trials assessing multiple experimental treatments against a shared control group can offer efficiency advantages over independent trials through assessing an increased number of hypotheses. Published opinion is divided on the requirement for multiple testing adjustment to control the familywise type-I error rate (FWER). The probability of a false positive error in multi-arm trials compared to equivalent independent trials is affected by the correlation between
comparisons due to sharing control data. We demonstrate that this correlation in fact leads to a reduction in the FWER, therefore FWER adjustment is not recommended solely due to sharing control data. In contrast, the correlation increases the probability of multiple false positive outcomes across the hypotheses, although standard FWER adjustment methods do not control for this. A stringent critical value adjustment is proposed to maintain equivalent evidence of superiority in two correlated comparisons to that obtained within independent trials. FWER adjustment is only
required if there is an increased chance of making a single claim of effectiveness by testing multiple hypotheses; not due to sharing control data. For competing experimental therapies, the correlation between comparisons can be advantageous as it eliminates bias due to the experimental therapies being compared to different control populations.
Keywords
3 1. Introduction
A typical confirmatory two arm trial would usually compare an experimental treatment against the current standard within the population of interest. For several reasons, it is advantageous to conduct multi-arm trials, in which a number of experimental treatments are compared to the current
standard. Firstly, such trials are more efficient since they use the data collected on the control group more than once so fewer patients are required. Secondly, trial set-up times and costs can be reduced over running separate trials. Finally, increasing the number of experimental arms increases the chance of finding a successful treatment1.
When testing a hypothesis in a phase III clinical trial, the chance of a false positive result, known as the type-I error, is required to be stringently controlled. The convention is to set this error, usually denoted by , to be no greater than 5% by setting the one-sided p-value to <0.025. If more than one hypothesis is to be tested within a set, or family, of hypotheses, the chance of a false positive conclusion occurring anywhere within that set is known as the familywise error rate (FWER). That is, the FWER is the probability of at least one false positive conclusion being declared anywhere within a family of hypotheses.
There are conflicting viewpoints within the literature on whether the relevant errors to control in the case of multi-arm trials are the individual type-I errors for each hypothesis, known as the pairwise error rates, or the overall FWER for all hypotheses combined. The crux of the issue is how ‘family’ should be defined; whether all hypotheses belong to a family simply because they share a protocol and control group, or whether a family is a set of hypotheses that are related in that they contribute towards a single claim of effectiveness.
The literature on requirement for multiplicity adjustment is often based on philosophical opinions, rather than statistical theory considering the actual effect on the type-I error rates of using a shared control group compared to running independent trials. Some literature, including a points to
4
Conference on Harmonisation (ICH) E9 guidance of Statistical Principles for Clinical Trials10, no literature has been found to give comprehensive guidance from a quantitative, rather than
philosophical, perspective on which situations require type-I error adjustment and which do not.
Discussion points from the Statisticians in the Pharmaceutical Industry multiplicity expert group state that “the concern with multiplicity is that, if it is not properly handled, unsubstantiated claims for the effectiveness of a drug may be made as a consequence of an inflated rate of false positive conclusions”11. In this manuscript, we therefore break down and quantitatively investigate the
aspects of a multi-arm trial that affect the chance of different types of false positive errors on a claim of effectiveness in order to make informed recommendations on the need for adjustment. We begin by providing examples in Section 2, and describing the background to multiplicity concerns in multi-arm trials in Section 3. In Section 4 we investigate the effect of the shared control data on the chance of type-I errors. Section 5 shows the probabilities of type-I errors after applying common multiplicity adjustment methods in the case of shared control data, and we compare these to the errors had the hypotheses been assessed within independent trials. In Section 6 we suggest a correction to control for the increased probability of multiple type-I errors that advantage the experimental treatment, which may be necessary where more than one superior outcome within the protocol could inform the same claim of effectiveness. The paper concludes with a discussion in Section 7.
2. Motivational examples
Three examples of multi-arm trials with different types of design and varying levels of relatedness between the hypotheses are considered in this article.
2.1 MRC COIN
The phase III MRC COIN trial12 in previously untreated patients with colorectal cancer had three-arms and two primary hypotheses. The control treatment was chemotherapy with oxaliplatin and fluoropyrimidine (OxFP) given continuously (arm Z). One experimental arm included an additional therapy cetuximab to OxFP (arm A), and the other assessed the chemotherapy OxFP given
intermittently (arm B). Patients were randomised to the three treatment arms with a 1:1:1 ratio, and the trial objective was to assess a difference in overall survival at two years for each of the
5
2.2 AMAGINE-1
The phase III AMAGINE-1 trial (clinicaltrials.gov identifier: NCT01708590) was run by Amgen / AstraZeneca from 2012 to 2015. The trial assessed the safety and efficacy of brodalumab taken every two weeks via subcutaneous injection at two doses (140 mg or 210 mg) compared with
placebo in patients with moderate-to-severe plaque psoriasis. The primary hypotheses concerned the efficacy of brodalumab compared to placebo, as assessed by Static Physician Global Assessment (sPGA) score and improvement in Psoriasis Area and Severity Index (PASI) at 12 weeks.
2.3 Myeloma XI+ Intensive
The Myeloma XI Intensive trial (ClinicalTrials.gov Identifier: NCT01554852) at the University of Leeds opened to recruitment in 2010, comparing the current standard therapy CTD
(cyclophosphamide, thalidomide and dexamethasone) with CRD (cyclophosphamide, lenalidomide and dexamethasone) in terms of progression-free survival (PFS) in newly diagnosed patients with Multiple Myeloma. It was anticipated that recruitment would take up to four years, with the required number of events occurring within three years after the close of recruitment. During recruitment, early evidence suggested a new therapy, carfilzomib, added to the existing CRD regime (CCRD) might improve efficacy. Since it was of interest to assess CCRD as soon as
possible, the follow-on Myeloma XI+ intensive trial was designed without waiting for the results of the original trial, and opened to recruitment in 2013 following on seamlessly from Myeloma XI. The Myeloma XI+ trial therefore compared the experimental therapy CCRD to the current standard control CTD and the previous experimental therapy CRD at a 2:1:1 randomisation in order to protect the trial in the case that CRD was found superior and superseded CTD as the standard therapy before the amended trial had completed and reported.
3. Background to multiplicity concerns in multi-arm trials
3.1 Shared control data
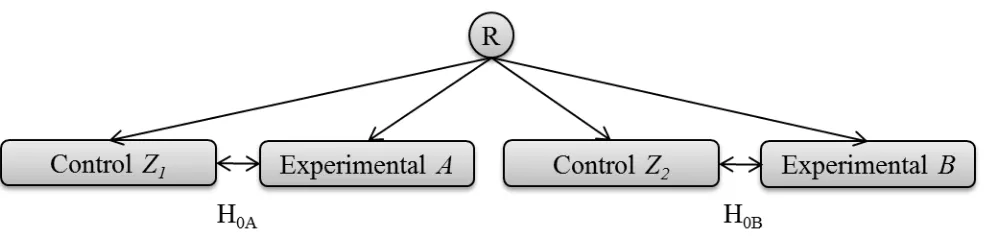
If two experimental treatments, say A and B, are to be compared against the current standard, say Z, in independent trials, it is accepted that there is no requirement for multiple testing adjustment. If these two hypotheses are instead assessed within the same protocol, where the data remain entirely independent and non-overlapping with separate control groups Z1 and Z2, and the hypotheses are
6
testing adjustment since there is no multiple use of any data. The sharing of a protocol or even a randomisation system in this case does not affect the probability of an error over that for
[image:7.595.60.553.240.362.2]independent trials. Westfall et al.13 report that it may be plausible that multiplicity problems due to sharing a protocol could result from “selection effects” such as the method of assessment of the primary endpoint. However, this could just as easily occur in two independent trials led by the same trials team. Therefore it would seem that there is no additional reason for multiplicity concerns due to simply sharing a protocol, when separate pieces of confirmatory evidence are not required to be obtained from distinct teams.
Figure 1a. Illustration of two separate hypotheses being tested within the same protocol. There is
no overlap of the use of patients, so the questions are entirely independent. R denotes the point of randomisation.
[image:7.595.114.483.579.696.2]A trial of the design displayed in figure 1a may not make practical sense where the eligibility criteria and control group for both experimental treatment comparisons are the same. Efficiency can be greatly improved by comparing both experimental arms to the same group of control patients. If the treatment difference being sought is the same, then utilising a single control group offers a saving of 25% of the trial sample size for an even allocation ratio (figure 1b).
Figure 1b. Illustration of a multi-arm design where two separate hypotheses are being asked within
7
For the design shown in figure 1b, the hypotheses can be addressed separately and can both be adequately powered. Given the logic that the use of the same protocol does not cause multiplicity concerns over the same hypotheses being tested in independent trials, the difference is around the shared use of the control data. The comparisons are no longer independent, but are correlated based on the shared comparator group14. The impact of this correlation can be formally quantified to inform the necessary adjustment so that the chances of errors do not exceed those for independent trials. Proschan et al.15 examine the effects of treatments being compared to a control within the
same trial compared to independent trials, “in terms of the different distributions of the number of Type-I errors and power”. Senn16 considers the conditional probability of a type-I error under the
null hypothesis of “concluding that a given dose is significant given that all other doses tested to date are significantly different from placebo” when comparing multiple doses against a placebo, as an alternate way of thinking about the probability of multiple errors within a family. He notes that “even where the probabilities of making at least one type-I error are controlled, conditional error rates may not be”, but does not make recommendations for multiple testing adjustment based on this. Very little literature has been published assessing the effect of shared control data on the probabilities of type-I errors over those in independent trials, and this effect is rarely considered when assessing the requirement for multiplicity adjustment in multi-arm trials. Extending the work of Proschan et al. we further investigate the effect of correlation due to shared control data in detail within this manuscript.
3.2 Increased chance of making a single claim of effectiveness for a therapy
Section 3.1 highlights that a key statistical implication of running a single multi-arm trial compared to separate trials is due to multiple use of shared control data. However, another factor that could increase the chance of a false conclusion over that for independent trials is the ability to test more hypotheses than would otherwise have been assessed. The necessity for adjustment in this case is a largely philosophical, rather than necessarily statistical, argument that has been well addressed in the literature, albeit with varying opinions, and needs to be considered and justified on a trial-by-trial basis4-8.
8
Principles for Clinical Trials’10, which states that “adjustment should always be considered, and the
details of any adjustment procedure or an explanation of why adjustment is not thought to be necessary should be set out in the analysis plan.” Hung and Wang 17 discuss defining “a relevant family of hypotheses for which the type-I error needs to be properly controlled”, and recommend a “clinical decision tree”, determined in advance, to decide what aspects need to be protected from type-I error inflation. The decision on adjustment due to assessing multiple hypotheses should be made at the design stages for each trial and documented with full justification. This important consideration is incorporated into the recommendations on adjustment in multi-arm trials given in Section 7.
4. The effect of correlation due to shared control data
As noted above, whilst the increased chance of making a single claim of effectiveness based on multiple hypotheses within a trial has been widely discussed in the literature, the effect of
correlation due to multiple use of the shared control data has been less well addressed and does not appear to be widely understood, and therefore forms the main focus of this manuscript.
We begin by stating some key definitions before exploring the quantification of the effect of the shared control data.
4.1 Definitions of error regions
In two independent hypothesis tests, such as illustrated in the trial design given in figure 1a, the null hypothesis H0A assesses therapy A against Z1, with test statistic , and the null hypothesis H0B
assesses therapy B against Z2, with test statistic , each with a two-sided significance level of 0.05.
It can be assumed that the test statistics for each comparison follow a normal distribution when sample sizes are reasonable.
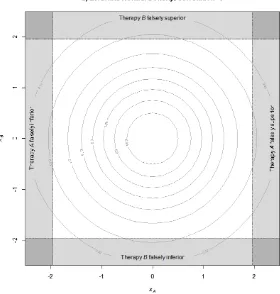
Figure 2 illustrates the joint density for the standardised test statistics in this setting, based on the probability density function of the standardised bivariate normal distribution with no correlation, since the tests are independent. The rejection regions for the hypothesis tests are the shaded areas around the outside of the square, as described by Fernandes and Stone14.
9
[image:10.595.152.432.137.431.2]falsely superior to its control therapy is 2.5%. The darker shaded corner regions represent the probability that both hypotheses have false positive outcomes, that is there are two type-I errors.
Figure 2. Rejection regions for two independent comparisons plotted on orthogonal axes, with the
standardised test statistic for the null hypothesis H0A being displayed horizontally, and H0B
displayed vertically.
The amount of false positive error that falls in different shaded regions within figure 2 may have different implications depending on the goals of the trial. We have therefore defined various types of false positive error below, and these will first be quantified in the case of independent
comparisons before exploring the case where there is shared control data.
Familywise Error Rate (FWER):
Recall that the FWER is the overall probability of at least one false positive conclusion anywhere within a defined set of trial hypotheses. It can be seen from figure 2 that in the case of two
10
the sum of the four shaded regions around the edges, minus the darker shaded regions that are double counted in the four corners.
Note that the FWER can easily be confirmed for independent comparisons, as it can be described using a binomial distribution since each null hypothesis has a binary outcome associated with it. Define Y to be the random variable associated with the event that a type-I error occurs. In the independent case, with k comparisons and a probability of finding a significant difference, the probability of exactly y type-I errors across the k comparisons (y = 1,…,k) can be expressed as:
Since the FWER is the probability of at least one error,
So, with two independent comparisons and = 0.05 for each as illustrated in figure 2, the FWER is 0.0975, as expected.
Family Multiple Error Rate (FMER):
A second type of false positive error can be defined as the chance of multiple false positive findings across a family of hypotheses, which we call the Family Multiple Error Rate (FMER).
The overall error that exists in any family of hypotheses will always equal the sum of the errors for each hypothesis. With a family of two (null) hypotheses H0A and H0B respectively relating to the
comparisons of therapies A and B with control, and =0.05 for each, the total error will be 0.1. By probability theory:
P H P H P H H P H H
P H is the probability of a type-I error for the null hypothesis H0A.
H is the probability of a type-I error for the null hypothesis H0B.
P H H is the overall chance of a type-I error, i.e. the FWER.
11
In figure 2, the FMER is represented by the sum of the probabilities in the four dark shaded corner regions. In the case of two fully independent hypotheses tested in two separate trials, the FMER is
. Therefore FWER + FMER is 0.1, as expected.
Note that the FMER is directly related to the conditional probability of a type-I error , as discussed in Section 3.1, since:
However, the FMER is easier to interpret in the case of a multi-arm trial due to the hypotheses not necessarily having any sensible order.
Multiple Superior False Positives (MSFP):
In figure 2, the lower left corner signifies both false positives falling in the rejection region in favour of the control, thus declaring the experimental treatment significantly inferior (multiple inferior false positive outcomes), the upper right corner signifies both false positives falling in favour of the experimental treatments (multiple superior false positive (MSFP) outcomes), and the upper left and lower right corners signify one false positive favouring the control and the other an experimental treatment. The chance of MSFP errors could be important if the outcomes of the hypotheses inform a single claim of effectiveness, as discussed in Section 6. In the independent case with two hypotheses, the probability of a MSFP outcome is 0.0252 = 0.000625.
4.2 The effect of positive correlation due to the shared control group
Recall Figure 1b illustrating a typical three-arm trial design with two experimental arms, A and B, and a shared control group Z. Since both treatments are being compared to the same control data, the comparisons are not independent. That is, if the control group sample, by chance, perform worse than the true population, there is an increased probability that both therapies A and B will report a false positive outcome to conclude that they are superior. The test statistics are therefore positively correlated, since the outcomes for the control sample will affect both in the same way.
12
error has been made on another comparison with control, is substantially increased” in the correlated case15, 16. We further quantify and expand on these findings in order to inform
recommendations on the need for a multiple testing adjustment in multi-arm trials with correlated test statistics.
4.3 Calculating the correlation between the test statistics due to sharing control data
Recall from Section 4.1 that in the case of multi-arm trials with independent experimental therapies and a shared control group, the test statistics for the comparisons, and , can be assumed to follow standardised normal distributions when sample sizes are reasonable. Their joint distribution therefore follows a standardised bivariate normal with correlation . Relevant theory is given in Follmann et al.18.
Dunnett19 notes that the correlation between the test statistics is directly linked to the allocation ratio, as follows:
where is the sample size in group i (i = A, B, Z).
If the allocation ratio is 1:1:1, the correlation is 0.5. For an allocation of 2:1:1 in favour of control, the correlation is 0.333. With 1:2:2, the correlation is 0.667.
4.4 Calculating the FWER, FMER and MSFP assuming a multivariate normal distribution, incorporating correlation
The various false positive errors of potential interest in a multi-arm trial can be calculated based on the assumption of the joint distribution of the test statistics following a standardised multivariate normal distribution. The R program in Appendix 1 computes these probabilities in the case of two or three experimental therapies, allowing varying correlation, in order to calculate the error density in each of the rejection regions.
13
[image:14.595.59.516.164.635.2]also increases. That is, if the shared control group performs better or worse than expected, there is a greater chance of an error in both of the hypotheses in the same direction, as expected. The effect of this correlation on the different types of errors described in Section 4.1 can easily be calculated by solving the probabilities of the outcomes falling within the relevant rejection regions.
Figure 3. Illustration of rejection regions for:
a) two hypotheses, each with individual control data, =0
14
4.5 FWER, FMER and MSFP comparison for multi-arm trials with a shared control group compared to independent trials
The R program in Appendix 1a can be used to calculate the FWER, FMER and MSFP rates for different levels of correlation based on the allocation ratio in three-arm trials with two experimental arms and a shared control. The code has also been extended to calculate the probabilities for four-arm trials with three experimental four-arms and a shared control, provided in Appendix 1b. These probabilities are shown in table 1.
Independent
case
(Separate trials)
Dependent case
2:1:1(:1)
(2 to control)
Dependent case
1:1:1(:1)
Dependent case
1:2:2(:2)
(1 to control)
Correlation ( ) 0 0.333 0.5 0.667
Reject H0 for each
individual hypothesis
(A, B or C)
0.050 0.050 0.050 0.050
Three-arm trial (hypotheses A and B)
FWER: Reject at least
one H0, A or B
0.0975 0.0946 0.0908 0.0849
FMER: Reject both
H0’s A and B (in any
direction)
0.0025 0.0054 0.0093 0.0151
MSFP: Reject both
H0’s in favour of
treatments A and B
0.00063 0.00267 0.00462 0.00753
Four-arm trial (hypotheses A, B and C)
FWER: Reject at least
one H0, A, B or C
0.1426 0.1348 0.1254 0.1124
FMER2: Reject at
least two H0’s (in any
direction)
15
FMER3: Reject all
three H0’s A, B and C
(in any direction)
0.0001 0.0011 0.0032 0.0076
MSFP2: Reject at
least two H0’s in
favour of A, B or C
0.0018 0.0069 0.0107 0.0150
MSFP3: Reject all
three H0’s in favour of
A, B and C
[image:16.595.56.541.54.244.2]0.00002 0.00056 0.00160 0.00378
Table 1. FWER, FMER and MSFP comparisons for three and four arm trials with a shared control
group and varying allocation ratios, compared to independent 1:1 randomised trials ( =0.05 for each hypothesis)
FWER:
The FWER is lower in all cases with shared control data than the equivalent error when assessing two independent trials. That is, the correlation between the test statistics reduces the overall probability of a type-I error occurring across either of the hypotheses over the case where there is no shared control data, as also shown by Proschan et al.15.
FMER:
In a multi-arm trial with two hypotheses, the chance of multiple errors has increased from 0.25% for independent trials to 0.93% in the case with even allocation, an increase of 3.7 times. The message stays the same as the number of hypotheses increases; in the case with three hypotheses and even allocation, the chance of any two errors is now over 2%, which is not trivial. Similar increases are found with unequal allocation ratios and the trend across the resultant correlations from these changing allocation ratios can be clearly seen.
16
MSFP:
With two hypotheses, the MSFP rate has increased from 0.06% in independent trials to 0.46% in the multi-arm case with even allocation, an increase of 7.7 times. With three hypotheses, the chance of any two superior false positive outcomes has increased by nearly 6 times to over 1%, and the chance of three MSFPs is substantially greater than in the independent case, although the
probability is very small at 0.16%. Again, similar patterns and trends are seen for other allocation ratios. This is intuitively obvious since a chance ‘bad’ outcome in the control sample compared to the true population would increase the chances of false positives in both hypotheses, but the magnitude of this effect is now apparent, and is not trivial.
5. An investigation of the effect of multiplicity adjustment methods
Many multiplicity adjustment procedures have been devised to strongly control the FWER for a number of tests within a family of hypotheses. The adjustment methods considered here are: Bonferroni20, a simple, conservative and popular adjustment method; Holm21 and Hochberg22, closed testing methods based on a hierarchical strategy of testing the outcomes ordered by
significance; Dunnett’s t19, a parametric method that adjusts the Bonferroni boundaries to control the probability of observing a significant result under H0 at 0.05; and Dunnett and Tamhane23, an
[image:17.595.34.567.614.754.2]adjusted Hochberg step-up multiple test procedure in which the rejection levels are adjusted to account for the correlation so that the final FWER is 0.05.
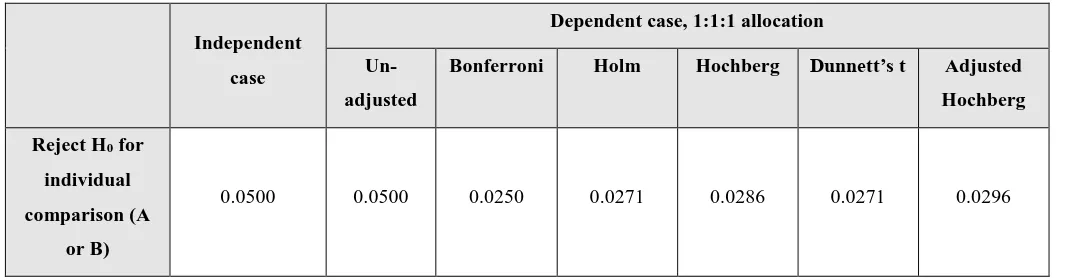
Table 2 shows the effects of applying these adjustment methods on the various error rates, using the example of a three arm trial with 1:1:1 allocation ratio in which the two experimental arms are compared to a shared control group.
Independent
case
Dependent case, 1:1:1 allocation
Un-adjusted
Bonferroni Holm Hochberg Dunnett’s t Adjusted
Hochberg
Reject H0 for
individual
comparison (A
or B)
17 FWER: Reject
at least one H0,
A or B
0.0975 0.0908 0.0465 0.0465 0.0480 0.0502 0.0500
FMER: Reject
both H0’s A and
B (in any
direction)
0.0025 0.0093 0.0035 0.0077 0.0093 0.0039 0.0093
MSFP: Reject
both H0’s in
favour of
treatments A
and B
[image:18.595.36.560.53.283.2]0.00063 0.00462 0.00176 0.00385 0.00462 0.00197 0.00462
Table 2. FWER, FMER and MSFP comparisons for three arm trials with two hypotheses ( =0.05
for each), a shared control group and even allocation ratio, after applying various multiple testing adjustments
FWER:
All adjustment methods control the FWER at 0.05 or less, as expected. In all cases, the chance of rejecting the null hypothesis for each individual comparison has taken a penalty compared to running independent trials. The Dunnett’s t and Adjusted Hochberg methods account for the effect of the correlation due to the shared control data on the FWER, in order to make less conservative adjustments than the other methods.
FMER:
Although adjustment methods control the probability of falsely rejecting at least one hypothesis, no method fully controls the chance of multiple errors occurring within the same set of hypotheses to be what it would have been if the hypotheses had been assessed in independent trials.
18
Intuitively, if the critical level is set lower, as with the Bonferroni method, fewer null hypotheses will be rejected in all comparisons, and therefore the chance of both being rejected will also decrease. However, since a ‘bad’ outcome in the shared control sample would still affect both comparisons by increasing the chances of a false positive error, it makes sense that a higher proportion of paired hypotheses are both rejected when they share a common control.
MSFP:
Since the adjustment methods do not control the FMER, they also do not offer full protection against the chance of MSFP outcomes. After applying the Bonferroni and Dunnett’s t corrections, the chance of two superior false positive errors is still inflated by approximately 3 times over that with independent trials, and following the Hochberg adjustments this rises to over 7 times.
The above results highlight that multiple testing adjustment methods only control the probability of the overall FWER to that for a single hypothesis. They do not offer control over the chance of multiple false positive errors, which is the probability that is increased over that had the hypotheses been assessed in independent trials.
6. Controlling the probability of multiple superior false positive outcomes
We have shown that in the case where two superior hypotheses may both be used to jointly inform a claim of effectiveness, the overall chance of both having a false positive outcome in favour of the experimental treatments (MSFP) is inflated in a multi-arm trial over that chance occurring in independent trials. In addition, applying multiple testing correction methods do not reduce the chance of MSFP outcomes to the same level as in two independent trials.
The FDA guidance on ‘Providing Clinical Evidence of Effectiveness for Human Drug and
Biological Products’24 suggests that it is feasible for multiple hypotheses from within a single study
to be accepted as evidence of effectiveness if the trial is designed appropriately. In this case, it would be important that the probability of multiple conclusions of superiority (MSFP) is not inflated over that for independent studies. The example of the AMAGINE-1 trial described in Section 2.2 assesses two doses of an experimental treatment against placebo. If these doses were investigated in independent trials, both trial outcomes may be used to inform a claim of
19
et al25, in which they require the overall ‘positive rejection region’ in a large pivotal trial to be controlled to the same level as in two smaller pivotal trials.
6.1 Critical values to control the MSFP rate in the case of three arms
In two independent trials, the chance of two superior false positive outcomes is 0.000625 (Section 4.1). Since the joint distribution can be described using a bivariate normal (Section 4.4), this can be used to obtain the exact critical value that returns a probability of 0.000625. This principle is similar to the work of Follmann et al., which relies on the multivariate normal assumption of the test
statistics to estimate critical values that strongly protect the type-I error rate in the case of multi-armed trials with interim looks18. The R code to calculate the critical value is provided in Appendix 2.
In the 1:1:1 case, the critical value required to protect the MSFP rate at 0.000625 is 0.0118. In the 2:1:1 case it is 0.0195, and in the 1:2:2 case it is 0.0069, as shown in Table 3. That is, if two hypotheses are assessed in a multi-arm trial with a shared control group, and are to be used to jointly inform a claim of effectiveness; in order to control the probability of two superior false positive outcomes to the level in independent trials, the p-values for both hypotheses are required to be less than these adjusted critical values. It can be seen that with this level of control, the FWER is reduced to much lower than 5%.
Independent case No adjustment Dependent case No adjustment Dependent case 2:1:1
= 0.0195
Dependent
case 1:1:1
= 0.0118
Dependent
case 1:2:2
= 0.0069
Reject H0 for
individual
comparison (A
or B)
0.050 0.050 0.0195 0.0118 0.0069
FWER: Reject
at least one H0, A
or B
0.0975 0.0908 0.0377 0.0224 0.0125
MSFP: Reject
both H0’s in
favour of
20
treatments A
[image:21.595.52.547.55.99.2]and B
Table 3. Adjusted critical values to control the chance of a MSFP error in a three-arm trial to that
for two independent 1:1 randomised trials
6.2 The effect of MSFP control on the power and sample size
If a trial is designed to allow two superior outcomes to be used as evidence to inform a single claim of effectiveness, the power is required to be maintained for each hypothesis as it would for
independent trials, requiring an increased sample size. As an example, take a confirmatory trial with a survival primary endpoint and analysis based on the log-rank test for equality based on an
exponential survival distribution. Assume that the estimated median survival in the control group is 36 months, and that a clinically relevant difference would be an improvement to 48 months
(HR=0.75). In a two-arm trial, with a recruitment period of 48 months and an additional 36 month follow-up period, 408 patients are required per arm (1:1) to achieve 508 events for 90% power with a type-I error rate of 5%.
If there are two experimental arms of interest in the population, a three-arm trial may be considered rather than two independent trials. In the scenario of running independent trials, the total sample size for the two trials assuming 1:1 allocations would be 1632, and in the multi-arm trial this is reduced to 1224 with no adjustment. Adjusting to control the chance of MSFP outcomes reduces the power from 90% to 77%, and to account for this loss in power the sample size would need to be increased by 37% to 1680, which makes the multi-arm trial slightly larger than running two
independent trials. There may still be benefits of running a multi-arm trial, however, in terms of reducing the total number of patients receiving the control therapy as well as the time and cost of only needing to set-up and run a single trial.
7. Discussion
21
maintain power could lead to a superior treatment being denied. Each of these scenarios raises ethical concerns.
False positive error rates may be affected in multi-arm trials compared to independent trials due to either: correlation between the comparisons caused by the shared use of the control data; or an increased chance of making a claim of effectiveness because of an increased ability to test a family of hypotheses. It is a common misconception that FWER adjustment is necessary due to sharing control data. When considering the designs illustrated in Figures 1a and 1b, some might assume that the overall FWER for the family of hypotheses, H0A and H0B, would be larger in Figure 1b where
there is a common control group. However, we have confirmed that the FWER is in fact smaller in Figure 1b than in Figure 1a. The common control group instead has the effect of increasing the chances of more than one false positive outcome within the family of hypotheses; although FWER adjustment methods do not control for this. The necessity for a FWER adjustment is therefore only dependent on whether assessing multiple hypotheses within a multi-arm trial has increased the chance of making a single claim of effectiveness.
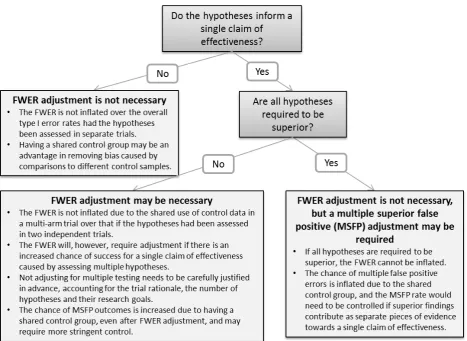
We have formalised the implications of running a multi-arm trial with shared control data on the probabilities of various types of false positive errors, considering the effects of multiple testing adjustment methods on these probabilities, in order to make informed recommendations on the requirement for adjustment. The findings are summarised below. In addition, a flow diagram to aid the determination of the requirement for a multiple testing adjustment in a multi-arm trial is
22
Figure 4. Decision diagram to determine the requirement for a multiple testing adjustment in
multi-arm trials
7.1 Familywise Error Rate (FWER) in the case where each hypothesis informs a different claim of effectiveness
Consider the case in which multiple hypotheses are being assessed in the same trial with a shared control group, but each hypothesis informs a different claim of effectiveness. An obvious example is where the experimental arms assess entirely different therapies. A further example is the MRC COIN trial12 introduced in Section 2.1. OxFP is present in all treatment arms, however since one
primary hypothesis addresses the addition of an experimental therapy to OxFP and the other addresses a reduction in duration of OxFP therapy, these do not contribute towards the same claim of effectiveness. In this case, the chance of a false positive outcome for either claim of effectiveness is not increased by the presence of the other hypothesis.
23
necessary due to the shared control sample. These findings remain valid in the case of imbalanced randomisations, and also where there are more than two experimental therapies.
Therefore, adjusting to control the FWER in this case is an unnecessary penalty. It does not make sense here to consider the type-I error rate for the trial as a whole since any claim of effectiveness is only informed by a single hypothesis test. Note that if the experimental therapies are competing against each other for approval in the trial population, the correlation due to the shared control group is an advantage. If in two independent trials one of the control samples performs worse than the true population, the associated experimental group has an increased chance of being significant and taken forward. However, in the equivalent multi-arm case, bias due to comparisons to different control samples is removed. It is more likely that efficacious experimental therapies would be considered against each other directly without the influence of variations in the control samples.
7.2 Familywise Error Rate (FWER) in the case where the hypotheses inform a single claim of effectiveness
We have shown that the FWER is not inflated due to running a multi-arm trial with a shared control group. However, it should be noted that FWER adjustment may be required if the efficiency of running a multi-arm trial leads to more hypotheses being included than would have otherwise been assessed in independent trials. If these hypotheses inform the same claim of effectiveness, for example if the experimental arms assess different doses or combinations of the same experimental therapy, the overall chance of a false positive result anywhere within the family of hypotheses is clearly increased over that for a single hypothesis. In this case, there is general agreement in the literature that FWER control is recommended7 since the type-I error rate can be considered for the
claim of effectiveness as a whole, rather than for each individual hypothesis. Note that it also follows that the power in this case can be considered to be the overall chance of observing at least one true positive outcome, and this will also be increased by testing multiple hypotheses. Therefore, the penalty caused by applying the FWER adjustment may be compensated to some extent by the gain in overall power.
An example here is the AMAGINE-1 trial (Section 2.2) assessing two doses of brodalumab
24
7.3 Familywise Error Rate (FWER) in the case where all hypotheses are required to have superior outcomes in order to make a claim of effectiveness
If all trial hypotheses are required to be positive in order to make a claim of effectiveness, there is essentially only one overarching hypothesis being tested. In this case, there is only one chance for an overall false positive outcome for the trial, so the chance of ‘at least one’ error cannot be inflated, and therefore no FWER adjustment is necessary.
For example, the Myeloma XI+ Intensive trial (Section 2.3) compared the four-drug regime CCRD against the current standard control CTD, as well as the previously assessed three-drug regime CRD (which is CCRD excluding carfilzomib). Since CCRD will only be recommended for approval if it is better than both CTD and CRD, both hypotheses are required to be significant in order to
recommend CCRD for use in practice. In this case, no adjustment is required.
7.4 Multiple Superior False Positives (MSFP) in the case where multiple superior outcomes could be used as separate pieces of evidence towards a single claim of effectiveness
In Section 7.2 we discuss the case where multiple hypotheses are being assessed in the same trial with a shared control group, with each hypothesis being tested and reported individually. If superiority in more than one of these hypotheses could contribute as separate pieces of evidence towards a claim of effectiveness for a therapy, a more stringent adjustment is required for the evidence to be equivalent to that obtained from two independent trials, as discussed in Section 6.
We have shown that the correlation due to the shared control group increases the chance of falsely declaring more than one experimental treatment group to be superior to the shared control group (MSFP) in a multi-arm trial over that chance had the hypotheses been assessed in independent trials. Standard multiple testing adjustment methods do not adequately control for this. We have proposed a critical value adjustment to control the chance of MSFP outcomes in a three-arm trial in order for the evidence to be equivalent to that obtained from two independent trials.
Care should always be taken in reporting and interpretation if more than one hypothesis within a multi-arm trial with shared control group is positive.
25
DRH is funded by a Doctoral Research Fellowship from the National Institute for Health Research (NIHR) [reference number DRF-2012-05-364]. This paper presents independent research funded by the NIHR. The views expressed in this publication are those of the authors and not necessarily those of the NHS, the NIHR or the Department of Health.
References
1. Parmar MKB, Carpenter J and Sydes MR. More multiarm randomised trials of superiority are needed. The Lancet. 2014; 384: 283-4.
2. CPMP (Committee for Proprietary Medicinal Products). Point to Consider on multiplicity issues in clinical trials. EMEA (European Medicines Agency), 2002.
3. Wason J, Magirr D, Law M and Jaki T. Some recommendations for multi-arm multi-stage trials. Statistical Methods in Medical Research. 2012.
4. Bender R and Lange S. Adjusting for multiple testing—when and how? Journal of Clinical Epidemiology. 2001; 54: 343-9.
5. Freidlin B, Korn EL, Gray R and Martin A. Multi-Arm Clinical Trials of New Agents: Some Design Considerations. Clinical Cancer Research. 2008; 14: 4368-71.
6. Proschan MA and Waclawiw MA. Practical Guidelines for Multiplicity Adjustment in Clinical Trials. Controlled Clinical Trials. 2000; 21: 527-39.
7. Wason JM, Stecher L and Mander A. Correcting for multiple-testing in multi-arm trials: is it necessary and is it done? Trials. 2014; 15: 364.
8. Cook RJ and Farewell VT. Multiplicity Considerations in the Design and Analysis of Clinical Trials. Journal of the Royal Statistical Society Series A (Statistics in Society). 1996; 159: 93-110.
9. Rothman KJ. No Adjustments Are Needed for Multiple Comparisons. Epidemiology. 1990; 1: 43-6.
10. ICH (International Conference on Harmonisation). Statistical Principals for Clinical Trials E9. 1998.
11. Phillips A, Fletcher C, Atkinson G, et al. Multiplicity: discussion points from the
Statisticians in the Pharmaceutical Industry multiplicity expert group. Pharmaceutical Statistics. 2013; 12: 255-9.
12. Maughan TS, Adams RA, Smith CG, et al. Addition of cetuximab to oxaliplatin-based first-line combination chemotherapy for treatment of advanced colorectal cancer: results of the
26
13. Westfall P and Bretz F. Multiplicity in Clinical Trials. Encyclopedia of Biopharmaceutical Statistics, Third Edition. Taylor & Francis, 2014, p. 889-96.
14. Fernandes N and Stone A. Multiplicity adjustments in trials with two correlated comparisons of interest. Statistical Methods in Medical Research. 2011; 20: 579-94.
15. Proschan M and Follman D. Multiple comparisons with control in a single experiment ver. The American Statistician. 1995; 49: 144.
16. Senn SS. Statistical issues in drug development. John Wiley & Sons, 1997.
17. Hung HMJ and Wang S-J. Challenges to multiple testing in clinical trials. Biometrical Journal. 2010; 52: 747-56.
18. Follmann DA, Proschan MA and Geller NL. Monitoring Pairwise Comparisons in Multi-Armed Clinical Trials. Biometrics. 1994; 50: 325-36.
19. Dunnett CW. A Multiple Comparison Procedure for Comparing Several Treatments with a Control. Journal of the American Statistical Association. 1955; 50: 1096-121.
20. Abdi H. Bonferroni and Sidak corrections for multiple comparisons. In: Salkind NJ, (ed.). Encyclopedia of Measurement and Statistics. Thousand Oaks, CA: Sage, 2007, p. 103-7.
21. Holm S. A simple sequentially rejective multiple test procedure. Scandinavian journal of statistics. 1979: 65-70.
22. Hochberg Y. A sharper Bonferroni procedure for multiple tests of significance. Biometrika. 1988; 75: 800-2.
23. Dunnett CW and Tamhane AC. A Step-Up Multiple Test Procedure. Journal of the American Statistical Association. 1992; 87: 162-70.
24. FDA. Providing Clinical Evidence of Effectiveness for Human Drug and Biological Products. Rockville, MD1998.
27
Appendix 1a: R code to calculate the probabilities for the rejection regions based on two correlated comparisons, assuming a bivariate normal distribution.
#Install library first use setInternet2(TRUE)
install.packages("mvtnorm") library(mvtnorm)
#Bivariate normal case (2 experimental arms)
#set correlation corr <- 0
#correlation matrix
corrmat <- matrix(c(1,corr,corr,1),ncol=2,byrow=TRUE)
#Exactly 1 error (calculate probabilities for the edges #excluding the corners of the square)
# Left hand side
leftside <- pmvnorm(lower=c(-Inf,-1.96), upper=c(-1.96,1.96), corr = corrmat )
# Right hand side
rightside <- pmvnorm(lower=c(1.96,-1.96), upper=c(Inf,1.96), corr = corrmat )
# Top edge
topside <- pmvnorm(lower=c(-1.96,1.96), upper=c(1.96,Inf), corr = corrmat )
# Bottom edge
bottomside <- pmvnorm(lower=c(-1.96,-Inf), upper=c(1.96,-1.96), corr = corrmat )
# Total chance of exactly 1 error
oneonly=leftside+rightside+topside+bottomside
#Exactly 2 errors (calculate probabilities in each of the 4 corners of the square)
# Lower left corner
lowleft <- pmvnorm(lower=c(-Inf,-Inf), upper=c(-1.96,-1.96), corr = corrmat )
# Lower right corner
lowright <- pmvnorm(lower=c(1.96,-Inf), upper=c(Inf,-1.96), corr = corrmat )
# Upper Left corner
upleft <- pmvnorm(lower=c(-Inf,1.96), upper=c(-1.96,Inf), corr = corrmat )
# Upper Right corner
upright <- pmvnorm(lower=c(1.96,1.96), upper=c(Inf,Inf), corr = corrmat )
# Total chance of exactly 2 errors
twoonly <- lowleft+lowright+upleft+upright
# FWER
FWER <- oneonly+twoonly
# Probability of any two errors (FMER) FMER <- twoonly
# MSFP probability of two superior false positives MSFP <- upright
28
FWER FMER MSFP
Appendix 1b: R code to calculate the probabilities for the rejection regions based on three correlated comparisons, assuming a trivariate normal distribution.
# Install library first use setInternet2(TRUE)
install.packages("mvtnorm") library(mvtnorm)
# Trivariate normal case (3 experimental arms)
#set correlation corr <- 0.5
#correlation matrix
corrmat <- matrix(c(1,corr,corr,corr,1,corr,corr,corr,1),ncol=3,byrow=TRUE)
#Exactly 1 error (illustrated by the 6 side face of a cube minus the upper and lower 5% around the edges)
Oneonly1 <- pmvnorm(lower=c(-1.96,-1.96,-Inf), upper=c(1.96,1.96,-1.96), corr = corrmat )
Oneonly2 <- pmvnorm(lower=c(-1.96,-1.96,1.96), upper=c(1.96,1.96,Inf), corr = corrmat )
Oneonly3 <- pmvnorm(lower=c(-Inf,-1.96,-1.96), upper=c(-1.96,1.96,1.96), corr = corrmat )
Oneonly4 <- pmvnorm(lower=c(1.96,-1.96,-1.96), upper=c(Inf,1.96,1.96), corr = corrmat )
Oneonly5 <- pmvnorm(lower=c(-1.96,-Inf,-1.96), upper=c(1.96,-1.96,1.96), corr = corrmat )
Oneonly6 <- pmvnorm(lower=c(-1.96,1.96,-1.96), upper=c(1.96,Inf,1.96), corr = corrmat )
# Total chance of exactly 1 error
Oneonly=Oneonly1+Oneonly2+Oneonly3+Oneonly4+Oneonly5+Oneonly6
#Exactly 2 errors (illustrated by the 12 edges of a cube minus the upper and lower 5% in the corners)
# the 3 edges that corner the triple rejection in favour of control (lower left front)
onlyllx <- pmvnorm(lower=c(-1.96,-Inf,-Inf), upper=c(1.96,-1.96,-1.96), corr = corrmat )
onlylly <- pmvnorm(lower=c(-Inf,-1.96,-Inf), upper=c(-1.96,1.96,-1.96), corr = corrmat )
onlyllz <- pmvnorm(lower=c(-Inf,-Inf,-1.96), upper=c(-1.96,-1.96,1.96), corr = corrmat )
# the 3 edges that corner the triple rejection in favour of the experimental arms (upper right back)
onlyurx <- pmvnorm(lower=c(-1.96,1.96,1.96), upper=c(1.96,Inf,Inf), corr = corrmat )
onlyury <- pmvnorm(lower=c(1.96,-1.96,1.96), upper=c(Inf,1.96,Inf), corr = corrmat )
onlyurz <- pmvnorm(lower=c(1.96,1.96,-1.96), upper=c(Inf,Inf,1.96), corr = corrmat )
29
onlylrz <- pmvnorm(lower=c(1.96,-Inf,-1.96), upper=c(Inf,-1.96,1.96), corr = corrmat )
onlyfry <- pmvnorm(lower=c(1.96,-1.96,-Inf), upper=c(Inf,1.96,-1.96), corr = corrmat )
onlylbx <- pmvnorm(lower=c(-1.96,-Inf,1.96), upper=c(1.96,-1.96,Inf), corr = corrmat )
onlyufx <- pmvnorm(lower=c(-1.96,1.96,-Inf), upper=c(1.96,Inf,-1.96), corr = corrmat )
onlyulz <- pmvnorm(lower=c(-Inf,1.96,-1.96), upper=c(-1.96,Inf,1.96), corr = corrmat )
onlybly <- pmvnorm(lower=c(-Inf,-1.96,1.96), upper=c(-1.96,1.96,Inf), corr = corrmat )
# Total chance of exactly 2 errors Twoonly <-
onlyllx+onlylly+onlyllz+onlyurx+onlyury+onlyurz+onlylrz+onlyfry+onlylbx+onlyufx+ onlyulz+onlybly
# Exactly 3 errors (Calculate probabilities in each of the 8 corners of a cube) x1y1z1 <- pmvnorm(lower=c(-Inf,-Inf,-Inf), upper=c(-1.96,-1.96,-1.96), corr = corrmat )
x2y1z1 <- pmvnorm(lower=c(1.96,-Inf,-Inf), upper=c(Inf,-1.96,-1.96), corr = corrmat )
x1y2z1 <- pmvnorm(lower=c(-Inf,1.96,-Inf), upper=c(-1.96,Inf,-1.96), corr = corrmat )
x1y1z2 <- pmvnorm(lower=c(-Inf,-Inf,1.96), upper=c(-1.96,-1.96,Inf), corr = corrmat )
x2y2z1 <- pmvnorm(lower=c(1.96,1.96,-Inf), upper=c(Inf,Inf,-1.96), corr = corrmat )
x2y1z2 <- pmvnorm(lower=c(1.96,-Inf,1.96), upper=c(Inf,-1.96,Inf), corr = corrmat )
x1y2z2 <- pmvnorm(lower=c(-Inf,1.96,1.96), upper=c(-1.96,Inf,Inf), corr = corrmat )
x2y2z2 <- pmvnorm(lower=c(1.96,1.96,1.96), upper=c(Inf,Inf,Inf), corr = corrmat )
# Total chance of exactly 3 errors
Threeonly <- x1y1z1+x2y1z1+x1y2z1+x1y1z2+x2y2z1+x2y1z2+x1y2z2+x2y2z2
#FWER – the overall error region of the sides, edges and corners FWER=Oneonly+Twoonly+Threeonly
# Probability of at least any two errors twoerr <- Twoonly+Threeonly
# Probability of three errors - sum of the corner regions threeerr <- Threeonly
# Two MSFP - probability of at least two superior false positives # Sum of the 3 edges meeting the upper right back
#(i.e. two false positives along the plane of the third distribution) # and the upper right corner
TwoMSFP <- onlyurx+onlyury+onlyurz+x2y2z2
# Three MSFP - probability of three positive false positives ThreeMSFP <- x2y2z2
30
corrmat FWER twoerr threeerr TwoMSFP ThreeMSFP
Appendix 2: R code to calculate the rejection region required to control the probability of two MSFP errors based on correlated comparisons to that for independent trials, assuming a multivariate normal distribution.
# Install library first use setInternet2(TRUE)
install.packages("mvtnorm") library(mvtnorm)
#The MSFP is the upper right corner of the rejection regions in #figure 2 (based on the standardised bivariate normal).
#The MSFP needs to be controlled at 0.000625 (0.025**2)
#set correlation corr <- 0.5
#correlation matrix
corrmat <- matrix(c(1,corr,corr,1),ncol=2,byrow=TRUE)
#Solve the critical value for the upper right corner #equalling 0.000625
upperx <- qmvnorm(p=0.000625,tail=c("upper.tail"),corr=corrmat) uppertail <- upperx$quantile