This is a repository copy of Structure of naturally hydrated ferrihydrite revealed through neutron diffraction and first-principles modeling.
White Rose Research Online URL for this paper: http://eprints.whiterose.ac.uk/121080/
Version: Accepted Version
Article:
Chappell, HF orcid.org/0000-0003-2043-0422, Thom, W, Bowron, DT et al. (3 more authors) (2017) Structure of naturally hydrated ferrihydrite revealed through neutron diffraction and first-principles modeling. Physical Review Materials, 1 (3). 036002. ISSN 2475-9953
https://doi.org/10.1103/PhysRevMaterials.1.036002
(c) 2017, American Physical Society. This is an author produced version of a paper published in Physical Review Materials. Uploaded in accordance with the publisher's self-archiving policy.
[email protected] https://eprints.whiterose.ac.uk/
Reuse
Items deposited in White Rose Research Online are protected by copyright, with all rights reserved unless indicated otherwise. They may be downloaded and/or printed for private study, or other acts as permitted by national copyright laws. The publisher or other rights holders may allow further reproduction and re-use of the full text version. This is indicated by the licence information on the White Rose Research Online record for the item.
Takedown
If you consider content in White Rose Research Online to be in breach of UK law, please notify us by
Structure of naturally hydrated ferrihydrite revealed through neutron diffraction and first-principles modeling
Helen F. Chappell1, 2*, William Thom2,3, Daniel T. Bowron4, Nuno Faria2,3, Philip J. Hasnip5 & Jonathan J. Powell2,3
1School of Earth and Environment, University of Leeds, Leeds, LS2 9JT
2MRC, Elsie Widdowson Laboratory, 120 Fulbourn Road, Cambridge, CB1 9NL, United Kingdom. 3Department of Veterinary Medicine, University of Cambridge, Cambridge, CB3 0ES, United Kingdom
4ISIS Pulsed Neutron and Muon Source, STFC-Rutherford Appleton Laboratory, Harwell-Oxford, Didcot, OX11 0QX, United Kingdom
5University of York, Department of Physics, Heslington, York, YO10 5DD, United Kingdom
(Received 8th June 2017; published 14th August 2017)
Abstract
Ferrihydrite, with a ‘two line’ X-ray diffraction pattern (2L-Fh), is the most amorphous of the iron oxides and is ubiquitous in both terrestrial and aquatic environments. It also plays a central role in the regulation and metabolism of iron in bacteria, algae, higher plants, and animals, including humans. In this study we present a single-phase model for ferrihydrite that unifies existing analytical data whilst adhering to fundamental chemical principles. The primary particle is small (20-50 Å) and has a dynamic and variably hydrated surface, which negates long-range order; collectively, these features have hampered complete characterization and frustrated our understanding of the mineral’s reactivity and chemical/biochemical function. Near and intermediate range neutron diffraction (NIMROD) and first principles density functional theory (DFT) were employed in this study to generate and interpret high resolution data of naturally hydrated, synthetic 2L-Fh at standard temperature. The structural optimization overcomes transgressions of coordination chemistry inherent within previously proposed structures, to produce a robust and unambiguous single-phase model.
DOI: 10.1103/PhysRevMaterials.1.036002
I. INTRODUCTION
Ferrihydrite (Fh) is a hydrated iron oxide mineral, ubiquitous in geochemical systems
and in biology despite a high solubility product (log10*KSO, ~3.96) and tendency towards
consequence of the latter, Fh precipitates readily from aqueous systems across a wide range of pHs (≥2) in preference to slower forming stable minerals such as goethite and
hematite. The large specific surface area (>600m2/g) of its typical nanocrystalline
agglomerates, and associated structural disorder, engender much of Fh’s unique chemistry but also hamper characterization. Thus, despite crucial roles in nature [1, 2, 3], biology [4], technology [5] and medicine [6], the mineral structure of Fh remains contentious.
Two-line ferrihydrite (2L-Fh), so termed because of the two broad Bragg peaks observed with X-ray diffraction, is the primary natural form of the mineral and has
recently been shown to nucleate from a Fe13 Keggin ion precursor [7]. With a primary
particle size of only 2-5 nm [8] the structural features of 2L-Fh are dominated by surface atoms. This large surface:volume ratio coupled with the consequent loss of long-range order has foiled multiple techniques in the absolute characterization of 2L-Fh particles. Moreover, the mineral surface is dynamic and hydrated, and all attempts to stabilize the core mineral phase through high temperature treatment have led to surface water loss and inevitable structural changes. For example, Harrington et al heated their 2L-Fh samples to 300 °C for 30 minutes under vacuum to increase the crystallinity of the mineral core and remove noise in the neutron diffraction analysis [9]. As a result, structures for 2L-Fh have been proposed from a suite of techniques that have used ferrihydrite in a multitude of different physiochemical forms (Table I).
model, it was also unusual in suggesting that all the Fe would be octahedrally coordinated. In support of this model is the EXAFS and XANES study of Manceau et al, who, in examining the surface structure of Fh, show that the octahedral-only 3-phase
model provides a match for their experimental data 11. In contrast, there are numerous
studies, from the early EXAFS and X-ray absorption edge spectroscopy of Heald [12] and
Eggleton [13] to the electron energy loss spectroscopy study of Vaughan et al in 2012
[14], which show that the mineral contains both octahedral and tetrahedral iron sites,
although there is disagreement over the actual percentage of tetrahedral Fe. The second
predominant structure is a single-phase model, proposed by Michel et al [15, 16]. It is
based upon isostructural akdalaite and has a lot in common with the earliest structures, with its mix of octahedral and tetrahedral Fe sites [12, 13, 15], and was determined from XRD generated Pair Distribution Functions (PDFs) [9, 15]. In support of this
model are the many studies that conclude the mineral phase must include both
tetrahedrally and octahedrally coordinated Fe [Table I; 12, 13, 14, 15, 17, 18]. However,
this single-phase model demonstrates certain structural anomalies, e.g.[19, 20, 21, 22],
namely tetrahedral Fe-O bonds which are effectively too long, giving tetrahedral and octahedral volumes that are equal, and an unrealistically short bond within that same tetrahedral environment, which gives each tetrahedra a large degree of eccentricity, suggesting thermodynamic instability [20].
nanoparticulate system where there is not well-defined Bragg scattering in the F(Q). This has allowed us to use ferrihydrite dried at just 40°C, but with no subsequent high-temperature treatment that would risk significant dehydration or even phase-change.
We have revisited the previous single-phase model of Michel et al and optimized the
Study Techniques Sample Implications Towe et al, 1967
[23]
IR; XRD; differential thermal analysis
Ferritin; 2L-Fh, prepared at 85 °C. Samples dried at 50
°C & 110 °C.
Hematite-like structure; Oct & Tet
Fe sites.
Harrison et al, 1967 [4]
X-ray & electron diffraction
Ferritin Oct & Tet Fe sites
Heald et al, 1979 [12]
EXAFS Ferritin Oct & Tet Fe sites
Eggleton et al, 1988 [13] X-ray Absorption Edge Spectroscopy; electron microscopy; X-ray powder diffraction; thermal analysis
2L-Fh & 6L-Fh. Prepared at 60 °C &
75 °C respectively.
Oct & Tet (36%) Fe sites;
development of maghemite after
300 °C
Drits et al, 1993 [10]
XRD 2L-Fh & 6L-Fh 3-component
model; defective, defect-free and ultra-dispersed hematite (10%). Oct
Fe only sites. Zhao et al, 1994
[17]
XAFS 2L-Fh & 6L-Fh.
Prepared at various temperatures between 50 – 500 °C
Oct & Tet (10%) Fe sites. Tet sites at
the surface.
Manceau et al, 1997 [11]
XANES 2L-Fh & 6L-Fh
prepared at 92 °C and air-dried at 25
°C.
Oct Fe sites. Over estimation of Tet Fe sites, from previous
study (Zhao et al,[17]). Jansen et al, 2002
[24]
XRD, Neutron Diffraction
6L-Fh Prepared at 75 °C.
No hematite. 50% defective, 50% defect-free phases. Michel et al, 2007
[15]
XRD, PDFs 2L-Fh prepared at
23 °C, 3L-Fh, 6L-Fh prepared at 75 °C.
Single-phase model with both Oct & Tet
(20%) Fe sites. Rancourt et al,
2008 [19]
XRD 2L-Fh prepared at
60 °C and dried at 110 °C. 6L-Fh prepared at 75 °C.
Single-phase structure incorrect.
Malliot et al, 2011 [18]
EXAFS 2L-Fh prepared at
75 °C, air-dried. 4L-Fh, 5L-Fh & 6L-Fh.
Oct & Tet (15-35%)Fe sites.
Vaughan et al, 2012 [14]
Electron Energy Loss Spectroscopy
2L-Fh & 6L-Fh. Prepared at 70 °C.
Oct & Tet (10%) Fe sites.
This Study Neutron Diffraction,
PDFs, XRD, Elemental analysis
2L-Fh, prepared at 20°C, dried at 40°C.
TABLE I.Landmark studies in the structural analysis of ferrihydrite, illustrating the different types of samples and techniques employed.
II. METHODS
A. Synthesis of Ferrihydrite
2-line ferrihydrite (Fh) was prepared by precipitation-titration; 40 mM ferric chloride solution was neutralised via drop-wise addition of 5 M NaOH (at STP) under constant
agitation. Precipitates were filtered and washed twice with UHP H2O, yielding 3.89g of
solid product. Drying to constant mass at 40 °C yielded 2.16 g of final product.
B. X-Ray Diffraction
X-Ray diffraction data were collected with a Bruker D8 Power Diffractometer using Cu K α1 radiation, a Ge primary monochromator and a Lynx Eye Detector. The scanning
range was 5-70 degrees 2 theta at a speed of 7.5 s/step and a step size of 0.01degrees.
Bruker Eva software was used to process the data with calibration peaks fitted to references in the ICDD (international centre for diffraction data) database.
C. Elemental Analysis
oxygen flask method with a mercuric nitrate titrant solution and diphenylcarbazone indicator. Table II provides details.
Element Relative
Abundance
Fe 1 (±0.012)
O 2.4 (±0.056)
H 1.59 (±0.022)
Cl 0.03 (±0.001)
C 0.04 (±0.001)
TABLE II. Relative (to Fe) elemental abundances of synthesized 2-line ferrihydrite. The
mineral is principally composed of iron, oxygen and hydrogen – quantified by inductively coupled plasma optical emission spectrometry (ICP-OES), Unterzaucher Pyrolysis and Dumas Combustion respectively. Trace levels of carbon and chlorine arising from the mineral synthesis were detected via Dumas Combustion and the
oxygen flask method but play no fundamental role in the mineral structure. Around
FIG. 1.(a)Ferrihydrite X-ray powder diffraction pattern, overlaid with reflections for
2-line Fh. (b) Fitting of the NIMROD experimental data to a simple spherical model. (c)
Distribution of nanoparticle sizes within the sample as determined by NIMROD: peak radius is 17 Å. (Wide format – double column)
D. Neutron diffraction
Neutron diffraction experiments were carried out with the Near and InterMediate Range Order Diffractometer (NIMROD) instrument at the UK’s pulsed neutron and muon source, ISIS (Harwell-Oxford). This instrument is able to simultaneously access length scales from <1 Å to >300Å, thus providing robust bond-length information at the required length scales. Moreover, as noted above, the study was undertaken with material dried at just 40 °C thereby maintaining its natural 2L-Fh structure. A null
scattering vacuum-sealed Ti0.676Zr0.324 alloy sample holder, sealed against the
123 minutes. Collected data were corrected for background, multiple scattering and absorption, and normalized to a vanadium calibration standard using GudrunN [25].
Neutron wavelengths from 0.05 Å to 14 Å over a momentum transfer range of 0.02 Å-1 ≤
Q ≤ 50 Å-1 were used to generate the interference differential scattering cross section,
which was Fourier transformed to the Pair Distribution Function (PDF) [26].
Full and partial Pair Distribution Functions (PDFs) were calculated for modelled structures and previously published models, using PDFgui [27]. For the purposes of generating the PDFs, the models were constructed as laid out in the appropriate, previously published work [10, 15]. For the 3-phase model this required the production of a composite PDF, created from the appropriate proportions of the three structures proposed in the model: namely, defective, defect-free and hematite.
E. Computational modelling
First principles Density Functional Theory (DFT) calculations were carried out using the plane-wave simulation code, CASTEP [28]. A kinetic energy cut-off, determined through
convergence testing, of 700 eV was employed along with a Monkhorst Pack 3x3x3
k-point grid for sampling of the Brillouin zone [29], giving a maximum k-k-point separation of 0.05 2π/A. Convergence tolerances for energy change, maximum displacement,
maximum force and maximum stress were set at 1×10⁻⁵ eV atom-1, 0.001 Å, 0.03 eV Å-1
corresponding to the ferromagnetic ground state, were the same as those previously calculated by Pinney et al [34].
The starting structure for the single-phase model, which is isostructural with akdalaite,
has a P63mc space group and lattice parameters of a=b=5.95 Å and c=9.06Å [15].
However, the space group was altered to P1 for the DFT simulation, to allow complete freedom of all parameters, thus removing the a=b constraint. It should be noted however, that notwithstanding this relaxation in the crystal symmetry, the structure did retain a=b lattice parameters at the completion of the geometry optimization.
III. RESULTS & DISCUSSION
A. Ferrihydrite sample analysis
XRD analysis of synthetic ferrihydrite was undertaken to provide mineral phase confirmation. This yielded two diffuse maxima, which was both typical of and consistent with reference peaks for 2-L Fh (Fig. 1(a)).
Further to this phase confirmation, we used the NIMROD neutron diffraction data to interrogate both particle size and shape. Fitting a two-sphere correlation model to the low-Q region of the NIMROD data (0.02 < Q < 1.0) (Fig. 1(b)) yielded positive results, suggesting a good fit with a spherical particle shape. A nanocrystallite size distribution was also produced with a mean particle diameter of 3.4 nm ± 0.5 Å (Fig. 1(c)), which falls within the expected size range (2-5 nm diameter) of 2-line Fh, as previously determined from High-Resolution TEM [8].
Elemental analysis (Table II) suggests a formula of 5Fe2O3.8H2O, in line with bulk Fh
[24] or a heavily hydrated form of Fh as proposed by Michel et al [15], namely
Fe10O14(OH)2.7H2O. Hiemstra et al determined that Fh particle hydration inversely
particles, to ~14 % for 3 nm particles and below 10 % for 8 nm diameter particles [35, 36]. Our analysis indicates that the water content of this synthetic Fh (15.3 %) is slightly higher than the reported values for 3 nm Fh particles, attributable to the retention of
physisorbed surface water, a consequence of the low drying temperature (40 °C) used
to preserve local Fh structure [18]. It is worth noting that according to the calculations of Hiemstra et al, a 2.5 nm particle could be classed almost entirely as ‘surface’ with at least 67 % of the tetrahedral Fe being directly bound to a surface moiety and the surface ‘felt’ by most of the other ions [35]. This is indicative of the amorphous nature of the mineral, and hence its lack of long-range order. Indeed, a recent study using Mössbauer spectroscopy showed that atomic vacancies and structural disorder are most prevalent at the particle surface, which may be a reason why smaller particles appear to have the greatest amount of disorder [37].
B. Pair distribution function analysis
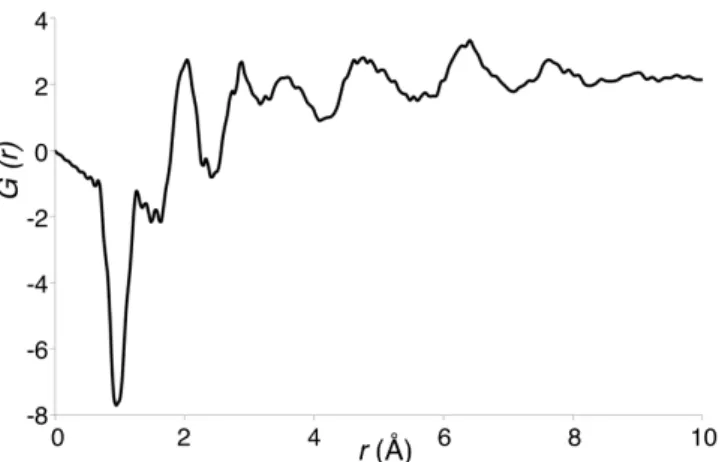
FIG. 2. Neutron-diffraction generated all-ion PDF for fully-hydrated synthesized 2-line ferrihydrite. The large negative trough at 0.95 Å is accounted for by an O-H correlation.
Despite drying, the large trough at 0.95 Å indicates that a substantial amount of hydrogen remains in the material. Due to hydrogen’s negative scattering length, hydrogen associated peaks, such as O-H, have negative intensities or dampened positive signals. This distance (0.95 Å) is slightly shorter than the O-H distance in water (0.98 Å), which points towards the hydrogen being found in OH groups, principally on the surface, rather than as structural water. In a previous neutron diffraction study on a heated deuterated ferrihydrite sample, this trough can be seen as a positive peak at approximately the same r-value [9].
FIG. 3.Neutron-diffraction generated all-ion PDF for synthetic 2-line ferrihydrite (black) compared with, in red, (a) the all-ion PDF of the original single-phase 2-line model [15] and (b) the 3-phase model [10]. The fully crystalline model PDFs have been attenuated
using an exponential function, G(r) = G(r)0*e-0.234r, to mimic the decay signal at larger
distances (r-values) that would be found in a nanoparticulate sample. This exponential was intended not as a fit to the experimental data, but simply to remove the long-range crystallinity inherent in the modelled PDFs. The insets show Peak A, which represents the first Fe-O bond length, in detail.
As shown in Fig. 4(c), peaks a, d and f (as labelled in Fig. 4(a)) are almost entirely identifiable as the distances between Fe and O ions. Peak c is strongly accounting for both the Fe-Fe (Fig. 4(b)) and Fe-O (Fig. 4(c)) distances. However, other peaks, particularly b and e, represent a number of different ion-ion pairs. Thus, with reference to Fig. 2, the average Fe-O bond length in the synthesized Fh is 2.04 Å, with further Fe-O distances of 4.77 Å and 6.42 Å. Other peaks were not securely assigned to particular ion pairs, due to overlap in signal.
The experimental Fe-O bond length (2.04 Å) is closer to the single-phase model (2.00 Å, [15]) than the 3-phase model (1.90 Å, [10]), although it should be noted that this single-phase model includes heavily distorted Fe tetrahedra that have one shorter Fe-O bond, in defiance of Pauling’s second law. The 3-phase model Fe-O bond length, obtained from the composite PDF, fits poorly to the new data and to other reported Fe-O distance data (1.97 A) obtained via X-ray absorption fine structure (EXAFS) spectroscopy [18]. Even if the proportions of the defective and defect-free phases are varied for this latter model, it is only when the model reaches its defect-free maximum that the Fe-O peak, at around 1.93 Å, approaches the lowest point of the experimental data peak. Doing this, however, eliminates the amorphous character of the mineral (which was effectively modelled by the defective phase), making the structure altogether unrealistic.
the same, which is dubious [21]. Notwithstanding, as a starting point, we took this best current estimate of the 2-line single-phase structure [15] and, using DFT, performed a geometry optimization to see if improvements could be made that match the experimental NIMROD data (previous DFT optimization has been reported but using the 6-line single-phase structure as the starting position [34]). The lattice parameters for the resulting model are presented in Table III. Although we did not constrain the a and b parameters, unlike in the work with the refined 6-line model [34], they did, nevertheless, remain equal.
In the refined structure, the a and b parameters are reduced compared to the prior
state-of-the-art 2L-Fh model (Table III), while the c parameter is increased; an even
greater increase in the c parameter is also observed in the previous 6-line Fh DFT
Parameter Optimized 2-line DFT
Single-phase 2-line (18) a (Å) 5.84 (-1.9 %) 5.96 b (Å) 5.84 (-1.9 %) 5.96 c (Å) 9.15 (+2.1 %) 8.97
Volume (Å3) 270.66 (-1.8 %) 275.60
TABLE III. Lattice parameters of the new DFT-optimized ferrihydrite model, compared
to the 2-line single-phase model of Michel et al [15]. The % values in brackets, are the difference between the given DFT model and that of Michel et al [15].
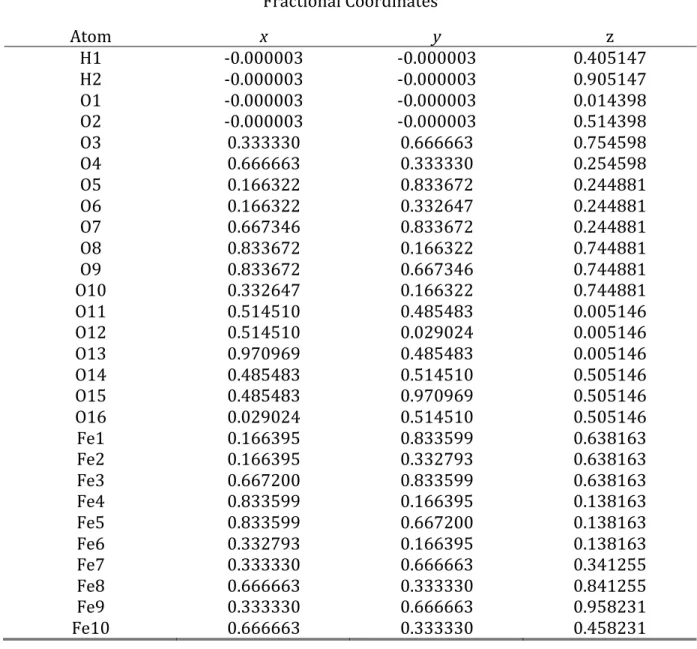
Lattice Parameters
a (Å) b (Å) c (Å) α (¡) β (¡) γ (¡)
5.843 5.843 9.154 90.000 90.000 120.000
Space Group: P63mc
Fractional Coordinates
Atom x y z
H1 H2 O1 O2 O3 O4 O5 O6 O7 O8 O9 O10 O11 O12 O13 O14 O15 O16 Fe1 Fe2 Fe3 Fe4 Fe5 Fe6 Fe7 Fe8 Fe9 Fe10 -0.000003 -0.000003 -0.000003 -0.000003 0.333330 0.666663 0.166322 0.166322 0.667346 0.833672 0.833672 0.332647 0.514510 0.514510 0.970969 0.485483 0.485483 0.029024 0.166395 0.166395 0.667200 0.833599 0.833599 0.332793 0.333330 0.666663 0.333330 0.666663 -0.000003 -0.000003 -0.000003 -0.000003 0.666663 0.333330 0.833672 0.332647 0.833672 0.166322 0.667346 0.166322 0.485483 0.029024 0.485483 0.514510 0.970969 0.514510 0.833599 0.332793 0.833599 0.166395 0.667200 0.166395 0.666663 0.333330 0.666663 0.333330 0.405147 0.905147 0.014398 0.514398 0.754598 0.254598 0.244881 0.244881 0.244881 0.744881 0.744881 0.744881 0.005146 0.005146 0.005146 0.505146 0.505146 0.505146 0.638163 0.638163 0.638163 0.138163 0.138163 0.138163 0.341255 0.841255 0.958231 0.458231
TABLE IV. Complete structural parameters for the new DFT-optimized ferrihydrite
model. The structure was optimized with a P1 space group to allow the structure to
relax with complete freedom. On completion, the space group was recalculated and
Although not a defining feature of the ferrihydrite phase compared to other iron oxides and oxo-hydroxides, it is worth noting that the Fe-Fe bond lengths obtained from the DFT optimization, at 2.92 Å and 3.20-3.54 Å, are entirely in keeping with a structure of this chemical composition. For comparison, the neutron diffraction data predicts these peaks at 2.89 Å and 3.41-3.58 Å, although it is recognized that these peaks also contain some contributions from other ion pairs (see Fig. 4) and hence do not correspond precisely to the Fe-Fe distances. Fe-O bond lengths in the DFT model were also analysed and bond populations calculated using the Mulliken formalism to define electron distribution between ions [39]. Octahedral Fe sites were little changed, at 2.00 Å, compared to those of the original single-phase model, but significant differences emerged for the tetrahedral Fe sites. Table V shows the refined bond lengths and bond populations for tetrahedral Fe.
Previous Single-phase Model DFT-optimized Model Fe-O Bond Population
(|e|)
Fe-O Bond Length (Å)
Fe-O Bond Population (|e|)
Fe-O Bond Length (Å)
0.38 1.959 0.42 1.864
0.45 2.019 0.49 1.883
0.45 2.019 0.49 1.883
0.45 2.019 0.49 1.883
TABLE V. The calculated bond populations and bond lengths of the Fe-O bonds for the
The DFT refinements led to increased bond populations and shortened tetrahedral Fe-O bond lengths, resolving several criticisms of the previous single-phase model. Crucially, tetrahedral Fe-O bond lengths are contracted to an energetically more favourable 1.88 Å, reflecting the increased electrostatic bond strength associated with lower coordination environments. Whilst a previous DFT refinement [34] partially addressed this failing of the original model, their tetrahedral Fe-O bond length (1.92 Å) remained
outside the plausible range for Fe3+tetrahedral sites [21, 40]. Furthermore, tetrahedral
distortion has been virtually eliminated and site volume was reduced by 17 %, as shown in Fig. 5(a).
FIG. 5. (a) DFT-optimized single-phase 2-L ferrihydrite. The tetrahedral Fe ions are shown in green and the octahedral Fe ions in orange. In this new structure, the tetrahedral Fe site is reduced by 17 % compared to the original single-phase model
[15]. The new Fetet-O bond lengths are 1.883 Å (blue-banded) and 1.864 Å
sites completely visible, and all surfaces have periodic boundary conditions. (b) Simulated XRD patterns for the previous (black) and refined (red) single-phase models.
While in the previous single-phase structure both the tetrahedral and octahedral Fe ions have average Fe-O bond lengths of 2.00 Å [15], in our new DFT optimization, Table IV, the octahedral Fe-O bonds retain a 2.00 Å average but the tetrahedral average is now 1.88 Å. Crucially, plausible tetrahedral Fe-O bond lengths were achieved and these were in line with expectations for such an Fe site based upon published comparisons of inorganic crystal structures [21, 41]. This refinement therefore remains consistent with our experimental data (average Fe-O bond length of 2.04 Å) but significantly reduces the tetrahedral site volume. Furthermore, the eccentricity of this tetrahedral volume has been significantly reduced with just 1 % (rather than 3 % [15]) difference between the ‘short’ bond and the other bonds of the tetrahedra. The previous DFT 6-line refinement also reduced the tetrahedral Fe-O bond length but to a lesser extent, to 1.92 Å [34], and still above the range cited by other authors as acceptable [21].
While these refinements resolve the previous chemical inconsistencies, it is clearly important that the new structure is able to reproduce XRD features of the original model, being consistent with experimental XRD data. Figure 5(b) shows simulated XRD patterns for both the original single-phase 2-line structure [15] and the new refinement; it is clear that this new refinement retains good fit with the original data, and the two
major peaks at around 35° and 63° are consistent with those in our own heavily
IV. CONCLUSIONS
The NIMROD instrument at ISIS was able to produce an accurate diffraction pattern with 2L-Fh material dried at ambient temperatures, which, for the first time, obviated dehydration and removed the possibility of phase-transformation through heating steps that were necessary for analysis with prior instrumentation. Naturally hydrated nanoparticulate 2-line ferrihydrite has an extremely large surface: volume ratio and has a surface that is heavily populated with OH groups, accounting for more than 15 % of the particle weight. Our results are best explained by a single-phase model that allows for tetrahedrally coordinated iron, in contrast to the octahedral-only 3-phase model, which is incompatible with the primary Fe-O bond length and amorphous characteristics of the mineral.
Crucially, following DFT optimization of the previous state-of-the-art single-phase
model [15], we can now propose a structure that has lattice parameters fully consistent with experimental data and with tetrahedral Fe sites that do not conflict with basic principles of coordination chemistry. We present a model that has a refined and yet simplified crystallography and is consistent with both the experimental XRD diffraction pattern and the neutron PDF of naturally-hydrated ferrihydrite.
ACKNOWLEDGEMENTS
(Grant No. MC_U105960399) for their support. Work was carried out on the ISIS Nimrod instrument over three days under STFC experiment RB1400012. The authors would like to thank Lesley Neve at the School of Earth and Environment, University of Leeds, for carrying out the XRD measurements, Alan Soper (Rutherford Appleton Laboratory) for help with analyzing the particle shape and Andy Brown at the University of Leeds for reviewing the final draft.
H.F.C, W.T., D.T.B. and N.F. all contributed to running the neutron diffraction experiments at ISIS, Harwell. H.F.C and P.J.H. carried out the modelling component of the project. All authors were involved in discussions as to the objectives and interpretation of the final results. The manuscript was written by H.F.C. with contributions from all authors, and editing from D.T.B and J.J.P.
References
[1] T. A. Jackson and W. D. Keller, Am. J. Sci. 269, 446 (1970).
[2] A. C. Birnie and E. Paterson, Geoderma. 50, 219 (1991).
[3] J. L. Jambor and J. E. Dutrizac, Chem. Rev. 98, 2549 (1998).
[4] P. M. Harrison, Fa. Fischbac, T.G. Hoy and G. H. Haggis, Nature 216, 1188 (1967).
[5] Y. Wu, W. Zhang, W. Yu, H. Liu, R. Chen and Y. Wei, Front. Environ. Sci. Eng. 9, 411
(2015).
[6] S. Neiser, F. Rentsch, U. Dippon, A. Kappler, P. G. Weidler, J. Göttlicher, R. Steininger,
M. Wilhelm, M. Braitsch, F. Funk, E. Philipp, and S. Burckhardt, BioMetals. 28, 615
(2015).
[7] O. Sadeghi, L. N. Zakharov, and M. Nyman, Science 347, 1359 (2015).
[9] R. Harrington, D. B. Hausner, W. Xu, N. Bhandari, F. M. Michel, G. E. Brown Jr, D. R.
Strongin, and J. B. Parise, Environ. Sci. Tech. 45, 9883(2011).
[10] V. A. Drits, B. A. Sakharov, A. L. Salyn, and A. Manceau, Clay Min. 28, 185 (1993).
[11] A. Manceau, and W. P. Gates, Clays. Clay. Min. 45 (3), 448 (1997).
[12] S. M. Heald, E. A. Stern, B. Bunker, E. M. Holt and S. L. Holt, J. Amer. Chem. Soc. 101,
67 (1979).
[13] R. A. Eggleton, and R. W. Fitzpatrick, Clays. Clay. Min. 36 (2), 111 (1998).
[14] G. Vaughan, R. Brydson, and A. Brown, J. Phys. Conf. Ser. 371, 012079 (2012).
[15] F. M. Michel, L. Ehm, S. M. Antao, P. L. Lee, P. J. Chupas, G. Liu, D. R. Strongin, M. A. A. Schoonen, B. L. Phillips and J. B. Parise, Science 316, 1726 (2007).
[16] F. M. Michel, V. Barrón, J. Torrent, M. P. Morales, C. J. Serna, J-F. Boily, Q. Liu, A.
Ambrosini, A. C. Cismasu and G. E. Brown Jr, PNAS. 107, 2787 (2010).
[17] J. Zhao, F. E. Huggins, Z. Feng and G. P. Huffman, Clays. Clay. Min. 42 (6), 737
(1994).
[18] F. Malliot, G. Morin, Y. Wang, D. Bonnin, P. Ildefonse, C. Chaneac and G. Calas,
Geochim. Cosmochim. Acta. 75, 2708(2011).
[19] D. G. Rancourt, and J-F. Meunier, Am. Min. 93, 1412 (2008).
[20] A. Manceau, S. Skanthakumar and L. Soderholm, Am. Min. 99, 102(2014).
[21] A. Manceau, Clay Min. 44, 19 (2009).
[22] A. Manceau, Am. Min. 96, 521 (2011).
[23] K. M. Towe and W. F. Bradley, J. Coll. Inter. Sci. 24, 384 (1967).
[24] E. Jansen, A. Kyek, W. Schäfer and U. Schwertmann, Appl. Phys. A. 74, S1004
(2002).
[25] A. K. Soper, Rutherford Appleton Laboratory Technical Report RAL-TR-2011-013,
[26] A. K. Soper and E. R. Barney, J. Appl. Cryst. 45, 1314 (2012).
[27] C. L. Farrow, P. Juhás, J. W. Liu, D. Bryndin, E. S. Božin, J. Bloch, Th. Proffen and S. J.
Billinge, J. Phys. Condens. Matter. 19, 335219 (2007).
[28] S. J. Clark, M. D. Segall, C. J. Pickard, P. J. Hasnip, M. I. J. Probert, K. Refson and M. C.
Payne, Z. Kristallogr. 220, 567 (2005).
[29] H. J. Monkhorst and J. D. Pack, Phys. Rev. B. 13, 5188 (1976).
[30] D. Vanderbilt, Phys. Rev. B. 41, 7892 (1990).
[31] M. C. Payne, T. A. Arias and J. D. Joannopoulos, Rev. Mod. Phys. 64, 1045 (1992).
[32] M. Cococcioni and S. de Gironcoli, Phys. Rev. B. 71, 035105 (2005).
[33] N. Marzari, D. Vanderbilt and M. C. Payne, Phys. Rev. Lett. 79, 1337 (1997).
[34] N. Pinney, J. D. Kubicki, D. S. Middlemiss, C. P. Grey and D. Morgan, Chem. Mater. 21,
5727 (2009).
[35] T. Hiemstra, Geochim. Cosmochim. Acta. 105, 316 (2013).
[36] W. Xu, D. B. Hausner, R. Harrington, P. L. Lee, D. R. Strongin and J. B. Parise, Am.
Min. 96, 513 (2011).
[37] X. Wang, M. Zhu, L. K. Koopal, W. Li, W. Xu, F. Liu, J. Zhang, Q. Liu, X. Feng and D. L.
Sparks, Environ. Sci. Nano. 3, 190 (2016).
[38] See supplemental Materials at http://link.aps.org/supplemental/ 10.1103/PhysRevMaterials.1.036002 for the new ferrihydrite structure file.
[39] M. Segall, R. Shah, C. J. Pickard and M. C. Payne, Phy. Rev. B. 54, 16317 (1996).
[40] A. N. Shmakov, G. N. Kryukova, S. V. Tsybulya, A. L. Chuvilin and L. P. Solovyeva, J.
Appl. Cryst. 28, 141 (1995).
![FIG. 3. Neutron-diffraction generated all-ion PDF for synthetic 2-line ferrihydrite (black) compared with, in red, (a) the all-ion PDF of the original single-phase 2-line model [15] and (b) the 3-phase model [10]. The fully crystalline model PDFs have be](https://thumb-us.123doks.com/thumbv2/123dok_us/7738081.164361/14.892.118.780.113.384/neutron-diffraction-generated-synthetic-ferrihydrite-compared-original-crystalline.webp)
![FIG. 4. The split all-ion PDF of the single-phase 2-line model [15]. The all-ion PDF is shown in black in each frame and the individual PDFs are shown in red. (a) all-ion, (b) Fe-Fe, (c) Fe-O, (d) O-O, (e) Fe-H, (f) O-H. The H-H PDF only h](https://thumb-us.123doks.com/thumbv2/123dok_us/7738081.164361/17.892.113.770.112.455/split-single-phase-model-black-individual-pdfs-shown.webp)