This is a repository copy of Effect of plutonium doping on radiation damage in zirconolite: A computer simulation study.
White Rose Research Online URL for this paper: http://eprints.whiterose.ac.uk/79735/
Version: Accepted Version
Article:
Foxhall, H.R., Travis, K.P. and Owens, S.L. (2014) Effect of plutonium doping on radiation damage in zirconolite: A computer simulation study. Journal of Nuclear Materials, 444 (1-3). 220 - 228. ISSN 0022-3115
https://doi.org/10.1016/j.jnucmat.2013.09.036
[email protected] https://eprints.whiterose.ac.uk/ Reuse
Unless indicated otherwise, fulltext items are protected by copyright with all rights reserved. The copyright exception in section 29 of the Copyright, Designs and Patents Act 1988 allows the making of a single copy solely for the purpose of non-commercial research or private study within the limits of fair dealing. The publisher or other rights-holder may allow further reproduction and re-use of this version - refer to the White Rose Research Online record for this item. Where records identify the publisher as the copyright holder, users can verify any specific terms of use on the publisher’s website.
Takedown
If you consider content in White Rose Research Online to be in breach of UK law, please notify us by
Effect of plutonium doping on radiation damage in
zirconolite: a computer simulation study.
Henry R. Foxhall
a*, Karl P. Travis
aand Scott L. Owens
ba
Immobilisation Science Laboratory, Department of Materials Science and
Engineering, University of Sheffield, Sheffield S1 3JD, UK
b
National Nuclear Laboratory, 5th Floor, Chadwick House, Warrington Road,
Birchwood Park, Warrington, Cheshire, WA3 6AE, UK
* Corresponding Author Henry Foxhall
Department of Materials Science and Engineering Sir Robert Hadfield Building
Mappin Street Sheffield, S1 3JD U.K.
Email: [email protected]
Abstract
We present the results of extensive Molecular Dynamics (MD) simulations of
alpha-recoil radiation damage in a range of crystalline zirconolites, CaZrTi2O7. Our studied
systems include pure zirconolite, which we use as a reference material and the first
ever simulations of damage in Pu-doped zirconolite, where plutonium is doped onto
both of the M1 sites in the material, i.e. (Ca0.7Pu0.3)ZrTi2O7 and
Ca(Zr0.7Pu0.3)(Ti1.7Fe0.3)O7. Our goal was to determine the extent of local damage
caused by a plutonium primary knock on atom (PKA) interacting with the crystal
lattice. Recoil energies of up to 34.7 keV have been simulated. The damage is
characterised using a number of analysis tools including: site specific radial
distribution functions; defect statistics; and the asphericity parameter at various times
during the annealing process. Our results show that there is much information to be
gained by the use of novel techniques for radiation damage analysis. Also, we show
inclusion of actinides in radiation damage simulations can significantly increase the
extent of damage observed and should be considered carefully when describing
1.1
Introduction
SYNROC is the collective name for a family of multiphase ceramic wasteforms
developed by Ringwood et al. [1] as candidate materials for immobilising rare earth
elements (REE) and actinides (ACT). Containing three titanate phases: hollandite,
zirconolite and perovskite, different formulations are designed to mimic naturally
occurring crystalline rocks in which radioactive REEs and ACTs are found in solid
solution and have remained stable over geological timescales, despite their propensity
to amorphize as a consequence of repeated radiation damage from α-recoil events. In
the UK, which has the worldÕs largest stockpile of civil plutonium (ca. 110 tons) [2],
a wasteform based on SYNROC-C in which zirconolite is the major phase is being
considered for immobilisation of plutonium (Pu) residues through a processing route
involving Hot Isostatic Pressing (HIPing).
For zirconolite to be used as a Pu host phase, a thorough knowledge of the
mechanisms underpinning the amount of local damage sustained from alpha decay
events, and more importantly, how and when the material recovers or heals, is of
paramount importance. Current understanding is that the recoil atom from an alpha Ð
decay, known as the Primary Knock on Atom (PKA) moves through the crystalline
lattice, elastically colliding with other atoms and displacing them from their lattice
positions [3, 4]. A succession of these cascades over a long period of time will lead to
swelling and structural changes, which will have detrimental effects on the chemical
and mechanical properties of the material, ultimately leading to reduced retention of
actinides. Despite a good deal of experimental and theoretical studies into the
behaviour of ceramics (including zirconolite) undergoing alpha damage [5-7] many
puzzles remain. Open questions include: Òwhy are some ceramics more resistant to
radiation-induced amorphization than others?Ó and Òof those ceramics which have
undergone a crystalline to amorphous phase transition, why are some geologically
stable?Ó Using topological arguments, we have recently begun to answer both of these
questions, by analysing large-scale Molecular Dynamics (MD) simulations of alpha
decay in models of zirconolite [8].
There have been many computer simulation studies of radiation damage in
ceramic materials [9-14], but only a few concern zirconolite. Gilbert & Harding [15]
and Mulroue et al. [16] have studied the energetics of individual defects and
investigate the intermediate-range effects of radiation damage in zirconolite.
However, due to computer constraints, the recoil energies for Veiller et al were
limited to < 12 keV, lower than the ~100 keV energy of a U recoil atom. Advances in
computing (both in hardware and algorithms) have enabled both the simulation of
more realistic recoil energies (requiring large system sizes > 1 million atoms) and
long time scales (20 ps) are now commonplace, indeed MD simulations with billions
of atoms will soon become routine. Using classical MD it is also possible to calculate
the threshold displacement energy, Ed i.e. the amount of energy needed to
permanently displace atoms from their lattice positions and form interstitial defects.
These were calculated by Veiller et al. [17], where Ed ranged from 15 eV for oxygen,
to 48 eV for Zr, comparing well with available Ed values from experimental
observations. Their work also included an MD study of defect formation in cascades
due to PKAs with energies between 2 and 12 keV.
Detailed experimental analysis of radiation damage in natural and synthetic
zirconolite samples [5] has looked at many of the issues relating to their use as host
matrices for Pu, but due to radiation protection and security issues laboratory-based
research using Pu is difficult, costly and time consuming. Acknowledging previously
published studies on Pu-containing zirconolite [18, 19], there is still a need for a
greater understanding of how the presence of actinides changes the radiation
behaviour and tolerance of a material. MD is a powerful tool in the quest for
understanding of radiation damage as it has the ability to probe length and time scales
unavailable to experimental analysis, adding weight to results of laboratory-based
analysis. These time and length scales, at the picosecond and Angstrom level, happen
to be almost exactly the time and length scales of radiation damage cascades. The first
example of radiation damage MD is found in the work of Erginsoy et al. [20, 21],
where the effects of radiation damage and recoil cascades in FCC Cu were studied.
MD also has the advantage of not requiring the use of radioactive materials, which
make it a comparatively cheap research method in the field of nuclear waste
management.
The current authors feel that, building on the work of Veiller et al., a more
complete description of damage in zirconolite is now possible for three reasons: 1)
The low recoil energies used by Veiller et al. do not fully represent the recoil energies
seen in an alpha-recoil cascade and higher recoil energies are now more routinely
analysis of the cascades on terms of size, shape and structure, and 3) The effect of
actinide incorporation on the radiation damage behaviour of zirconolite must also be
considered, but has thus far not been studied.
The present study further investigates alpha-recoil cascades in crystalline
zirconolite with the aide of MD, using larger systems and higher recoil energies than
Veiller et al. Calculations are presented on three materials: pure zirconolite,
CaZrTi2O7, zirconolite doped with Pu onto M1 sites - (Ca0.7Pu0.3)Zr(Ti1.4Fe0.6)O7
(where trivalent Fe acts as a charge balancing ion) and zirconolite with Pu doped onto
M2 sites - Ca(Zr0.7Pu0.3)O7. These materials are termed Un-doped (UZ), Ca-doped
(CAZ) and Zr-doped (ZRZ) zirconolite respectively. Our choice of model materials is
based on research by Begg & Vance [22, 23], Deschanels et al. [24] and Gilbert et al
[19] in which both groups found Pu to reside on Ca and Zr sites in their laboratory
synthesized samples. Eight damage cascades in each material are assessed in terms of
their atomic disorder, defect distribution, radial distribution functions, cascade size,
and cascade shape. The residual damage is also taken into account. The simulations of
alpha-recoil cascades in actinide-doped zirconolite are, to the authorsÕ knowledge, the
first published simulations of their type.
2.1
Methodology
2.1.1 Interaction potential
We have chosen the Buckingham potential [25] to represent atomic interactions in our
simulations:
φBUCK
( )
r =Aexp(
−ρr)
−C
r6 (1)
However, in radiation-damage simulations, high atomic kinetic energies can
lead to ionic separations that probe the divergent region of the Buckingham potential
giving rise to large, attractive, inter-atomic forces. We have therefore used a
piecewise modified potential (described in detail below) where we use the Ziegler,
Biersack and Littmark (ZBL) potential for short range interactions [26]
φZBL
( )
r =ZiZje2
4πε0r
ckexp
(
−bkra)
k=14
where Zi and Zj are the atomic numbers of atoms with the labels i and j, ε0 is the
vacuum permittivity, a = 0.88534a0 (Zi2/3+Zj2/3)-1/2 and a0 is the Bohr radius The set
of parameters:{bk,ck:k=1, 4} is taken from the literature [26].
The Buckingham potential is used solely for separations exceeding its point of
inflection (if present), or, if no dispersive term is specified, a convenient point for
joining to the ZBL potential. The parameters used for the Buckingham potential were
[image:7.595.85.397.282.454.2]those obtained by Minervini et al. [27], collected together in Table 1.
Table 1: Buckingham potential parameters for atomic pairs in zirconolite [Minervini, 1999]
Atom pair A (eV) ρ (•) C (eV •6)
O Ð O 9547.96 0.21916 32.0
Ca Ð O 784.38 0.36356 0.0
Zr Ð O 1502.11 0.3477 5.1
Ti Ð O 2131.04 0.3038 0.0
Pu Ð O 1762.84 0.3542 11.48
Fe Ð O 1414.60 0.3128 0.0
Cat - Cat 0.0 1.0 0.0
The two potentials must be joined, and many methods exist in the literature.
Switching functions provide an exponential decay of one function into the other [28]
while the use of mathematical splines matches the ends of the two potentials [10].
Some researchers have eliminated the need for a specific short range potential and
joining function completely through manipulation of the dispersion terms of their
potential - allowing atoms to be closer before such potential catastrophes occur,
making them highly unlikely [12]. It is our view that a representation of the
close-range forces should be based on the close close-range properties of atoms, as detailed by the
ZBL potential, and that an equilibrium Born-Mayer potential form is not suitable for
this application. We have chosen to use a cubic spline, which ensures both the energy
and forces in an MD simulation are smooth and continuous. The spline fitting was
carried out using an algorithm described in Numerical Recipes in Fortran [29]. The
intervals: [r1,10] and [0, r0] respectively using a grid spacing of 0.002 •. In this work
we took r0 = 0.6 •and r1= 1.0 • for all interactions except O-O and Zr-O, for which
r1 = 0.88 •. The spline fitting was performed on the range [r0, r1], and tabulated using
the same grid spacing as above, where the cubic spline potential is defined by
φSPLINE
( )
r = pkr kk=0 3
∑
(3)The composite potential is therefore
φCOMPOSITE
( )
r =φZBL r<r0 φSPLINE r0≤r≤r1 φBUCK r>r0
⎧ ⎨ ⎪
⎩
⎪ (4)
The Coulombic contribution to the potential energy, φCOUL, was evaluated by
DL_POLY using the smooth particle mesh Ewald sum method [30] and thus is not
included in the main composite potential. The total pair energy is therefore:
φTOTAL
( )
r =φCOMPOSITE+φCOUL (5)The Ewald convergence parameter (width of the Gaussian charge distribution) was
taken to be 0.28461 •-1, based on a target precision of 1x10⁻⁵ and kmax1 = kmax2 =
kmax3 = 128. All MD simulations in this work were conducted using the package
DL_POLY 3.06 [31].
2.1.2 Unit cell structure
Zirconolite is a superstructure based on an anion deficient fluorite (CaF2-xMo2-x). It
has a monoclinic structure with alternating layers of Ca/Zr ions and Ti ions. The Ti
layer comprises a hexagonal tungsten bronze (HTB) arrangement of mainly
corner-sharing [TiO6] octahedra [32]. An initial 2x2x2 supercell configuration was created
using the fractional coordinates according to Rossell and used as input to the GULP
(General Utility Lattice Program) code [33]. GULP internally handles partial
occupancies in a statistical manner, so those described by Rossell were included (7%
Ti substituted on the Zr M2 site and 14% Zr substituted on the Ti M4 site). A
Newton-Raphson energy minimisation with full relaxation of the cell size and shape
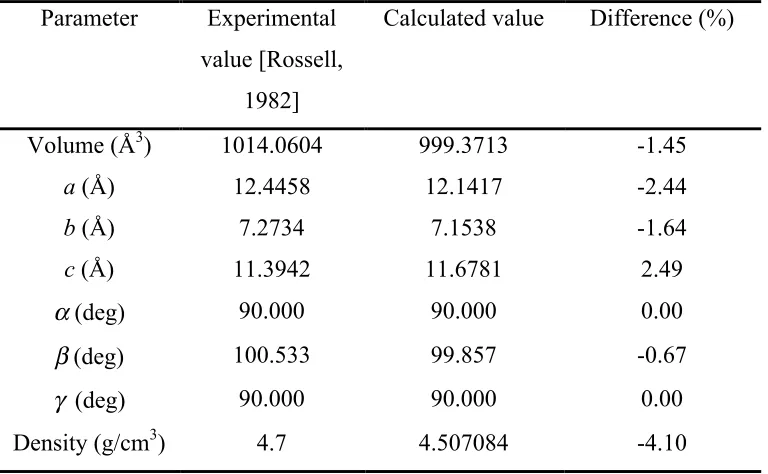
calculated lattice parameters were found to differ by less than 2.5% from the values
obtained by Rossell (see Table 2) and the density was reproduced to an acceptable
level. Phonon spectra were calculated and no negative frequencies were found.
[image:9.595.85.469.196.433.2]
Table 2: Comparison of calculated crystal unit cell parameters with experimental data for zirconolite.
Parameter Experimental
value [Rossell,
1982]
Calculated value Difference (%)
Volume (•3) 1014.0604 999.3713 -1.45
a (•) 12.4458 12.1417 -2.44
b (•) 7.2734 7.1538 -1.64
c (•) 11.3942 11.6781 2.49
α (deg) 90.000 90.000 0.00
β (deg) 100.533 99.857 -0.67
γ (deg) 90.000 90.000 0.00
Density (g/cm3) 4.7 4.507084 -4.10
For MD simulations, where statistical representation of partial occupancies
was not available, cation species were swapped on randomly chosen M2 and M4 sites
until the required partial occupancies were met. This process took place after the
supercell had been created, ensuring no replication or periodicity of substitutions was
present in the simulation cell. Supercells used in this work were 4x4x4 (5632 atoms)
for physical property calculation and 12x18x12 (228 096 atoms) for radiation damage
simulations. Ideally, a cubic system would be used to maximise the number of
directions in which cascades could be simulated with sufficient box size, and the latter
cell was designed to meet this requirement as closely as possible given the monoclinic
nature of the unit cell.
Further validation of the chosen potential was sought by calculation of the
bulk modulus. A series of equilibrium NpT runs on a 5632 atom system were
conducted at 300 K, for a set of applied pressures ranging from 300 to 1000 atm. The
vary linearly with applied pressure. The bulk modulus (inverse isothermal
compressibility) was then estimated using
κ−1 T =−V
∂p ∂V ⎛
⎝⎜ ⎞⎠⎟T, (6)
where kT is the isothermal compressibility, evaluated at the volume of the
energy-minimised simulation cell, i.e. V = 27.094 nm3 for a 5632 atom system. We obtained a
bulk modulus value of 235 GPa. While we have been unable to source a published
value for the experimentally obtained bulk modulus of zirconolite, our estimated
value compares favourably with that of 224.3 GPa, calculated by Veiller et al. [17].
Both these values are of comparable magnitude to published experimental values for
other crystalline oxide ceramics (e.g. 186 GPa for Gd2Ti2O7 [34], and 225 GPa for
zircon, ZrSiO4 [35]), providing further confidence that the potential model used is
reasonable.
Doping of Pu atoms into the system was performed as described above (for
partial occupancy creation) with substitutions made up to 30% of the Ca(M1) or
Zr(M2/M4) atoms. As before this was performed after creating the supercell. In
systems where Pu was doped onto a Ca(M1) site, charge balance was achieved by
doping trivalent Fe ions onto Ti(M3) sites, a substiution commonly found in
geological zirconolite samples.
2.1.3 Cascade simulations
In all simulations, a Pu (rather than U) atom was used as the recoil atom, greatly
simplifying the simulations by minimising the number of atomic interactions
necessary in the simulation input files. To prevent atomic interactions passing through
the periodic boundaries, a stochastic Langevin thermostat was applied to the outer 3 •
of the simulation cell using the preset DLPOLY Ôpseudo layerÕ thermostat as detailed
in the DLPOLY manual [36]. A Pu atom was then selected from the next 7 • of
simulation cell (i.e. a layer between 3 and 10 • from the very edge of the simulation
cell) to become the primary knock-on atom (PKA). The components of its velocity
were altered such that the kinetic energy equalled 34.7 keV, with the direction of
travel obtained by choosing a unit vector sampled the octant of a unit sphere (centred
Radiation damage simulations employed a variable time step integration
algorithm with an initial time step of 5 x 10⁻⁶ ps, which was modified after each
timestep so that the maximum displacement of an atom was between 0.01 and 0.05 •
per timestep. A typical 75000 time-step simulation equated to 28 ps of simulation
time.
3.1
Results and Discussion
In what follows, we use standard Kršger - Vink notation for defects, MC
S , where M is
the species, e.g an element or vacancy defect V, S is the lattice site on which it resides,
and C is the charge of the defect relative to the initial site, either negative, positive or
neutral represented by ', i and × respectively.
3.1.1 Analysis of Cascades Ð Un-doped Material
Upon introduction of a recoil atom, defects rapidly increase in number due to
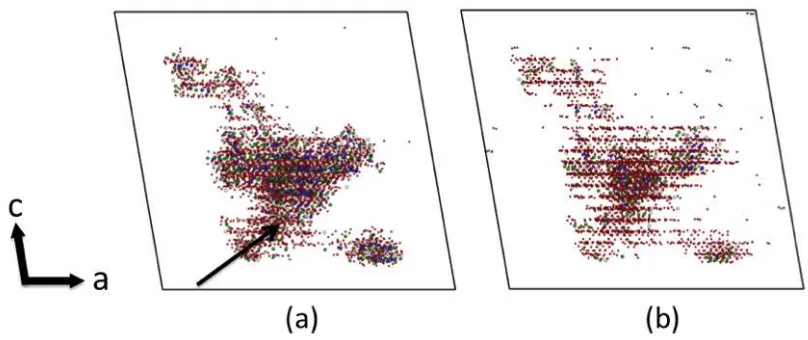
the large number of atomic collisions. A visualisation of the evolution of a typical
damage cascade is shown in Fig. 1, where atoms appear only if they have moved a
distance > 0.8 • from their initial positions (0.8 • was chosen to facilitate
[image:11.595.93.497.514.684.2]comparison with the work of Veiller et al. [17].
At its maximum size, the cascade contains several thousand atoms, but this
number decreases before reaching some asymptotic value, indicating a strong degree
of self-healing, evident from Fig 1b taken 1.5 ps after the recoil event. Many atoms
return to their respective sub-lattices and remain in the visualisations in Figure 1b
because the sites on which they now reside are not those on which they started.
Distinct lines of oxygen atoms are visible due to Frenkel pair recombination
(Oi"+VOii →OO
×
) along the HTB layers Ð highlighting increased structural
rearrangement in these areas. We have shown in previous work [8] that there is
significant polymerisation of the [TiOx] polyhedra during radiation damage in
zirconolite, and that observation is further evidence of this phenomenon. In close
proximity to the PKA track, significant disruption of the crystalline lattice is seen,
with large numbers of atoms moving away from their reference crystal site as a result
of either physical collisions or from thermal effects due to an energetic shockwave
that propagates through the system. Directly around the PKA track, atoms are moved
the furthest and are least likely to return to their initial atomic positions as many travel
distances greater than the inter-atomic distance in zirconolite. In this case, atoms will
either find a suitable lattice site to occupy and form an antisite defect, or remain as an
interstitial ion. In Fig. 1a & b, one also sees propagation of damage far into the crystal
in a direction perpendicular to that of the initial PKA, as well as continuing in the
direction of the PKA. Qualitatively this can be described as ÔsplittingÕ of the damage
cascade by formation a secondary knock-on atom (SKA), forming sub-cascades that
can propagate a significant distance through the lattice.
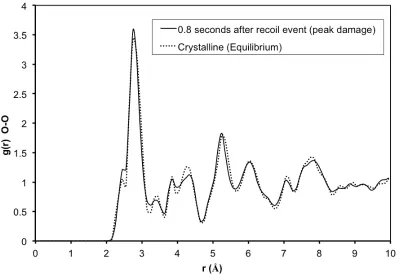
Changes in gross crystal structure are often analysed by means of the radial
distribution function, g(r). Figure 2 shows the O-O g(r) of the equilibrium crystal
(pre-damage) and 0.8 ps of elapsed time after the recoil event. The effect of a single
damage cascade on the overall atomic structure of the simulation cell is small due to
the small percentage of atoms in the entire system involved in the damage cascade.
There is evidence of a change in the short-range structure at values of r between 3.5
Figure 2: Partial (O-O) radial distribution functions for the crystalline (undamaged) UNZ and 0.8 ps after introduction of the recoil nucleus, the point at which the defect population was at its largest.
The simulated cascade and consequently damaged volume of zirconolite may
also be conveniently discussed in terms of a defect lattice structure. Three categories
of defect are thus analyzed: antisite defects, vacancies and interstitials. An antisite
defect is defined as an atom occupying an atomic site other than its initial lattice
position; an atom moving to occupy a stable interstitial site from its initial lattice
position creates a vacancy; and an interstitial defect is an atom not occupying any
defined lattice site. The number and type of such defects was monitored during
simulations relative to the initial energy-minimised structure. As the PKA begins to
interact with the system some atoms will either temporarily or permanently leave their
lattice sites and create defects. If the initial and final atomic positions x and y are
points in the usual space, R3, such that x = (a1, a2, a3) and y = (b1, b2, b3), and D(x, y)
is the usual Euclidean metric defined by
D x
(
,y)
=(
a1−b1)
2+
(
a2−b2)
2+
(
a3−b3)
2, (7)
C= x:D x,x
0
(
)
>δ{
}
(8)where x0 is a reference point (lattice site at time t = 0) and δ is an arbitrary
tolerance. Clearly C (t = 0) = ∅, since all atoms then reside on their lattice sites. At
times t > 0, the atoms may have moved a radial distance from their lattice sites which
exceeds the tolerance and hence their spatial positions are then members of the
cascade set. The members of this set will vary with time as the cascade develops and
the crystal heals. Atoms returning to their initial positions are removed from the set,
but atoms returning to a lattice site other than their original remain in the set, as they
remain displaced from their time zero position.
The absolute number of calculated defects is evidently a function of δ,
however, qualitative cascade behaviour was found to be insensitive to this tolerance
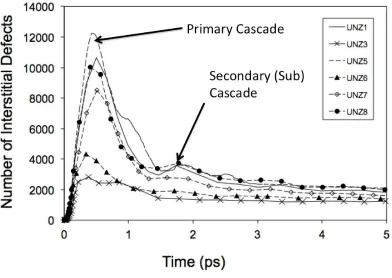
value. The time-dependant behaviour of the defect population during a cascade
highlights two distinct regimes for local damage production; a highly non-equilibrium
phase where the significant part of the energy from the PKA is elastically transferred
to the lattice, and a post-cascade phase in which relaxation of the structure occurs
without significant transfer of energy through the crystal. Multiple simulations of
single 34.7 keV cascades with varying initial recoil directions in UNZ showed wide
variations in behaviour, with defect populations peaking at times between 0.3 and 0.5
ps. The individual populations numbered between 2817 and 12253 with an average of
8489 and are plotted with respect to time in Figure 3, which highlights large
variations in behaviour depending on the position and direction of the initial recoil
Figure 3: Plot of the total number of displaced atoms in UNZ versus time elapsed since introduction of a 37.4 keV recoil event for 6 PKA atoms in randomised directions. The recoil nuclei all had initial energies of 37.4 keV.
In some cascade simulations, where later on in the cascade a very intense
collisional transfer of energy occurs between two zirconium ions (i.e. the heaviest
ions in the UNZ system), a sub-cascade occurs - revealed as a secondary peak in the
defect population at t ≈ 1.8 ps. There were only a few small sub-cascades seen in
UNZ, and with the heaviest possible SKA being a Zr ion Ð with only around 40% of
the mass of a U ion Ð their track and penetration through the crystal lattice was small.
After the highly non-equilibrium shock wave subsided (around 2 ps after the
introduction of the PKA), a large proportion of atoms meet the criterion D x
(
,x0)
<δ ,signalling an end to this portion of the damage cascade. The system then continues to
anneal, with a small amount of defect recombination occurring. After 25 ps, remnant
defects number between 1173 and 2660 for the set of UNZ simulations. On average,
there are 1621 remnant defects in UNZ, mostly Frenkel pairs VOi i +O I"
(
)
due todisplaced oxygen atoms. Despite very large variations in peak numbers of displaced
atoms, the spread of results reduces with simulation time, suggesting the effect of the
shockwave size is less than may initially be suggested by the peak numbers of defects.
displacing around 10000 atoms 0.8 • from their zero-time positions for a 12keV
PKA.
Gilbert and Harding [15] found that many antisite defects are energetically
unfavourable with respect to a perfect crystalline zirconolite lattice, suggesting that
some are highly unlikely to form under equilibrium conditions. However, we are
observing a re-arrangement of atoms under highly non-equilibrium conditions during
radiation damage, therefore the formation of all antisite permutations is possible
(permutations, as Ca
Ti
" is not the same as TiCai i).
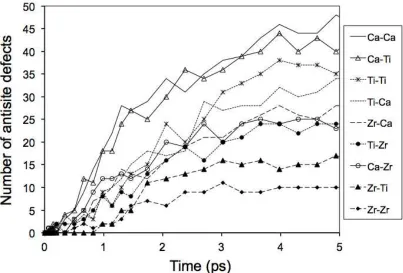
Fig. 4a shows the variation with time of the antisite defect population. An
increase in antisite numbers occurs up to t = 4 ps before plateauing around 2700
antisite defects. To further understand the changes taking place it is instructive to
consider the numbers of individual antisite defect permutations, plotted, for
simulation UNZ_1 as a function of time in Fig. 4b (cation-cation pairings) and Fig. 4c
(cation-O pairings). The graphs show that, with no more than 50 antisite defects for
any cation pair, and 283 CatCatantisites in total, this defect type accounts for only
11% of the defect population. Catcatantisites of varying charge states, while small in
number, follow the same qualitative behaviour as the total number of antisite defects.
It is likely that CatCat antisite defects remaining after the highly non-equilibrium
period of the cascade will remain stable for long periods of time (subject to a lack of
interaction with further alpha-recoil cascades) due to the energy needed to remove a
cation from its resident site, metastable or otherwise. CaCa antisites are most
numerous, while ZrZr antisites are rare. This is not surprising, given Veiller et al. used
a Buckingham/ZBL composite potential and MD to calculate the threshold
displacement energies (Ed) for ions in zirconolite and found Ca ions to have a value
half that of Zr ions, citing 25 and 48 eV respectively for the amount of energy needed
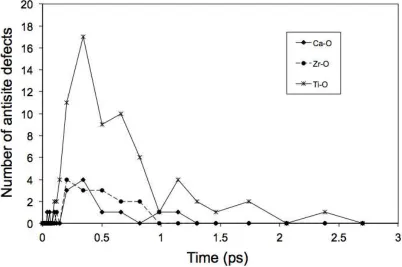
to displace each ion type from a lattice site. All CatOantisite defects are transient,
peaking between 0.2 and 0.7 picoseconds before vanishing altogether, with TiO
defects dominating briefly at short times, unsurprising given the high numbers of
oxygen atoms associated with [TiOx] polyhedral re-arrangement in the HTB layer [8].
Therefore OO! defects account for ~90% of all antisite defects seen. That these antisite
defects dominate overall is also to be expected on statistical grounds given that there
are many more oxygen atoms and hence oxygen sites for Frenkel pair recombination.
0 500 1000 1500 2000 2500 3000
0 1 2 3 4 5
N
u
mb
e
r
o
f
a
n
ti
si
te
d
e
fe
ct
s
Time (ps)
UNZ1
UNZ3
UNZ5
UNZ6
UNZ7
UNZ8
Figure 4a: Plot of total number of antisite defects versus elapsed time since introduction of a 37.4 keV recoil nucleus for 6 separate cascades in UNZ.
Figure 4b: Plot of CatCat antisite defects for UNZ as a function of elapsed time
[image:17.595.95.500.73.318.2] [image:17.595.100.503.377.650.2]Figure 4c: Plot of the average number of CatO antisite defects as a function of
time since the introduction of a 37.4 keV recoil nucleus.
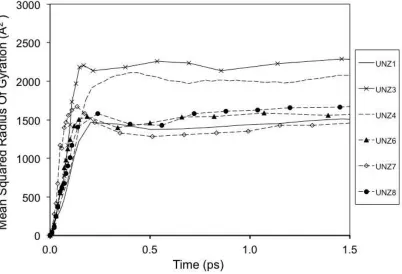
The geometry of the evolving damage cascade may be discussed in terms of
its radius of gyration and relative shape anisotropy, which can be represented with an
asphericity parameter, according to Dunn et al. [37]. Both of these quantities can be
obtained from the ÒinertiaÓ tensor, Θ, defined by
Θ= 1
N
xi−xc
(
)
(
xi−xc)
i N
∑
(9)where xi is the position vector of atom i in the cluster and xc is the geometric
centre of the cluster. For example the mean square radius of gyration may be obtained
from the trace of the diagonalized form of this tensor,
R2
g = λi
i=1 3
∑
(10)where the λÕs are the eigenvalues of Θ. The asphericity parameter [37] is
defined by,
A=
λi−λj
(
)
i<j 3
∑
22Rg4 (11)
and has a range [0, 1], representing spherically symmetric objects and elongated or
[image:18.595.97.499.80.347.2]Taking the mean squared radius of gyration first (Figure 5), we find that
cascades have values ranging between 1400 and 2200 •2, and the square root of this
value represents the size of cascade interaction volume; 37 Ð 47 •. This characteristic
size is much smaller than the length of the cascade (defined here as the longest
distance measurable in the region where atomic displacement > 0.8 •) which for all
simulations was > 100 •. The width of these regions using a similar criterion was 40 -
70 •, so the radius of gyration appears to be a reasonable estimate of the cross
[image:19.595.101.503.254.528.2]sectional diameter of a cascade.
Figure 5: Plot of the mean squared radius of gyration (defined by Eq. 10) versus time for the evolving UNZ damage cascades.
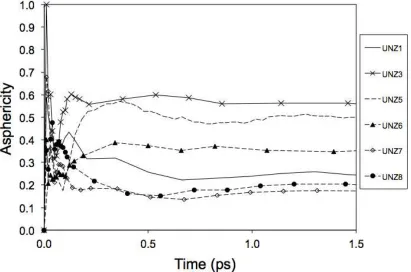
Asphericity values for clusters of atoms involved in cascades averaged 0.271,
suggesting egg-shaped cascades. However, asphericity values ranged from 0.040 to
0.608, as seen in Figure 6, so it is misleading to consider this result due to the large
spread of values. This quantitavely confirms the visual observation of large variations
Figure 6: Plot of asphericity parameter (defined by Eq. 11) versus time for the evolving UNZ damage cascades.
3.1.2 Analysis of Cascades Ð Doped materials.
The first step for comparison of cascades in UNZ, ZRZ & CAZ is visualisation, and
significant differences are seen in all cases. In ZRZ, up to 10 sub-cascades were
observed in a single simulation Ð a substantial increase from the UNZ simulations.
Each sub-cascade was small in volume, but due to their larger numbers the overall
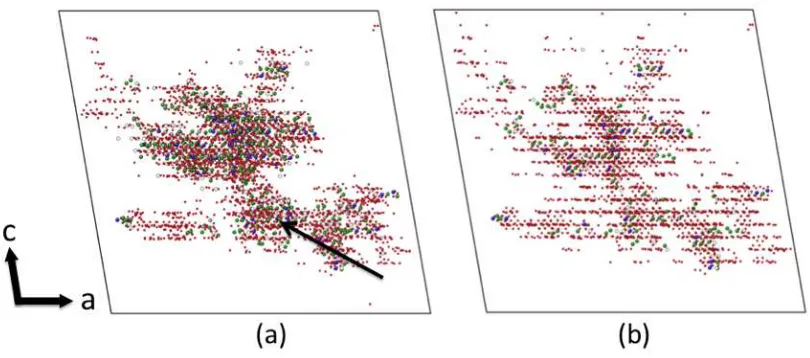
damage region extended much further into the simulation cell, as shown in Figure 7.
The large range of the sub-cascades allow the effects of radiation damage to spread
much further through the material even though the number of atoms involved may not
Figure 7: ZRZ simulation snapshots (from ZRZ2), showing (a) maximum and (b) residual damage, at 0.4 and 1.5 ps respectively, viewed along the b unit cell direction. The initial direction of the 37.4 keV PKA is arrowed.
In CAZ simulations, sub-cascades numbered similar amounts to the UNZ
simulations but were much larger in volume than any seen in either ZRZ or UNZ
systems. Examples of this behaviour are shown in Figure 8, where it can be seen that
in CAZ simulations the sub-cascades involve large numbers of atoms and also a larger
volume of affected crystal. In order to quantify these visual differences, one can once
again turn to monitoring defect populations. Initially, formation of defects and
displacement of atoms occurred at the same rate for all three systems in this work.
In ZRZ material the average peak time of the thermal shockwave is almost
identical to that in UNZ simulations at 0.43 ps, with times ranging between 0.30 and
0.51 ps. Peak defect numbers however were spread over a smaller range, shown in
Figure 9. For ZRZ, vacancy numbers lie between 4398 and 10725 with an average of
6454, thus there are around 25% fewer vacancies formed than in the UNZ material.
By the time the thermal shock has subsided, the remaining vacancies are similar in
Figure 8: Typical CAZ simulation snapshots (from CAZ6), showing (a,c) maximum and (b,d) residual damage at 0.4 and 1.5 ps respectively, viewed along the b (Fig a & b) and a (Fig c & d) unit cell directions. The initial direction of the 37.4 keV PKA is arrowed.
UNZ$
$
ZRZ$
$
CAZ$
[image:22.595.103.483.455.692.2]The peak atomic displacement seen in simulations with Pu doped on to the Ca
sites occurred later, and was much greater in magnitude than in UNZ simulations;
between 0.35 and 0.94 ps, with an average time of 0.65 ps. The length of the cascade
was longer with significant changes in defect numbers seen through until 3.5 ps, with
multiple and sizeable sub-cascades also observed in this time, as the possibility of a
Pu SKA means that much heavier ions are involved in collisions throughout the
cascade. Most notably this was seen in the CAZ systems, leading, in two simulations,
to large secondary peaks in the number of vacancies formed, and very large volumes
of crystal being affected by the radiation damage event.
The antisite defect population over time is plotted for the three materials in
Figure 10. Doping Pu onto the Zr or Ca sites appears to affect the material in different
ways, with less disruption to the CAZ lattice. This is contrary to what would be
expected as for CAZ systems, given the much larger number of atomic displacements
seen and the larger region of crystal affected by the radiation damage cascades, one
would expect antisites to be more numerous. This suggests either a disinclination for
interstitial cations to recombine with nearest atom sites, preferring to remain as
interstitial ions in the system, or a strong tendency, for instance, for Ca atoms to
return to Ca sites. Transient numbers of antisite defects in the systems were
comparable in all three systems, and there were an average 52.0 and 37.7 remnant
CatCatdefects in ZRZ and CAZ respectively, compared with 63.1 for UNZ
simulations. Both sets of simulations therefore were subjected to less residual cation
Figure 10: Plot of average antisite defects as a function of time since introduction of the recoil event. The recoil nucleus had an initial energy of 37.4 keV
There are similar variations and spread in the asphericity of ZRZ and CAZ
cascades when compared to UZ. Values averaged 0.274 and 0.326 for ZRZ and CAZ
simulations respectively (compared with 0.271 for UZ) and suggest that cascade
shapes are similar in all materials, with CAZ cascades potentially being slightly more
elongated. However, visualizations such as figures 7 and 8 show that this is not
necessarily the case, and very little correlation is seen in cascade shape. The authors
would hesitate to make any prediction on cascade shape trends from these
distributions.
Radius of gyration values are similarly unchanged for ZRZ and CAZ cascades,
suggesting that despite the large variations in atoms involved in cascades, the actual
volumes of affected crystal are similar, and that the damage in CAZ is more densely
[image:24.595.99.495.76.347.2]4.1
Conclusions
The work presented here has greatly extended the analysis (both qualitative and
quantitative) of radiation damage simulation in ceramics beyond what currently exists
in the open literature. In pure un-doped zirconolite, significant differences have been
shown to exist in cascade behaviour depending on initial starting recoil direction. This
would suggest that statistical confidence in damage cascade results must be improved
through performing as many simulations as is reasonable, since every one is likely to
be different. In this work we performed at least 6 cascades in each material, similar in
all but their initial recoil direction, and the authorsÕ preference in future work would
be increase this further, as results here suggest that consideration of the initial
direction of the recoil atom is vital to descriptive results of damage behavior in
materials. There has been a tendency for previous authors to maximize the distance
available for cascade propagation by giving the recoil atom an initial [111] direction.
With this being such a defined crystallographic direction in many materials, we would
suggest that this choice would minimize the variation in results obtained, and
therefore conclusions that can be drawn, to a small percentage of what would ideally
be possible.
The simulations of alpha-recoil cascades in doped material are to our
knowledge the first of their kind, and highlight the behavioural differences between
doped and un-doped material. The results suggest damage behaviour is significantly
altered by the presence of heavy dopant ions such as Pu, and their availability as
secondary knock-on atoms means the number of sub-cascades is larger and cascade
size increases. The consequences of this are far reaching Ð ion bombardment
experiments to assess radiation damage accumulation in pure materials may
underestimate the extent of damage and the physical and mechanical effects on the
material may be more serious than first thought.
In terms of the techniques used for analysis of radiation damage in molecular
simulation, use of a reference cell method has its limitations. It will significantly
over-estimate the size of the observed damage region since during the highly
non-equilibrium conditions seen at the peak of the cascade, the thermal shockwave allows
measures. This crystal distortion is part of the process and quite common in thermally
activated situations. However, using the reference cell technique shows our results to
be coherent with those of Veiller et al. Detailed analysis of defect types, specifically
antisite defects has shown that the more mobile Ca ions are more likely to end up
residing as antisite defects, and this may well be reflected in the large discrepancies
between antisite numbers UNZ/ZRZ and CAZ simulations. Other analysis methods
used here include asphericity and radius of gyration, which provide extra information
suitable for cascade description. Both of these methods proved to be rather insensitive
to some physical properties of cascades Ð representing the overall extent of cascades
rather well, but not highlighting the discrepancies in sub-cascade behaviour, defect
density or features seen along the central track of a cascade.
Acknowledgements
The authors would like to thank EPSRC for funding (Project EP/H013814/1) and the
National Nuclear Laboratory (Formerly Nexia Solutions) for an industrial CASE
award to Henry Foxhall. We would also like to thank Professor Robin Grimes and Dr
Mark Levy for help in constructing the potential for zirconolite, and Drs. Kostya
[25] R.A. Buckingham, Proceedings of the Royal Society A, Mathematical, Physical and Engineering Sciences, 168 (1938) 264‐283.
[26] J.F. Ziegler, J.P. Biersack, U. Littmark, The Stopping and Range of Ions in Solids, Pergamon, New York, 1985.
[27] L. Minervini, R.W. Grimes, Journal of Physics and Chemistry of Solids, 60 (1999) 235‐245.
[28] R. Devanathan, L.R. Corrales, W.J. Weber, A. Chartier, C. Meis, Physical Review B, 69 (2004).
[29] W.H. Press, W.T. Vellerling, S.A. Teukolsky, B.P. Flannery, Recipes in Fortran. The art of scientific computing., Cambridge University Press, Cambridge, 1992. [30] U. Essmann, L. Perera, M.L. Berkowitz, T. Darden, H. Lee, L.G. Pedersen, Journal of Chemical Physics, 103 (1995) 8577‐8593.
[31] I.T. Todorov, W. Smith, Philosophical Transactions of the Royal Society of London Series a‐Mathematical Physical and Engineering Sciences, 362 (2004) 1835‐1852.
[32] H.J. Rossell, Nature, 283 (1980) 282‐283.
[33] J.D. Gale, Journal of the Chemical Society‐Faraday Transactions, 93 (1997) 629‐637.
[34] F.X. Zhang, J. Lian, U. Becker, R.C. Ewing, J. Hu, S.K. Saxena, Physical Review B, 76 (2007).
[35] H. Ozkan, L. Cartz, J.C. Jamieson, Journal of Applied Physics, 45 (1974) 556‐ 562.
[36] I. Todorov, W. Smith, The DL_POLY_3 user manual, in, STFC Daresbury Laboratory, 2007, pp. 104‐106.
![Table 1: Buckingham potential parameters for atomic pairs in zirconolite [Minervini, 1999]](https://thumb-us.123doks.com/thumbv2/123dok_us/7933530.194209/7.595.85.397.282.454/table-buckingham-potential-parameters-atomic-pairs-zirconolite-minervini.webp)