(, f F E, o(L UJ O z (r u-:l.lJ (9 UJ 6 !u
)
I
(9 UJ o 3 bE .i:
-t
vrO
-a-lf, E TJG .Le
f6
5lt E-o.oo
+,OF ?--rl P.g €6 E.g
Egfr
e
'
oE gT'
troc
:
tr o=
J?6>
o=
isE
.pO'-oE
5eP
trctr
Pss
Eo
9 o ctFo
o'E
*
o .Ivox
-g,bt
,5€9
e;
6(o 'EE 'Eo Ea a s? -oi5
;
En
xE:
-5
EE
5Ei+g$
s";s$
5'62:8
Ed:8
-P
\:-;:
=:;:
.= F\-C O O O tJ O O
(oa
5ts
!, F^
i
.oB1 or\ ct
^^ o 6I
ED Or^
? Fv-.= O
^F -@
.'q
g 6-
EB; u, 61 U'a-r
E
&
ries
E R e.gE oo
d ,n?'E':
= x
-rvgxlO
#
65596P
o z () *. o F L o rrF ? :r\
E
=
88f Z Nu)
E - rro)
E E
61A \J.' 'O
d ,i .@
c \"F
ts-s o >R FB
Ao '=N
d't H I -o-5
b:'5S.;
wct Nu)>F 9 E. LU t-L o a LU F F @ o UJ h z f c lrJ N N @ LU a @ 5 a N llJ = -(J a E EE'0
+J6O38o
-af of
?E'FB
d.8*
O.95Qe ED Qo<
\ *_- LOII) C Sf OO
b.U
Ppo:
gE-eB
E
Efifir
i
Ei>ss
E o- g;= d i v-^o)
#
?,5E0
F:
F€5:
==;ip
eiriPF
o o (, z 2 o LUt
z l -9E 6e'# g ;
*F
* u b o iri r\
6 J F 6@
E:
coe#?
?$AI
HqSp
pEg
E6.
; li-oor x E b Eoo>
:-.3=e €
uEoo
bi,_{5r..
5?S:p$;
E
f
s3
€Eajp
ESJ$jPP
J.
3 3 9Ro G C.O-'co
*,,H 6ts1
.: \r(9-N F
3--I
=lbF.l!€ -c.r6(J J (QeF()
D
I
UJ 1 .9 o .g o o E rF L E o -cl L o o96
3,'=(oro
J\-tr 6 ?F-O c q)-,= 'Eo G B
6 .oFoo
i
o_E-ohr-3 eN<6
;
b3-x
E is€eYs:8;.;
O(J(LNF o z E LU o UJ z+E
R€g , s
ce.; {
E$FF'
*g
3
i
@=-i;
.95 3
:iE
sl;ilT
tgr-
3eEE:ilFE
Efl{€:P$
s*:iF$[;
g:{3sf
(, E. :) o o LU X f UJ o .lll
-() f o I o z E. (969S
sH
: gel :
g.i=
P*&-qr
'F.--3o.,'6 Es,E;
0;5H
5
e,-x
q e E8 :5 "eBI
.FEHt;dn
n
H€=P
I
FF*
.'d.,ri
E5+:b:s
s
Ee3s
E;|;
E:!B
s
;
H;"*r
€ g;;;
5i;.
€ .ecoF J>..,roFdU 65>RP f f8* J)-F
G
o .E=
^
t,F€
oo i;5
tvv-,-p, o I ')N'\LU
rrr o : o)Ncv)i
e
E8
5
Esssd
-s
ES
E
E;;35
:gX>+
Fr-E+++i-=
"^
;
-==
3Y
E:=
+.= o,oo
==8;
+ fi 6@- E 9@- x;ET.,:ETa
#@ FUJF Z ()UJF F tl (L a LU
I
Eo I F 6',
o 6 q -c.
;y
q=Eg*o
3P R il ; F 6ql =
H:sqF-
Ei'ri-:B
f
H;€Ns
;
n
eitRK
p
E*",-ll
s*
g=€R;
;
F=EIi
P;oefrll
si
E<.:eg
'A S#:f
eel-[J O LU LU E (9 lf) B CDN oo to@ g.ooi@ aoNzoooz I ^.@ N i:o '6,.X,^,-^ oo U
H
i:s.rtr
Ero (') i )Z N -c (rt ON
f
s*se
EF Bn5 s 8Ea Ezao
O OO-lJ)Fu-{FN o z (J a
)
LU o E. m b c .9ro :vo)j .R-
\vrt-ll rt o) 6-^\J -'-L 6 !!,
.i o 6=to.l
lr !,, f1 e
uJ o'i6 0
N PJ=E
= 9oe-9 .c !r I 3i:F<-?
\Z E. z
o
E,$ N
sfiE
I
$
EEh- H
-e,nHfrsI
gg
€3
€
== x F
gE
sr
m A 5d) d : \-=-ar-F*s
H;E€is
cD o3r=
;
E6E$P
a
P$;Esl
i
at;g
s=!
.t :9RE
f
;d
j
e;
5;I#
36 s fr:;
t
tsE
.-= €oroi A '6*=o e;-o
s
gFFg
Ei;
#P
H JsE=
t
o o E o o g o o o? o {r, G oo = aXE;E
gg+-,5 o) X;E
.oE 8= 6 rrr' - o to q c E oD -,n >-3c o E g
F*3
3 EE!:3
;
l gz€ -o 6'
E€-6d=de
bEa=de
o z LU (r o g o J. G .9 lr = Cto og o: Eb
O .Ct
P*
EV to
-Ff 'F
llo o)
5.8
g:
cE = 6co E E g .9.-oo5
€
8.er-€ Ei
Ere
gs lE 3u= E E a oDa;
OE -t Nr\F
3
3
EEci I 9e
E ,t
3$E
3
Y 6;
3
.o=; F ;€
:
€ ;E
E
Ei
E
*;uF
$ i
$tHE
;
€5
E =E
ggEe
E He
=:Eg
E
st*;:E€:€
Eg5Ii[:]it
lgEEtitnE
sA€::i=t5
EcBiEi:EE
€:EE;i9gf
IE:g$tgH;
EEg'EE"Ps!siipgfr
g!; gir
aii;
;EEiE'3H;!
,E
gr
s g E $ F €.t.E 6.H E ',"Y 3 A
€;
plEieg.g
s.-aE;!s"fi;=a
p**1E:[Eg
s*5€E€se€
: t i b o
EEPI\4oDo=Lou',
n : 5# gs: F * e
E€ 3
E5
€€;
psg
g€*
; s g* ei;
iEbirnE
I
g;EgaIiiIEHi!
; E =i
I Gji
E
E I - E ; i s; x
F
a
E !i,**gtt
E
-gEE o)5 P*e
iF,fiHE;fi
fiie
g€
is
:
.e
:'SSFEFE
;*iB
ili;
E
fi
g:s
HEE$:
rXEtr) o
gE:st
?l is: €
=osHeIE6
::;E
gE
EEi
IUEEI
F5FtF
;EEEffE;e
€E;
;Eii-fr3gIfrEE
HEF
H,I
FgE
!t;
i,:E
sut
e
i
A
t *
:
[E
g
s
n
Ert
i[E
;lt,fii{
lg=
u,
€
=
c;ss,Eg'Ett
uqi
st€rc
i
3i
;
T*F
l-E
nlg;
-E
:s€
Egg
EFE
aEs
srE
iHi
;g!
;nsF,gI;€;**igEggi;gigig;Ig
P-F;
sE
EqF
Ei;
Ei* i]iE
FiE sns
ne :Eao.=€;ii
!:x;;EHi;,;fiFEg€.iF€
f
Hjf
EE;
;:I
iBE
:Efi
fgi
Ii
:*Eg ff1
.ktq'<-l 6F
i:eEob'*eqs
arE
iFe'=r*i
EiAli
E,f;,gfi
;;{EE;:€i
sa*
e;e;
FE .o !g
i€aEi;ilE*EEEEfiEEfi{Eg:Eggtii
;iE-
'Es
gsE€
iFg"
:EEi
lie
:i-E
lgel$f
EEg
aEg
eggE
r[Ee
ii
I
ftE
l.aE
gEE
gai
.-rts t4 ea v
-
j= la$i
?E
iq
EEg
if
{
eEs
EEE
igH
€:8
EE;3E
E=.-a;S;;
;:=:
P=€
7;i
dEg
*E*
?5E-sHr
;jE
sH€E
;E:p
Ead
,€F
;€p
s€E
{E,F:
m J ;eI
rta
te
?LxH
,g
Ug-
;
i-?-Z ur= uro- r
*or'gtrz
urn
Rg
v34+=u
=E
dY-F?EFg;
iR
n-68==sHun
is
l
i;728:c3
s*
=fl59tr?ia=
x r=
av)7x==:3
e E
ocn'Sqy5dffie
FE-ffibg5>Foo
,!
CNooE.
Ji^a:!8iHa
Ht
?
-rr,l
IHi;f
I!
AqEixq8.,e
tEE;aHFlaHf
3336si6Etsn
!s
h$il;i3a5x
F sz 5 e b e u
i
#:
grr
ELECTRICITY
PRICES
Cataloguing data can be found at the end of this publication
Manuscript completed in July 1986
For all information concerning this publication. contact :
F. Desgardes
-
Tel. Luxembourg 43011, ext. 3102Luxembourg : Office for Official Publications of the European Communities. 1986
rsBN 92-825-6549-1
Catalogue number : CA-46-86-686-EN-C
O ECSC
-
EEC-
EAEC, Bruxelles' Luxembourg, 1986Reproduction is authorized, except for commercial purposes, provided the source is acknowledged'
II.
Conditions and methods.1.
Scope andLocations-2.
Standard consumers3.
Definition
of
the
price
tevets
recorded
...r..
4. Tariff voLtage...,
..,..
III.
Units
of
va[ue1.
The European currencyunit
(ECU)2.
The Purchasing power standard (pps)3.
Prices
in
|tcurrentrr PPS and rrconstantrr pps4.
Prices
series...r.
IV.
Taxat i on1.
Generatindirect
tax2.
Specific
taxesV.
ELectricity prices
in
the
various countries..
I.
Introduction..
1.
FRof
Germany.2.
France3. Itaty...
4.
Netherlands5.
BeLgium....6.
Luxembourg.7.
UnitedKingdom...
8.
IreLand.9.
Denmark10.
Greece....11.
Spain CONTENTS12.
Portuga LVI.
Community comparison and concLusiorlS...VII.
StatisticaL
annex.Tab Les
Househotd and
industriaL prices
by
country...
Conversion
factors
for
PpS, ECU and GDp7 7 8
11
12 15 15
16 16 17
19 19
2A
25
26
31
39 46
52 58
61
65
69
74 77 85
93
I
III
prices
indices
xxXV-f
0
a
%
DM
pfF
F
centLi
t
H
FL
centBFR LFR
UKf
pIRf
pDKR
dreDR
PTA
ESC
PPS
ECU
NiL
Data Less
than
haLf
the
unit
usedNo
data
avai LabLe Per centGerman mark, Pfenning
=
1l1OO DM F rench f ra ACt
Cent i meItaLian
Lira
Dutch gui
Lder,
centBe Lgi an f ranc Luxembourg f ranc
Pound
sterLiAgt
penny=
1l1OO UKfIrish
pound, penny=
1l1OO IRfDanish crown,
dre
=
1l1OO IRfG reek d rachma Peset a
Es cudo
Purchasi ng power standard European currency uni
t
V
VoLtkV
Ki LovoLt
(=
1
000 V)kVA
Ki Lovo L t ampe rekt,J
Ki towatth
HourktJh
KiLowatthour
.Gwh
Gigawatthour (1Oo kwh)n
NumberEUR
12
TotaLof
the
membercountries
of
theEuropean Communities
I I
INTRODUCTIONThe
present
pubLication
is a
comptete
updating
of the
studyrrEtectrjcity prices
1980-1985rr pubtishedby
Eurostatin
1985.It
contai nsthe
mostrecent
pri ces,series
going backto
1980.vaLid
in
1986together
with a
timeThe
text
describesaLt
recent
changesin tariffs,
taxation,
suppty andconditions
of
saLe LiabLeto affect
consumerprice
levets.
The scope
of
the
study
has been widenedto
inctude
Spain and Portugalwith
as
compLetea
description
as
possibLeof
the
structure
of
theeLectricity
industry,
tariffs
andtaxes
jn
thesetuo
neu Member States.The
definitions
and methods remainthe
sameas
those
usedin
previousstudies,
so
that
the
formation
and deveLopmentof electricity
pricescan
be
observedover
a very
Longtirne
series. In addition,
thedefinitions are
harmonizedwith
those
of
the
Internationat
Union ofProducers and
Distributors
of
EtectricaI
Energy (Unipede).For
reasonsof
economythis
pubtjcation
is
onty
avaiLabLein
tlro tanguages:
EngLish and French.The survey on which
the
study
is
based was conducted bythe
StatisticaL
Office
of
the
European communities and woutdnot
have been possib[ewithout
the
cooperationof
the
etectricity
companies and professionatII.
CONDITIONS AND }IETHODSSCOPE AND LOCATIONS
The present
study
aimsto
showthe
actuaLprice
of electricity
paid
bythe
consumerin
the
membercountries
of
the
European Community.The
prices are
recordedat
the
beginningof
eachyear
basedon
thetariffs,
contracts,
conditions
andru[es
in
force
at
that
time.It is
concernedwith the
actuaLprice
paid
bythe
electricity
consumer,corresponding
to
the
invoiced detivery
price
to
the
consumerat
thebeginning
of
eachyear
incLudingany
eventuaIrebates
and subsidies. Our consumersare
defined
as
those
who purchaseelectricity for
their
own
use
and
excLudethose uho
offer it for
resaLe,
b'fe have not consideredthe
buLkprice
paid
bythe
etectricity
distributors.
As
regards
consumers,
the
study considers
att
types
of
customerssuppLied through
the
pubLicdistribution
networkwith
Low,
medium andhigh-vo[tage
eLectricity.
In
the interests
of
simptified
presentation,consumers
are
subdivided
into
two
groups,
one
for
domestic and theother for industriat users.
The survey does
not
cover
certainindustriaL
consumers:(i
)who
t hemse Lvesrequi rement;
produce
part
oftheir eLectricaL
energy(ii)
vho
purchaseeLectricity
under speciaLcontract
terms becauseof
their
exceptionaIty
high
poL,er requirements
and
consumptiondemand.
These
exceptions
are
mainty
steelmaking
and
chemicaL enterprises,enterprises
engagedin
the
productionof
aluminium andother
metals byetectroLysis,
rai Lways,etc.
Most
of
theseenterprises
consumeover
10mittion
kl'lhannua[[y.
Theyare
fewin
number,
but
nevertheLess consume an apprgciabtepart
of
thetotaL
etectricat
energy suppLied.rn
order
to
refLect as
accurateLyas
possibte
the
reaI
position
ofconsumers,
it
seemed advisabLeto
recordprices
at
setectedlocations,
i.e. touns,
conurbationsor
distribution
networks, rather
than
give averageprices
per
country.The choice
of
tocation
is
decided
by
severaL
criteria,
name[y,population,
economicimportance,
different
tariff districts,
evengeographicat coverage
of
a
country,
harmonizationwith the
locations usedin statistics
retating
to
the prices
of
other
sourcesof
energy,F rance
Ita Ly
NetherLands
BeLgium
Luxembou rg
Uni
ted
Ki ngdom IretandDenma r k
G reece
Spain
Po rt uga L
Stuttgart,
Munich, Western Lone, Southern Zone.LiLLe,
Paris,
MarseiLLe, Lyon, TouLouS€r Strasbourg.Northern and
centraL
ItaLy,
southernItaLy
and thei s tands .
Rotterdam
(GEB),
North HoL Land (PEN), North Brabant(PNEM).
The country as
a
whoLe (standard nationaLtari
ff).
G rand Duchy ( Cegede L ) .
London, G tasgohr, Leeds, Bi rmi ngham.
Dubtin.
Copenhagen
(KB),
North Lealand (NESA).Athens (standard nationaL
tari
ff)
.luladrid (standard nationaL
tari
ff)
.Li sbon.
Certain
towns seLectedare
representative
of
Largerregions
rlhich is
indicated
in
the
chapter concerning each country.2.
STANDARD CONSUIqERSThe
survey
is
basedon
the
systemof
standardconsumers,
i.e.
theprices
are
recordedfor
certain
tevets
of
eLectricity
consumption andunder
certain
conditions
of
suppty,
chosen asbeing
representative ofthe
population
of electricity
consumers.
Thesestandard
teve[s
of
consumption remain
fixed fron
oneyear
to
the
next
and
for
aLL thecountries,
this
being oneof
the
primary
conditions
for
spatiaI
andtemporaL comparabiLity
of
prices.
Two
famiIies
of
standard
consumersare
taken
:
domesticuses
andF i ve domest i
c
standard
consumers
( supp Ly athave been
taken:
Low voLtage) codedD.
to D.St anda rd
con sume r
Annua L consumpt i on k[,'|h
Tota L
(of
wh i ch ni ght )App rox .
subscribed
demand i
n
kl,lStandard dweLLing
D
a Du
D
c Do
D
e
600
1
2003
5007
50020 000
(
1
300)(2
500)(15 000)
3
-
44 o 9
6
-
95om2 2 7on2 3
9on? 4
1 oomz 4
1?on2 5
rooms+ki tchen
rooms+k i t chen
rooms+kitchen rooms+kitchen rooms+kitchen
As
a
guideline these
standard consumers maybe
expectedto
possess thefottowing
househo[dfaciIities
and appLiances :Lighting, fe{io, teLevision, refrigerator,
smatI etectric
apptiances;
\ ''
DU
asfor
D"plus
washing machineor
dishwasher;D.
Dd;:"[:irDO
with
vashing machine and dishwasherptus storase
Hatere
Seven
toI
grralL-eLectricrt
systemwith
water heater and
eLectric
centrat heating operating on
a
storage basis.industriaI
standard consumers(for
voLtage seepoint
e
coded rhave been
taken
:
aSt anda rd
con sume r
AnnuaL consumption
kwh
Max i mum demand
in
kt.lAnnua
L
Loadfactor
hI
I;
i:
i;
I
30 000
s0 000
1 60 000
1
250 0002
000 0001
0
000 000?4 000 000
30 50 100
500 s00
2
5004
0001
0001
0001
600?
s004
0004
0006
000(1) F
E'. g. vacuum c
Leaner,
e Lectri
c= 0.9.
reguLarity
of
consumerofftake
of
eLectricity
from
the
grid
during
theyear.
The
Longerthis
time
the
more eventhe pattern
of
consumptionduring
the 8
760 hoursof
the year.
It
indicates the
numberof
hours inwhich
the
consumer wouLdreach
his
annuaL consumtionLeveI
if
thedemand LeveL lrere permanentty equat
to
maximum demand.AdditionaL
detaiLs
are
sometimes neededbefore
the tariffs
can
beappIied
:(i)
In
the
caseof tariffs
basedon
haLf hourLy maximum demand, themaximum demand
of the
standard
consumeris
muLtipLied
by
acoefficient
of
0.98.(ii)
(iii)
In
the
caseof tariffs
basedon
a
maximum demand expressed inkVA
an
adjustmentis
madeby dividing
the
standard consumerrsmaximum demand
in
kW bythe
coefficient
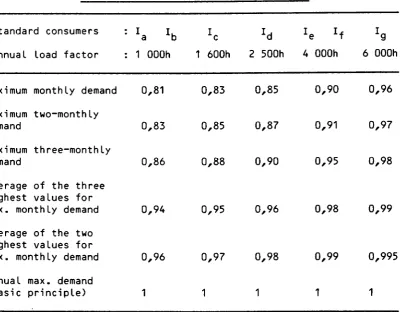
cosY= 0.90.In
the
caseof tariffs
basedon
maximum demand readings morefrequent than
oncea
year the
standing
chargeis
muLtipLied bythe
foLLowingcoefficients
:TabLe
of
powercorrection
coeffi cients St andard
consume rsAnnua
L
Loadfactor
=
I.
rbz
1
000hI,
1
600hrd
2
500hI.
rf
4
000hIg
6
000hMax i mum mont h Ly demand
Max i mum two-mont h Ly dema nd
Maximum three-monthLy
demand
Ave rage
of
t he t h ree h i ghest va Lues f ormax
.
mont h Ly demandAverage
of
the
twoh i ghest va Lues f or
max
.
mont h Ly demand Annua L max. demand(basic
principLe)O r94 O r95 A 196 A r98 O r99
0r 81
0r83
0 186
0 196
1
0r 83
0r 85
0r 88
0 r97
1
0r 85
O r87
A r9O
A r98
1
0r 90
O r91 O r95
A r99
1
A 196
O r97
O r98
0 1995
1
A ha rmon i zed tab Le
been compi Led i n
vary
according toni ght ) .
for
consumptionduring
ttoff-peakrrperiods
has atsoorder
to
be
abLe
to
ca Lcu Late prices
whentari
ffs
[image:12.581.102.503.359.671.2]Annua L St anda
rd
Loadconsumer
factor
consumpt i Annua L onAnnual consumption
(in
1
000 kWh)charEed
at
off-peak rates
accordi ngto
the
average dai Lyduration
ofoff-peak
peri ode1
000 kwh7h
8h
th
10 h 11 h 12h000 000 600 500 000 000 000
30
50
160
1
250?
00010 000
24 000
0 0
11
197
438
2
1907
1400 0 13
225 s00
?
5008
1600 0
16
262 580
2
900
39
120 100 0
19
300 660
300
3080 11
00
00
22
25338
375740
820700
4
100040 12 000
rf off
peakrates are
chargedduring
other
periods,
for
exampte aLLday
Sundayrle
have onLytaken one haLf
as
suppLementaryoff
peakhours-
such casesare
mentioned asthey
occurin
our
study.Account has
not
been takenof
changesin tariff
parametersduring
the courseof
a
year.
In
other
words no weightedprice
is
catcuLatedfor
ayear.
3.
DEFINITION OF THE PRICE LEVELS RECORDEDAIt
prices
are
shownper
unit of eLectricity soLd, that is
perkiLowatt
houn(ktlh).
TheresuLts represent
the
unit
price
actuaLtypaid
at
the
beginningof
eachyear
andtake
accountof
the
reLevanttariff,
parameter,
index,
etc.
appticabLe as from1
January.rn
thecase
of
tariffs
or
contracts
with short
termindices (month,
quarter)it is
the
index
whichis in
force
during
Januarywhich
is
apptied.This
meansthat
any
changesin
the
tariff
structure during
th.
y"".
are
not
takeninto
account,
i.e
noprice
weightingis
appLledto
theyear-
Theprices
inctude
meterrentat,
the
standing
charge and thecommodity
rate.
They donot
incLudethe
initiat
instaftation
charge tothe
consumer.rf
there are
severat possibtetariffs, it is
the
tariff
whichis
mostadvantageous
to
the
consumerthat is
taken
into
account,
after
theeLimination
of
the
tariffs
which
are
not
usedin
practice
or
whichappLy onLy
to
a
marginator
negLigibLe numberof
users.when
there are
onty
quasi-tariffs,
speciaL
contractse
o?
freeLynegotiated
for
prices, the
most commonty foundprice
(most representative)the
given
suppLyconditions
his
beenrecorded.
rn
the
case offreeLy
negotiatedprices
or
contracts, the returns
reLate respectiveLyto the
biLLs
paid
during
the
monthof
Januaryor to the
pricesresuLting
fromthe
contracts
in
force during
that
month.
such casesAccount has been taken
of
speciaI
tariff
or
supplementary arrangementswhich may
exist
for
reactive
pobrer.Three
price
Levetsare
shown :(i)
the price net
of
tax;
(ii)
the price
excluding VATbut including
att
other
taxesi(iii)
the
se[[ing
price
(incLusive
of atI
taxes).The
price
exctuding
tax is
obtained
directty
from
the tariffs
orcont ract s .
The
price
excLuding VATincludes,
where payabLe,other specific
taxesvhich
is
interesting
in
cases vhere VATis
deductibte.The
price
incLusiveof
aLI taxes
correspondsto
the
sumpaid by
theconsumer.
trTaxesrr
is
used hereto
meanfiscat
andpara-fiscat
[evies
applyingdirectty
to
eLectricity
at
the
stageof
sale
at
the
consumer. Thesetaxes
maybe
levied
at
the
nationa[,
regionaL, locaI
or
municipat[eve[, etc. by the State,
regionat
or tocat
administrations,
professionaI associations, etc.
0n the other hand, the taxes
Levied
before
the sate of
theetectricity,
such as taxes on companies,profits,
wages,etc.,
xhichare
obviousLypart
of
the
production
or
distribution
costs,
are
notcaLcuIated
separatety.
They remainan integrat
part of the
price exctudingtax.
The resuLts
for
each
country
arecurrent
prices, i.e. at
face
vaLue.shown
in
nationaL currencies
at Forthe
purposesof
internationat
comparison,
it
Has necessaryto
usea
representative common monetaryunit
whichvould
create
a
minimum ofdistortion
in
both space andtime.
AccordingLy,the
present study usesthe
purchasing pouer standard(PPS).
The comparativetabtes
are
aLsoshown
in
European currencyunits
(ECU).These
units
of
vatueare
expLainedin
the
foLtowing chapter.4.
TARIFF VOLTAGEThe
voltage
at
trhich
etectricity is
supptied
to
the
consumeris
anelemenr which may
affect
the
industria[ price
leveLs.
Thehigher
thevoltage,
the
tover
the
price.
But
in this
case,
the
consumer has tobear
the
expenseof
the
e[ectricity
transformer
(the
investment costor
the renta[).
In
practice
the
suppty
voLtagesvary
accordingto
the
grid
and thetariffs.
Accordingto
our
generaLdefinitions,
the
vo[tage takeninto
account
is
the
one
at
vhich
etectricity is
commonLy suppLiedto
thetr'fhere
severaI
supplyvottages
coexist
for
the
same categoryof
usersit is the
mostrepresentative (greatest
numberof
users)
rhich
is
consi dered.
The
tabLe
betowgives
the tariff
voltages
according
to
uhich
theprices
for
the
industriaI
standard consumers have been catcutated.Vottage appt'ied
to
industriat
standard consumersKV
Standard consumers rb
r.
rdr.
rf
tgFR
of
Germany-
sud Gebi et-
Hambu?gt
Hannover,Diisse tdorf
,
Frankfurt
-
West Gebi etStuttga ?t
t
MiinchenF rance
Ita ty
NetherLands
-
GEB-
PEN-
PNEMBeLgium
Luxembou rg
Uni
ted
Ki ngdomI re Land
Denma r k
G reec e
Spain Portuga I
r-
---'-"--10t
15
|
OSI
,/
,/
40-1 30
0,38
0,38
0r 38
10115
0 1415 11
0r 38 10
10
38
36-72,5
10
2ol2?
I
(
616
rb
I
c rd
I
erf
tn0.38vtJv
III.
UNITS OF VALUETo
permit
comparisons betweencountries,
prices
expressedin
nationaIcurrencies
needto
be
convertedto a
commonunit. rn this
study
tr,rocommon
units
are
used :(i)
the
European currencyunit
(Ecu);( i i
)
the
purchasi ng power standard (pps).
THE EUROPEAN CURRENCY UNIT ( ECU)
The Ecu i
s a
basket-type currency unit
of a certain
amountof
each
of
theaccording
to
the
gross nationaL productMember State.
based on
the
market exchange ratesCommuni
ty
curnencies,
t.lei ghtedand intFa-Community
trade
of
eachrn 1984,
this
weighting wasrevised
onthe
accession ofremain
in
force untiL
further
notice.
The new composition
of
the
ECU basketis
as folLows:DM
0.719
LrT
140
FF
1.31
DKR 0. 219rRf
0.00871
BFR3.71
uKf0.0878
LFR 0.14Greece and t.li LL
H FL 0.256
DR
1 .15.The conversion
rates
for the
ECUagainst
the
nationaL currencies
in
January
of
each yearare given
in
a
tabLein
the
statisticat
Annex.The
definition of the
Ecu
is
such
that it
refLects fLuctuations
inexchange
internationaL fLows
rates
and
is
suitabLe
for
measuringthe
prices
and vaLues ofof
goods
and
services.
Data
expressed
in
Ecutherefore
permit
the
comparisonof
prices
in
termsof
money changedat
abank. Such currency cdnversion
at
the
market exchangerates,
however, hasthe
disadvantagethat it
fLuctuates
in
time
underthe
influence
of
manyfactors llhich are
independentof
internaL
price
movements :(i)
capitaL transfers;
(ii)
poLiticaL
decisions;(iii)
reguLations;(iv)
specuLation;The PPS
is a
referenceunit
so
catcuLatedthat
its
vaLuein
retation
tothe various nationat
currencies
is
proportionaLto
the
purchasing polrerparities
(PPP) between these currencies.The purchasing pouer
parities
reflect
the
ratios
betveenprice
leve[s
in
the
different countries.
The
ratios
betveenthe
prices
expressed in'nationat
currencies are calcutated
for
eachof
the
productsincluded
in
the
usesof
the
GDP.If
theseratios
are
suitabty weighted,
one obtainsmean
price
ratios,
the
most generalof
whichis
the
meancalculated
for
the
GDP and known asthe
PPPat
GDP[eve[.
Such
parities
wouLdbe
adequateto
expressaLt the data
in
real
termsin
the
currencyof
any oneof
the countries considered.
The method ensuresthat
they
are
transitive
andunaffected
bythe
country chosen -asa
basisof
reference.
For Community catcuLations another referenceunit
known asthe
ppSis
used.It is
defined by appLyingthe
price ratios
to
the
GDP ofthe
various countries
expressedin
nationat
currencyand
adjusting
theparities
sothat
the
valueof
the
GDPof
the
Community asa
whoLein
1975is
identicat
whether
expressedin
ECUor
PPS.
0n[y
the
proportionaccounted
for
by each countrywitL
bedifferent.
When
prices
are
convertedto
PPS usingthe
GDPparity,
the resutt
may beinterpreted
as foILows :If
onegigajoute
of
energycosts
10 PPSin
country A and5
PPSin
countryB, this
meansthat after
a[lowancehas
been madefor
the
differencesbetween
the
general[eve[
of
prices
in
the
twocountries,
this
gigajouleof
energyis
twice
as expensivein
country A asin
country B.This
conclusion
is
independentof
market
exchangerates,
vhich
areinfluenced
by
factors
other
than
the
teveL
of prices
(movements ofcapitat,
specuLation,interest
rates, poLiticaI decisions, etc-).
The conversion
rates
for
the
years
coveredby
the
study
are
given
in
atabLe
in
the
annex. They were revised whenthe
base year Has changed.PRICES
IN
CURRENT PPS AND CONSTANT PPSThe
price
surveys requiredto
calcuLate purchasing powerparities
are
notcarried
out
everyyear.
The mostrecent availabte
is that for
1980 ananother
is
ptannedfor 1985.
Since
the parities
are
price
ratios,
however,
their value for the other
years
may
be
estimated
byextrapolation
usingthe
movementof
the
GDPprice indices
for
the
variouscountries,
referred
to
as
the
Communityaverage.
Theseare
known astrcurrent
paritiesrr.
The
data
can
also
be
convetted
into
base
year
pps. rf price
seriesdef[ated by the
GDPprice
index
for
eachcountry
are
expressedin
baseyear
PPs,
oneobtains an
indication
of
the
changein
prices
for
theproduct
in
question
in
relation
to
the
generaL Levetof
prices
in
thecountry.
The dataso
calcutated
canatso
be
compared betyeen countries,giving
the
sameresults
in relative
terns
as
yitt
be
obtained usin!
curPentprices
andcurrent
PPP,
since the
tatter
are
extrapotatedusint
the
sameindices,
namety,the
GDPprice
indices
for
each country andthi
average Community index.
catculation
usingdeftated
ppsis
thus
carried out
asfollous
:1-
Theprices
of
the
time
series
in
current
national
currencyare
dividedby
one
hundredthof the
GDpprice
index
of
each
of the
years concernedl2.
This deflated series
is
convertedto
PPSusing
the
conversionfactor
of
the
baseyear
1980.4. PRI CE SERI ES
In the tight
of
the
foregoeing, the resutts
of
this
surveyof
Communityprices
are given
in
three
forms :1.
a series
of
current
prices
in
the nationat
currencyfor
each country;2.
a series
year
in
current
ECU usingthe
conversionrates
for
Januaryof
theconcerned;
3.
a series
in
rrdeftatedrr PPs (baseyear
1980),
rhich
aLlors
prices
to
beIV-
TAXATIONIn the
Community,
i ndi
rect tax
:sa tes
of
e Lectri
c ity
are
subj ect to gene ra L( i
)
va Lue-addedtax
(VAT)rate);
(ii)
turnover
tax in
oneconsumpt i on on Ly.
i
n
eteven
count ries
(two
having a
zerocount
ry
(G reec e),
app t ied to
domest i cFurthermore,
specific
taxesare
tevied
in
seven countries.The
prices inclusive
of
aLLtaxes
shoynin this
study
comprisea[L
thetaxes mentioned
above.
rn
the
tabLesin
the annex, the
amountof
anyspecific
taxes
can
be
calcuLated
from
the
difierence
betueen thetax-exctusive
and VAT-excLusiveprice,
urhiLethe
difference
between thetotat
tax-inctusive
price
and VAT-excLusiveprice
gives the
amountof
vaLue-added
tax
(turnover
tax
for
Greece)in
nationJt
currencyper
kllh.1.
GENERAL INDIRECT TAXrn
generat,
vATis
caLcutated andapplied
to
the price
exLuding vAT butincLudinganyspecifictaxes,thesebeingpart"ri1effi-oi
assessment- France
constitutes
an exceptionsince
VATis
computed onthe price
excLudingspecific
taxes.The
rates
are
as fo L Lows :va Lue-added
tax
on e Lectri
c ity
sa Les(%
of
price
before VAT)J anua ry 1 980 1981 1982 198s 1984 1
985
1986FR
of
GermanyF rance
Ita
ty
(domest i c )Itaty
(non-domestic)NetherLands
BeLgium
Luxembou rg
Uni
ted
Ki ndomIreLand
Denma r k Spain Po rt uga L
13
1317
16
17 1688
15
1518
1816
1755
00
00
22
2213
1418
16
1g 1688
18
1818
1917
1756
00
00
?2
?214
141g,6
1g 1699
9t
18
9t 1819
1917
1766
00
00
22
22r12
-8
13
17 ,6
6
14 18 16
5
0 0
VAT
is
deducti[e
for
industriaI
and commerciaI consumersregistered
for
the
purposesof
vatue addedtax.
Turnover
tax
onetectricity
satesCl
of
price
before tax)J anua ry 1 980 1 981 1982 1 983 1984 1
985
1986Greece (domesti c) 10 10 10 10
?.
SPECI FI C TAXES( a
)
Fede ra L Repub L,ic
of
Ge rmanySi
nce
'l
J anuary
1975a
compensatory taxLevi
ed
to
promotethe
use
of
Community
rates
of
whichvary
accordingto
region
:(Ausg Lei chsabgabe)
has
beencoaL
in
powerstations,
the(%
of
pri ce before
tax )1 980 1 981 1982 1 983 1984 1
985
1 986Hambu rg
Hannove r
Diisse
tdorf
Western Zone
Frankfurt/Main
Stuttgart
Mtin c h en
Southern Zone
5.1
4.3 5.3 5.3
4.1
4.0 4.0 4.0
5.1
4.? 5.3 5.3 4.0 4.0 4.0 4.0
4.7 4.0 4.8 4.8 3.8 3.7 3.9 3.9
3.8 3.3 4.0 4.0 3.?
3.1
3.? 3.2
3.9 3.4 4.0 4.0 3.2 3.2 3.2 3.2
3.9
3.63.4
3.24.0
3.74.0
3.73.3
3.13.1
?.93.3
3. 13.3
3.1(b)
FranceSa Les
of
e Lectri
c ity
hrere sub j ectat
the
foLLowingrates during
theto
muni c i pa
L
and depa rtmentaL
taxesperi od studi
ed
:Muni ci pa L tax Departmenta L tax Tota L
Locat i ons
1 980-1
gg5
19g6 1 980-1995
1986 1 980-1985
1986LiLLe Pari s
lularsei L Le
Lyon
Tou Louse
St ra sbou rg
8
13.2
8 8 8
8
13.?
8 8 8
9
13.?
12
8
10
4
10
13.?
12 12 1? 4
2
4
4 4 4 4
For
detaiLs
of
the application
of
these taxes see chapter V.2.b)(c)
ItaLyE Lect
ri
c ity
consumpt i onthe
rates
of
which havei
s
subject
to beenas
foLLowserariaLe),
LIT/KI.Jh
Non-domest i c
S 200 000ktJh /month I 72OO 000 ktJh /mont h
0.65
0.325
a
State
tax, n (i mpostasince 1981rrr
:Reg i on
North and centre South and isLands
Certai
n
typese Lect ro-chemi ca L,
of
consumpt ion
aree Lect ro-meta L Lurgi ca L,
exempt
from this
taxpubLic Lighti
Agt
rai Lways.(1)
A more compticated system was Domest i c
1.10
0. 55
MunicipaLities Provi nces
Use rs
1
983
1984
1985
1986 1983
1984
1985
1986Domest i c
for
the
bLock75 kt'lh /month
Non-domest i c
1
O0Okw/month 4.5 5.5ALL these taxes
are
inctudedin
the
basis
of
assessmentto
VAT. (d)
Denma rkA
speciaL governmenttax
on
eLectricity
trasthe
rates
of
which wereas
foLLows :i nt roduced i
n
ApriL
1977,
1 .1.80-?9
. 6.80 8
6rel k[,lh30.6. 80- 14
. 6.82
1 2. 50 6rel kt,Jh1 5 . 6. 82'31
.12.82
1 4. 30 d re / kWhThis
tax is
incLudedin the
assessment same uJay asVAT;
in
other
words,
theevent
of
resa Le.to
VAT andis
deductibLetax
is
onty
payab Le once1 .1. 83-31 .12.85
1.1.86-....
1 5 . 50 6rel kl'lh
1 9.00 6rel kt,'|h
a
1n
a
1n
the
the
(e)
GreeceSi
nce
1984 a
stampca Lcu Lat i ng turnover
price
of
eLectricity
duty
of 1.2
%which
is
takentax
has been app t ied
to the
taxto
domest ic
consumers on Ly.i
nto
account i nexctusive
seLLing(f)
SpainSeveraL
specific
taxes wh i ch were
taxes were app L i ed duri ng
abo t i shed on 31 .1 2.85 may
the
peri od 1 980-1985.
ThesePeriod Sector SpeciaL tax
PTA/ Kt.lh
I GTE
%
ProvinciaL tax
'l
Muni ci pa L tax %
1 | 1980 1 | 1981
Househo Lds
Indust ry
-1.5
5.0
0.075 0.250
1.5 1.5
1 | 198? Househo Lds
Indust ry
4.23
0. 23
1.5
5.0
0.075 0.250
1.5 1.5
1 | 1983 Househo Lds I ndust ry
0.27 o.?7
1.5
5.0
0.075
0. 250
1.5 1.5
1 | 1984 Hou seho Lds
Indust ry
0.29
a.?9
6 6
0.3 0.3
1.5 1.5
1 | 1985 Househo Lds
Indust ry
0.35 0.35
6 6
0.3 0.3
-For
detaits
of
the
apptication
of
these taxes seechapt.r1.12.b)
g)
Portuga Linspection
tax
whichis
incLudedin
the basis
of
assessmentto
vATlevied
at
the
foLloning
rates
:Househo tds I ndust ry
An
is
6.8.76
-
?2.4.9?23.4.82
- or.!
1?.50 esc/month
37
.50
esc/month2.50 esc /month
V.
ELECTRICITY PRICESIII
THE VARIOUS COU]ITRIES1.
FRof
Germany?.
France3.
Ita Ly4.
Nether tands5.
Be tgi um6.
Luxembourg7.
United Kingdom8.
I re Land9.
Denmark1
0.
Greecea)
Situation
in
the
eLectricity
industryThere
are
around1
000electricity
distribution
companiesin
the
FRof
Germany, 347 having
their
ob,n generatingcapacity whi[e
the
others
aresoLeLy
retai
ters.
The companiesare
of
varying size and legat
form-This
decentraIized
systemleads
to,
insofar
as
interests
us here,
agreat
diversity
of
prices reftecting the
natureof
each zone.Three
pricing
systemsare
to
be found :(i)
the
tariffs
appLiedto
smaLl low voLtage consumers which must bepubLished
by
the
setLer and contain
an
obLigation
to
suppLyaccording
to
the
'rLaw on energyt';(ii)
the
quasi-tariffs,
principaLLy
for
suppties
in
low vottagefor
storage
heating (househotds,
shops,
offices, etc.)
which takethe
formof
non-pubLished agreementsl(iii)
individuaL contracts
coveraIL
other
cases,notab[y
for
supp[iesto
industry
andare
negotiated
betweenthe parties
concerned.Often
the
contracts
offer
the
sameprice
to atI
cLients
havingsimi Lar suppty conditions.
To
iLLustrate
this
thethe
pubLic
distibution
pri c i ng system :
tabLe beLow shows
the
saLesof eLectricity
bycompanies
in
1984broken
downby
sector
and(GhJh)
Secto r Tari f f s Quasi
-tari ffs
Indi vi dua Lcontracts
Tota t
Hou seho Lds I ndu st ry
Commerce
etc.
PubLic adm.
Agri cu
tture
Pubtic
LightingTransport
74
_405
?3 172
2
2006
3051
095651
575
660
19
136 779
14 330
20 707 388
1
4994
63294 056
136 779
40 077
2? 907
7
3532
5944
632TOTAL 107 177 ?? 886 178 33s (1 ) 308 398
[image:28.578.79.501.469.671.2]FR OF GERMANY
At the
endof
1984the
consumerssupplied
by the public distribution
network were made up as
follows
:Use rs
1000n
Standard consumersHouseho Lds
Comme
rce,
admi ni st rat i ofrt
smaLL industryI ndust ry
Agri cu Lture
26 ?21
3
017?a7
65?
87 .1
1 0.0
4.7 2.2
Da....Da
Ia. . . .16
Ic....Ig
TOTAL 30 096 100
The average
1 980
1981 1982
consumption
per
domesticuser
has evolved as foLLows :kllh /
year
khJh / year3
454
198s
s
4643
462
1984
3
5803
430The
eight distribution
networks chosenfor this
study
are
amongst theLargest and represent 53
z
of
etectricity
saLesin
ttre rn
of
Germany.To meet these needs
the fotlowing
energy sourcesare
usedin
the
pubticpouer
stations:
Sources 1 980 1984 1 98s
Hydroe Iect
ri
cNuc Lea
r
fue Ls Coa LLi gni te
Fue L-oi L
Natura L gas
Deri ved gases
0ther
5.3
14.4 ?6.5
30. 1
5.0
17 .4
0.9 0.4
4.7
27.9
30. 5
27.0
1.1
7.6 0.4 0.9
4.1
36.5
?9.1
24.1
1.3 4.6 0.5 0.9
TOTAL 100
b)
TaxesSales
of etectricity
are subject
to
vatue-addedtax
(VAT)at
the
rateof
14 Zon
the
VAT exctusiveprice
since
1.7.83t
13 Zbefore.
VATis
deductibte
for
conmerciaI andindustriaI
consuners.In
addition,
since 1
January 1975a
compensatorytax
(Ausgteichsabgabe)has been
tevied on
etectricity
sates
vith
the object
of
increasing theuse
of
ComrnunitycoaI
in
the
porer
stations.
Therates
are
revisedperiodicatty, in
general oncea year
andsince
1978they
havediffered
according
to
Federatregion.
At
the
beginningof
eachyear the
rates Here asfoltovs
in
the
regions chosenfor
our
study:
(I of
price
before tax)1980 1981 1982 1983 1984 1985
1986Hamburg
5.1
5.1
4.7
3.8 3.9
3.9
3.6Hannover
4.3
4.2
4.0
3-3 3.4
3.4
3.?Diisseldorf
5.3
5.3
4.8
4.0 4.0
4.0
3.7 blesternzone
5.3
5.3
4.8
4.0 4.0
4.0
3.7Frankf
urt/lrlain 4.1
4.0
3.8
3.2 3.2
3.3
3.1Stuttgart
4.0
4.0
3.7
3.1 3.2
3.1
2.9ttliini
ch
4.0
4.0
3.9
3.? 3.2
3.3
3.1Southern
zone 4.0
4.0
3.9
3.? 3.2
3.3
3.1Federat
average
4.5
4.5
4.2
3.5 3.5
3.5
3.3This
tax
is
inctudedin
the
basis
of
assessmentto
VAT.c
)
Househo Ld pri ces-tariff
The
regutations
governing domestic
tariffs were
exptained
in
trEtectricity
prices
1980-1985n.
It
shou[d
be
rememberedthat
eachdistributor
mustoffer
a
choiceof
4
tariffs
to
their
customers:-
tr{o tuo-part
tariffs vith
a different
make upof
standing charge andcommodity
rate
;
-
a
smalt userstariff
;
-
anoptionat
off
peaktariff to
be combinedyith
oneof
the
above.These
tariffs
appLyto
smatl domestic consumers(D,
Db Dc).Above
this levet,
particu[arty
uhenetectricity is
usedfor
heating(standard consumers
D,
and D^)the
distributors
are
free
to
offer
moreadvantageous conditiofrs vhich= form
the
basis
of
non pubtished contractsFR OF GERMANY
d)
HouselgLdprices
-
anal.ysisThe
results
are
shownin
tabLes1-4
in
the
annex.Setting prices
rose by4-8
Z
in
DiisseLdorf andthe
Uestern Zone betueenJanuary 1985 and January 1986
whitst
in atl
other
regionstax
exctusiveprices
remainedthe
same.
Thedifference
of
tess
than
1 z in
theselling
prices
is
due
to
smalt
changesin
compensatorytax
uhich
uasDuring
the
period
1980-1986it is the
[arger
consumers,
chargedaccording
to
the
quasitariffs
uho havesuffered
the
Largest increases(40-55
%
for Do). This
has
had
the effect of
reducing
tariff
degressivity vhiEh
nonethetess remainswide. In
1986the
standardi;ffi:t..
D"
pays 67-74Z
less
per
k|rJhthan
D.
as
asainst
69-76I
in
The range between extreme
prices
in
the
eight
tocations
surveyed variesfrom 8-?2
z
according
to the
teveI
of
consumptionin $gc.
ThisregionaL
dispersion
is
more pronouncedfor
"heaiing" users
(D_) thanfor
the
sma[[ consumers(D.,
D,.) and has grownsince
19g0.thiseis
dueto
the
independenceof
cofrpaniEsto
formuLatetheir tariffs
based oncosts.
This creates
a
difficuLty in
setecting
a teve L and pri ce t rend in the
F.R.
Germany.ca t cu
tate
a
median
price
f romthe
ei ghtyear
and standard consumer. This
exerci S€rrema
rks
gi vesthe
f o L Lowi ng resu Lts
:Location
whichtypifies
theOne soLution seems
to
be toLocat i
ons
su rveyed for
eachwhich confirms
our
eartier
Medi an pri ces (Pflkh,h)
reduced.
Stand. cons. 1
980
1981198? 198s
1984198s
1986
21996t80 D3;
DC
e
34.39
37 .7326.07
29.9619.92
2A.419.56
11 .?443.55 44.36
45.9933.1
5
33.67
35 .14?3.56 ?4.57
?5.4413
.26
13.41
14.1446.40
46.3135
.69
.35 .6726.09
?5 .9414
.33
14.64+35
+37
+37
+53
Between 1980 and 1986
tax
inclusive prices
rose by 30-61z
depending onthe
region and standard consumer. Taxes,yhich
remained around tS-iO Zof the
se[[ing
price
played
r.itt[e pirt.
The
rising
cost
of
fuel
however ptayed
a
considerabLepart
Q5 Z
of etectriciti is of
thermatorigin).
Theimp[icit
gross domestic productprice
index rose by onty19
?4in the
sameperiod
makinger.eciricity
more expensivein
reatterms,
especiaIty
for the
Larger consumers yhosuffered
the
largesti nc reases.
e)
Industri
aI
pri ces-tari
ffs
AtL
industriaI
users
are
chargedaccording
to
individuaI
contractsdraun
up
by
eachdistributor,
there being no
pubLishedtariffs.
Ag9!?i
ted
explanation
of the
system Hasgiven
in iElectricity
pricesf
)
Indust r.i a L_ prices,-
ana Ly,s,i sThe resu
Lts
are
shown in
tab Les5-8
in the
annex.It
shouLd be notedthat
the analysis
is
basedon
the
price
excludingVAT
but
incLudingthe
compensatorytax.
t,,|hiLstprices
in five of
theregions
surveyed remainedvirtua[[y
unchanged fromtheir
1985 leveLs,prices
in
the
remainingthree
areas increasedby
between2
7. and 14 %with
DijsseLdorf(9-14
7)
and
the
WesternZone
(6-8
%>suffering
increases substantiaLLy above
the 2
%inflation
recorded betveen 1985and 1986.
It is difficul.t to
choosea
tocation
which
is
representative
of
the Levet andevotution
of
prices
in
Germany. One soLutionis to
calculatea
medianprice
from
the eight
tocations
surveyedfor
each standard consumer.This gives
the fotlowing
resutts:
Medi an pri ce
(Pflkt.lh)
Standa
rd
1 980consume rs
1981 198? 1 983 1984 1985 1986 % 1986180
I
i:
I;
?0.20
21.94
?5.3216.05
17.34
20.4013
.23
',l4.54
16.6312.63
13.73
15 .9725.?7
?5.3220.?6
21 .0016.68
17.4516.35
17 .09?6.1?
?6.53?1
.10
21 .2817
.50
18.2?17.10
17 .28+31
+33
+38
+37
Due
to a
Lack of
price
i nf ormat ion
h,epri ce
for
the
standard consumers Ia,
IURegi ona
L
price
differences are
greaterbetween ext reme pri ces f
or
I,",)
than
f orI*)
and
resuLt
from
the Liberty
ofestab L i sh t hei
r
tari
ffs
based on cost s .have
not
ca Lcu Lateda
medi anand I,.. .
Y
for the
sma LL
consumers(31
%the
Large
consumersU9
% f orthe
di stri
but ion
companies
toFor
internationaL
comparisonwe
have
chosen
Diissetdorf
to
ensureharmonization
with
househoLdprices
andother
sourcesof
energy (gasprices
for
exampLe).Tariff
degressivity
has
changedtittLe
throughoutthe
period
studiedwith the
standard consumerI,
Oaling 34-47Z
tess
per
klt|hthan
Ic.
Etectricity
is
current[y
more expensivein
reaL termsfor
aLI
consumersthan
in
1980, prices
havingrisen
by ?8-47 Z whiLstthe impLicit
gross2.
FRANCEa)
S'ituat,ion'in
the
el.ectric'ity
industry!'lhi
[st it
doesnot
enjoy
a
monopoLythe
pubLicenterprise
rrELectricit6de
Francerr (EDF)created
by the
nationatisation law
of Aprit
1946dominates
the
etectricity
sector.
rn
1985only
10 %of
the
production ulas accountedfor
by other
companies(cot[eries,
raitways,
tocaLauthorities
and
industriat
autoproducers) and8
%of
the
consumptiondistributed
byother
undertakings.The
distribution
of
electricity (aIt
companies) was made upas
foILowsin
1985 :Gt.lh
Low vottage
Househo Lds
ProfessionaL users
PubLic Lighting Hi gh vo tta-ge
Industry
Ra i Lways
Tert i
ary
and pnofessi ona LAgri cu Lture
114 700
86 500
21 400
6
80016s 100
127 000
9
700?6 200
2
20041 31
8
2
59
45.5
3.5
9
1
TOTAL
(of
which EDF279 800
?57 400
100
92)
The subsc ri bers
Low vo Ltage
Hi gh vo Ltage
targe
of
whichothers
served by
i ndust ry
EDF were as foLLows
at
the
endof
1985 :25 300 000
171 8s0 5s0
In
turn
domest ic
consumers hrere made up as f o L Lovs :Cat ego ry
Ktlh lyear
In
z
Gr{hStanda rd
consumers
unde r
1000-?
001-
5001-ove r1
0002
0005
00010 000
10 000
26.3 ?4.9 30.8 10.5
7.6
3.9
11.0 28.8 2?.0 34.3
D
3;
3:
e TOTAL 100 100
Net production
of
the pubtic
services
comes fromthe fotlouing
sources:z
Sou rc es 1 980 1984 1 985
Hydroe tect
ri
cNuc Lear
SoLid fuet
Pet ro Leum products
Natura
t
gasltlanufactured gas
30.9
?6.9
21 .2
1 8.4
1.9 0.8
23.1 64.2
10.5
1.2 0.5 0.5
19.8 70.7
7.7 0.9 0.3 0.6
TOTAL 100 100 100
An
agreement
rras signed
betyeen
the State and
EDF
onthe
24th October 1984yhich forsees
in
particular
:-
a better reflection
of
costs
in
the selting
price;
regular
updatingof tariffs uith
the
price
per
k]rhbeing
kept 1
Zbetoy
inf
lation
if
possibl.e;
-
identicat
tariffs for
the
whote metropotitanterritory i
- tariffs
shoutdhetp
users decideon
the
basis
of
the actuat cost
of suppty;
-
equat treatment
for
consumersyith
the
samecharacteristics,
eachhaving
the
choice betueendifferent
tariff
options
i
-
the
extensionof
seasonat andoptionat
tariffs to
toy voltage
t
..-
a
narrouingof
the
gap betveen domestic andprofessionat
tariffs yitli
a
viewto
equatity
;
-
emphasis onsales
to
industry
uith
an
advertising
camaignto
promoteconsumption;
-
proposition
of
tongterm contracts
to
large industry
nith
guaranteedprices
in
return
for
a
consumption conmitment.FRANC E
b)
Taxesi
.
Va Lue-added taxAL
L
suppties
of
etectri
city are
LiabLetax-excLusive
pricet
the rate
being 18.6before.
vAT is
deduct i b Lefor
i ndustri
a Lhave opted
for
the
generaL vAT scheme.ii.
LocaL taxesto
VAT,
ca LcuLated
on
the% f rom
1
JuLy 198? and 17.6 %and commerci a
L
consumers whoThe
rates
andbasis
for
the
assessmentof
municipaL and departmentaItaxes
on
e[ectricity
suppties
hreremodified
by
the
Lawof
29
December1984 though
the
changeonty
cameinto
effect
in
March1985.
The basisof
assessmentis
now asfoltows
:Subscribed
demand
KVA
Kt.l%
of
taxexc
L.
pri ceSt anda rd
consume rs
ss6
36-?50>
250{
32.432.4-225
80
30
Da-Da ra
ru
r,
rd. . . rg
Previ ous Ly
the
taxes
hrere app L i edf
or
tow vottage
supp L ies
( standa rdThe maximum
rate
permittedby
LawPari s.
to
80
%of
the
tax
exc Lusive
pri ceconsumers Dr-De) .
is
1? %with
however an exceptionfor
The
fo L Lowing
tabLe
summarises the
ratesdepartmentaL taxes
during
the
period
studjed:
of the
muni ci pat
andLoc at i ons
Muni ci pa L tax Departmenta
t
tax Tota L1 980-1