1 Quantifying Intra-Organisational Risks: An Analysis of Practice-Theory Tensions in
Probability Elicitation to Improve Technical Risk Management in an Energy Utility
Gillian Anderson ([email protected]) Lesley Walls ([email protected])
Matthew Revie ([email protected]) Euan Fenelon ([email protected]) Calum Storie ([email protected])
Department of Management Science, University of Strathclyde, 40 George Street, UK, G1 1QU
Scottish Power Generation Limited, Cathcart Business Park, Spean Street, Glasgow, UK, G44 4BE
Keywords
2 Abstract
3 1. Introduction
Scottish Power (SP) is one of the largest energy utilities in the United Kingdom and became part of the Iberdrola Group in 2007; making it the fifth largest energy company worldwide. SP runs its business through two divisions: Energy Networks; and Energy Wholesale and Retail. The former is accountable for electricity transmission and distribution to approximately 3.5 million residential houses and businesses, while the latter is responsible for energy generation and supply. Scottish Power Generation (SPG) is a subdivision of Energy Wholesale and Retail and is organised around its physical assets. These include coal, gas, hydro-electric and combined cycle power stations as well as a facility for manufacturing fuel pellets.
The Technical Risk Management (TRM) process is core to SPG operations. The TRM provides an overarching framework used across the multiple sites, providing an overview of the risk appetite of the business, driving the capitalized planning program and determining the need for controls and mitigations. The TRM plays an important role in SPG, impacting key decisions related to strategic investment and regulatory compliance. For legislative reasons, the TRM process must comply with the UK Health and Safety Executive’s (HSE) ‘As Low as Reasonably Practicable’ (ALARP) guidelines (HSE, 2001), while simultaneously aligning with the risk management processes adopted by SPG’s international parent organisation, the Iberdrola Group.
A qualitative risk matrix (e.g. Vose, 2008, UN, 2012) is fundamental to the risk model
4 numerical probability ranges as defined in company documentation. The consequence valuations are also based on a scale from 1 (minor injury) through to 5 (loss of life). The risk score is the product of probability and consequence, and is bounded between 1 and 25. The same risk matrix is used to support assessment of risks in relation to personnel, environment, finance, stakeholders and operations. The results of the risk assessment feed into processes, such as tolerability of risk to personnel, plant modification, plant status review and so-called strategic spares that are critical assets required to maintain operations.
The elicitation of subjective judgements about the probability and consequence of diverse uncertain events by multiple engineers across all plants is core to the quantification of risks in the TRM process. The scale of the technical risk management process involves hundreds of engineers providing their personal probability assessments of uncertain events that might affect the assets for which they have responsibility, expertise and experience. The elicitation of these probabilities is repeated annually to allow the TRM to be updated. SPG are aware of the considerable practical challenges of gathering judgements on such a large scale and repetitive basis. For example, there is awareness in SPG about the potential for bias between the risk scores judged by engineers with local knowledge of assets within their own plant and the perceptions of the risk priorities of more senior managers who possess a global company perspective. Until recently risks were assessed within a plant, giving some degree of consistency locally. However a proposal requiring risks to be assessed by type of asset, and so across plants, was considered to have the potential to make future elicitation of risk more challenging given the additional variation introduced. Such a change implies a new way of framing elicitation of engineering judgement. This is needed since multiple assets, although spatially separated, will be considered in the same risk assessment.
5 their assets might be susceptible. While historical data on operational events are routinely collected, such data are sparse, reflecting past system states and environmental conditions. Therefore historical data estimates of event rates are inadequate for providing risk assessments because typically gathered data are unrepresentative of the true underlying likelihood of an event. For example: for some assets no historical events might have been observed; or historical events might have been recorded only for a similar asset type in another plant operating under different circumstances; or events might have been recorded for a specific asset whose operating procedures might have changed quite significantly over time. Engineering judgement has been chosen as the primary TRM data source because it allows qualified people, who understand the asset technology, the operational environment and who can interpret information relating to observed events affecting similar assets, to make informed assessments about the uncertainty of future events based on their expertise and experience.
The literature on the structured elicitation of judgemental or subjective probabilities
includes many articles which explore the meaning of expertise and what we mean when we
refer to someone as an expert. For example, Ferrell (1994) defines an expert “a person with
substantive knowledge about the events whose uncertainty is to be addressed”. There is
debate about whether subject matter expertise makes people better at assessing uncertainty of
events. For example, Lambert et. al. (2012) examine risk aversion and overconfidence
between two groups within an experimental study – subject matter experts (i.e. bankers) and
non-subject matter experts (i.e. students). The study found that both groups had similar
attitudes towards risk aversion, and that the subject domain experts tended to be more
overconfident in their probability assessments than the students. While it is a contributing
factor, subject matter expertise alone does not make people good probability assessors.
6 who are our subject-matter experts, to assess and express their uncertainty about future events
accurately. Further, we aim to explore how the selected engineers are trained to provide their
expert judgement about the uncertainty of events. In our case, the SPG ‘experts’ are selected
based on their input to the TRM and these tends to be experienced engineers, often with
management responsibilities and in senior roles within the organisation. A prerequisite is that
all should be recognised by their peers as subject matter experts in a specific field.
Our goal is a pragmatic one since we aim to systematically investigate how the TRM is implemented within SPG and to provide recommendations for incremental process improvements, especially in relation to the elicitation of judgemental probabilities. In particular, we aim to understand how probability elicitation is conducted in practice for a recurrent, organisation-wide process, such as the TRM. This allows us to compare a real situation in relation to the theoretical principles of subjective probability judgement elicitation from experts for risk assessment as reported in the literature; see, for example, Cooke (1991), Meyer and Booker (2001), O’Hagan et.al. (2006), Bedford et al. (2006). Through our comparison, we provide meaningful recommendations to further improve the methods used for judgemental probability assessments within the TRM process. To meet our overarching goal, we specify two objectives for our study: firstly to investigate how engineers within SPG actually make probability judgements as part of a technical risk assessment; and secondly to compare the performance of alternative methods for subjective probability elicitation to better understand how they might affect the accuracy of judgements captured as part of a recurrent technical risk assessment.
7 expert judgement elicitation for risk assessment. We then describe how we designed our experimental study to investigate selected subjective probability elicitation methods, including the one used by SPG. We share our analysis of the experimental data and discuss the practical implications of our results. Finally we explain the recommended changes to the TRM and reflect on their implementation, allowing us to gain insight into the impact of our work on the company’s risk management processes and we explore those lessons that might be applicable to other organisations.
2. Review of Current Technical Risk Management Process within Utility
To understand how risk assessment is implemented in SPG, we conducted semi-structured interviews with nominated engineers. All were highly experienced, influential and recognized by their peers as being qualified to provide values for the risk score in relation to events affecting a particular class of assets. Engineers represented different disciplines, plants and all had a minimum of 20 years of experience. Semi-structured interviews allowed us to blend a degree of structure and improvisation in our study. Typically we explored issues by asking questions in relation to, for example: current practice, especially issues of concern and good practice; the role of subjective probability in making risk assessments; how the standard risk matrix classes were used in making assessments; the nature of any inter-site differences during TRM implementation; understanding the type of information engineers draw upon to judge their probability of an unknown event and exploring how they think through the formation and expression of their assessments.
8 engineers took an example risk assessment of an asset relevant to them and demonstrated how they typically judged the chance of possible events. Interviews took place over a period of 4 weeks, three were face-to-face on-site and one by an electronic medium. Being on-site also allowed us to obtain a tour of facilities and gain better understanding of the assets and environment. Many new insights emerged from our dialogue with the engineers.
While the importance of assessing the likelihood of unknown, future events was acknowledged, concerns were raised about the defensibility of probability judgements due to operational features of the TRM process. For example, engineers needed to consult separate documentation to get the quantitative and qualitative descriptions of probability as used in the risk matrix. Even in the same documentation, there was not always consistent probability values with the same qualitative class descriptions, meaning assessments might be inadvertently made on different scales. Engineers recognized that their probability values were inputs to a larger analysis influencing investment decisions for which their assets or plant might be a beneficiary. Therefore opportunities to manipulate the risk assessment existed, even if there was no evidence that this was actually acted upon. In some situations, probabilities were judged by a single engineer, while in others a group formed an opinion about the chance of an event through open discussions within meetings which historically lacked a standard process for arriving at an aggregate value. Generally, the TRM process was regarded as complex and time-consuming with the transparency and traceability of probability values being lost during the chain of analysis. For example, multiple reviews of the top risks were conducted allowing probability values provided by nominated engineers to be questioned and, in some cases, revised without feedback to the original assessors.
9 specified number of years, whereas other engineers tended to think about probability as a percentage of times an event might occur. Such a distinction might be natural to some extent because some probability assessments may be time based for assets that operate continuously while others might need the chance of failure events for a system that needs to operate on demand. The current scoring scale with five levels was considered too narrow, especially with regard to civil assets where the likelihood of failure is very small. The timing of probability assessments was also regarded as important with engineers being aware that, for example, if a risk assessment was shortly after an incident then there was a tendency to anchor on recent observational data more than usual. For each event considered during an assessment, engineers tended to structure the multiple, complex issues affecting that risk scenario in different ways. As an example, take the situation where a risk assessment is to be conducted for three assets that required to be operated for 20 years without incident. One engineer reasoned that this equated to 60 years without incident, while another believed that it represented 20 years without incident. Both are reasonable interpretations to frame the context in which probabilities are to be assessed.
10 ability to foster and develop trust based networks. This was considered to have a potentially serious effect on the future availability of engineers, with expertise and experience of the natures of uncertainties about events to make good probability assessments.
3. Interpreting Experience Relative to Principles for Subjective Probability Assessment
If we reflect upon the insights gained into the implementation of the TRM process, then SPG appears to break many of the established principles of ‘structured expert judgement’. This is the phrase used in the literature for a body of work on the methods for assessing subjective probabilities of uncertain events by suitably qualified persons (i.e. an expert) in a risk management context. The key principles, as advocated by Cooke (1991), are: reproducibility (all calculations must be reproducible); accountability (source of expert subjective probabilities identified); empirical control (expert assessments should be susceptible in principle to empirical control); neutrality (method encourages experts to state true opinions); and fairness (all experts are treated equally a-priori).
11 In their seminal book, Kahneman, Slovic and Tversky (1982) classify and discuss anticipated heuristics and biases. Numerous authors, e.g. (Alpert and Raiffa 1982, Meyer and Booker, 2001, Lambert et al, 2012) have expanded upon these biases over time and carried out additional experiments to assess their impact. Many examples are evident in the narrative from our interviews at SPG. For example, educational bias arises due to the heterogeneity across engineers in relation to the extent and use of their knowledge networks. Anchoring appears prevalent when experts explain that they rank risks prior to assessing their probabilities and many assessments are made post an event occurrence; therefore the availability of observational data gives rise to a bias on specification. Motivational bias is exhibited since multiple changes could be made to probability values after an engineer has specified his/her belief. Since probabilities and consequences were to be input to the information system used to support the TRM via the same input screen, there was the possibility of structural bias. Even though a standard data capture process exists for the TRM, the method to be used for probability elicitation by different engineers lacks consistency of application.
To inform how we might address some of these shortcomings, let us consider the design of our controlled study to compare alternative methods which might be considered useful in this context.
4. Designing a Comparative Study of Probability Assessment Methods
12 minimized the opportunities for some types of bias and the perceptions around the ease-of-use of different methods.
Over 180 engineers and managers, who contribute to the TRM and so represent our target population at SPG, were selected to take part. We labelled these the company group. To compare our findings with a control group of ‘matched’ professionals, we invited 150 part-time, post-experience international MBA students at Strathclyde Business School to participate. We labelled these the student group. All students were in full-time employment, many as engineers or in other technical disciplines, with the remainder in other business functions. Although not a perfect match to SPG staff, as post-experience professionals the students represented a reasonable and accessible control group.
The type of probability methods selected for our study were informed by our insight from the TRM review as well as from the literature (e.g. Van Der Gaag et al, 1999). We constrained our study to five methods due largely to the practicalities of experimenting with real professionals, even though a larger set of methods exists. The five methods selected include a mix of scale representation. Three methods used a visual scale while the other two methods required numerical values to be specified for either a direct statement of probability or about the uncertainty in terms of lower or upper bounds on the judged probability. Of the three methods presented visually, two had joint verbal and numerical descriptors, while the third had numerical values only. Verbal numerical (VN) scales are believed to have the advantage that they allow an expert to use a scale familiar to them and choose whether to use the words or numbers, which can be a fast way to elicit probabilities (e.g. Renooij, 2001). This speed of elicitation is important for the TRM due to the volume of judgements that are
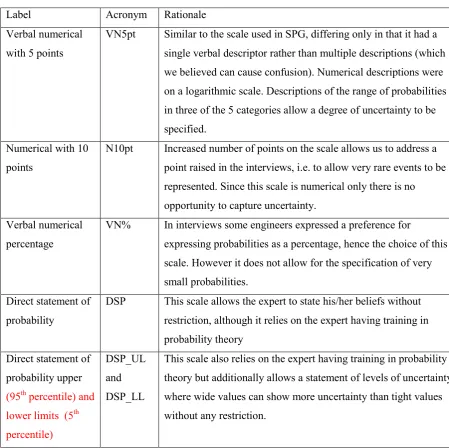
13 Table 1. Description of the subjective probability methods used in designed study
Label Acronym Rationale Verbal numerical
with 5 points
VN5pt Similar to the scale used in SPG, differing only in that it had a single verbal descriptor rather than multiple descriptions (which we believed can cause confusion). Numerical descriptions were on a logarithmic scale. Descriptions of the range of probabilities in three of the 5 categories allow a degree of uncertainty to be specified.
Numerical with 10 points
N10pt Increased number of points on the scale allows us to address a point raised in the interviews, i.e. to allow very rare events to be represented. Since this scale is numerical only there is no opportunity to capture uncertainty.
Verbal numerical percentage
VN% In interviews some engineers expressed a preference for
expressing probabilities as a percentage, hence the choice of this scale. However it does not allow for the specification of very small probabilities.
Direct statement of probability
DSP This scale allows the expert to state his/her beliefs without restriction, although it relies on the expert having training in probability theory
Direct statement of probability upper (95th percentile) and
lower limits (5th
percentile)
DSP_UL and DSP_LL
This scale also relies on the expert having training in probability theory but additionally allows a statement of levels of uncertainty, where wide values can show more uncertainty than tight values without any restriction.
14 We also sought to ensure that we would be able to compare assessed subjective probabilities with the true probabilities of events; hence it was important to select at least one topic for which observational data was, or would, be available over the course of the study. It was also important to include events whose probabilities of occurrence would span a meaningful range, especially in relation to rare events. We also needed to ensure that sufficient information was provided so that study respondents would be able to reason through their probability assessment.
One question focused upon an upcoming event and asked “State your subjective probability that, from the 300 or so 2012 Olympic Games events in London, if an event is
picked at random, what is the probability that China will win a medal?”. A second question
was on a measurable event and was phrased as follows “A transit is the passage of a planet across the sun visible from Earth. Mercury is closest to the sun with the last transit occurring
in 2006. What is the probability that there will be a transit of Mercury within the next two
years?”. The third question required probability to be assessed over a specific time period
and was expressed as “What is the probability that you will replace at least one tyre within the first 6 months of owning a new car? Assume your car is driven the annual mileage of
12,000miles (20,000km approx.) per year.”
The questionnaire design covered all questions and all methods; albeit in a systematic arrangement designed to limit respondents referring to previously answered questions. Three questionnaire sets, each with a different ordering of questions, were prepared to control for any possible question/method ordering effects. Questionnaires from each sets were distributed at random to respondents in both company and student groups.
15 was important to provide examples of how to approach probability elicitation to ensure all respondents were trained to at least a minimum level and also it is reported, by Clemen et al (2000) for example, that providing such guidance can improve accuracy and reduce the number of responses outside mathematical bounds. A feedback form was also used to gather the impressions of respondents about their degree of understanding and comfort using each method. Directly asking for feedback provided a way to obtain more information about the elicitation method and to provide views on their like or dislike of the methods tested. The feedback included an open question to uncover specific issues.
Given the scale and accessibility of respondents, the questionnaire was to be self-administered although different mechanisms were used for both, largely for reasons of practicality. Since the company group was situated in diverse locations across the UK, an electronic version of the questionnaire was distributed to 180 staff with responsibility for entering probability values in to the TRM information system. Each of seven cohorts of the student group was given the questionnaire in paper form. Note that the seven cohorts were based in different geographical locations, although each cohort was effectively equivalent in its characteristics of the student group. The students were briefed on the purpose of the questionnaire and explained the guidance documentation. All questionnaires and feedback forms were anonymous. Response rates varied from 27% from the company to 70% for the students.
5. Insights Gained from Experimental Study
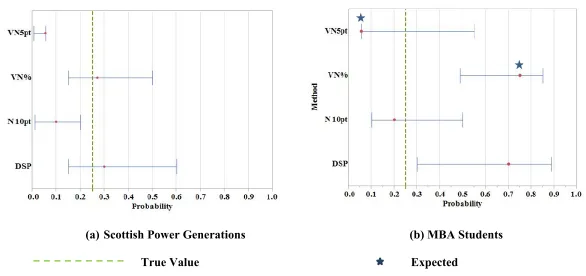
16 For example, for the Olympics question, 47% of the students and 39% of the company group
specified the true value between their stated lower and upper bounds, DSP_LL and DSP_ UL
respectively. Both company and student groups tended to overestimate the chance of
occurrence using the DSP method and generally seemed unable to express low probability
values using this method. For example, for the Olympics question, 21% of students and 38%
of company group specified a value lower than the realisation. These findings are in line with
views expressed by, for example, Kahneman et al. (1982). Therefore, although the DSP methods offered most flexibility in specifying probability values, it was ineffective at eliciting low probabilities. For the low probability questions, the VN5pt range and the N10pt methods provided values closer to the true values than any of the other methods tested.
17
(a) Scottish Power Generations (b) MBA Students
[image:17.842.131.717.122.398.2]True Value Expected
Figure 1. Inter-quartile range and median of probability assessments for Olympics question made on various scales by company and student
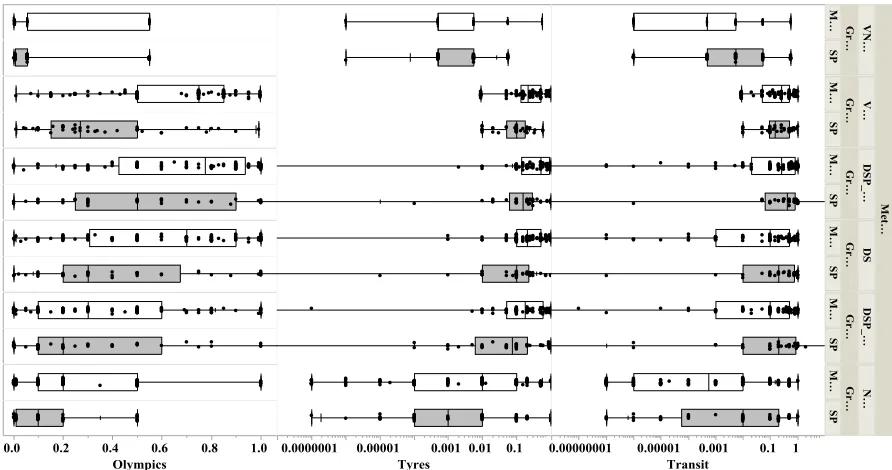
18 Secondly, our analysis identified surprisingly little difference between the two groups. Figure 2 provides a visual display summarizing results where the boxplot representations of the distributions of assessed probabilities by the pairs of SPG company engineers (red) and MBA student (blue) groups are given by method (in rows) and question (in columns). The boxplot shows the median probability of all group respondents in the centre of the box, which is bounded by the 5 and 95 percentiles. The lines from the boxes extend to the minimum and maximum probabilities specified therefore showing the full range of the distribution. Typically, Figure 2 shows similar patterns for the company engineers and the students for all methods and questions, although there are some exceptions. For example, the response of the students to the Olympics question (i.e. the left of Figure 2) is higher than that of the company group. Many of the students questioned were based in Asia and this perhaps might have influenced perceptions of the chance of China’s medal winning chances.
Many subjective probability elicitation studies (e.g. Clemen et al., 2000, Revie et al., 2010) do not explore the differences between the results drawn from students and other demographic groups, such as professional engineers. Naturally, each group has different skill sets, might have been exposed to statistical concepts at different times and might have different experiences and incentives. While we aimed to match our control group with those of SPG engineers to some degree and to provide them with the same guidance, there were several major differences between them including their professional expertise and company culture but arguably most importantly, their past opportunities to provide subjective probability assessments of uncertain events. Hence we were surprised at the lack of any
19 Figure 2. Boxplots of probability assessments for each method (shown horizontally) and each question (shown vertically) for SPG (red
20 Thirdly, feedback from respondents suggested that the DSP methods were the most disliked with 39% (n=99) of students and 72% (n=37) of company group disliking it. The VN5pt method was favourite for the company engineers with 46% (n=23) stating this as their preferred method, although this may be explained partially due to the similarity between their current method and the VN5pt Range method.
It is interesting that a preferred method is not necessarily the one that has the capability to provide better results, that is, closer to the true probability of an event. For example, quantifying the mean square error between the judged probability and the true value for the Olympics question for all methods except the DSP_LL and DSP_UL, for which such a computation is not meaningful, we find that the mean square error for the DSP method (i.e. 1.56) is around thirty time times larger than those for the VN%, VN5pt and N10pt methods (i.e. 0.058, 0.051, 0.045 respectively). Interestingly, the N10pt scale, which performs best, was originally developed to perform well for rare events and so it is reassuring that it also performs well for questions for which probabilities are not small.
6. Improving the Assessment of Uncertainties within the TRM
The TRM underpins analysis that informs decisions at SPG regarding the investment strategy, operational maintenance strategy, and planning for plant modifications. Historically the processes supporting the TRM had developed fluidly and so our study provided an opportunity for a systematic review to support practical changes. Our findings are being used with the intention of achieving better accuracy and consistency of assessments for all users of the TRM process.
21 non-technical risk and across multiple business units. While this brings its own challenges particularly in terms of granularity when assessing risk for both individual plant items and corporate level risks, SPG are developing solutions based on the belief that a unified risk framework is more effective and efficient. The improved TRM process uses revised guidelines to support better elicitation of subjective probability assessments by rectifying the pitfalls identified by our review and insights gained from the experimental study results. The outcome should be a more accurate representation of the risk landscape for their asset population that can be communicated within the company.
At the heart of the TRM, SPG still use a verbal-numerical scale. However, the coverage of the scale has been increased to include more points (i.e. 7 instead of 5), a wider range of probabilities (i.e. from events anticipated once per year through to once per 10000 years) and simplified descriptions of the meaning (e.g. event anticipated once in a specified number of years). SPG risk managers believe the revised scale is practically reasonable for their asset base and engineers, and that continuing with a revised version of a verbal numerical is justifiable in their organisational environment.
22 probability assessments. In future, SPG will be in a position to assess whether feedback leads to more defendable expressions of uncertainties.
To nurture the knowledge networks that historically relied on personal contact both
internal and external to the company, there are plans for supporting knowledge management
and hence the subject matter expertise of their changing workforce. For example, SPG
continues to develop their document management systems and are looking into business
intelligence systems to empower staff to apply the knowledge of their own specialist areas
using common cross system analysis tools and to benchmark with industry peers to develop
good practice and hazard guides.
23 become the means to cleanse data as they go forward due to resource availability. SPG have put in place mechanisms to ensure that all engineering experts providing assessments are treated fairly. For example, there are now plant based review meetings which allow the engineers to justify their selections to their peers prior to the overall business risk review meeting. Further the risks subsequently considered by the senior management team are those provided by the designated experts and so no further scoring or ranking is applied. Judgemental probabilities are deemed to be subject to empirical control because there are mechanisms in place to support appropriate feedback from operational experience. Risks have always been required to be reviewed and updated whenever a related action is completed or in the case of technical plant risks, an annual asset review is undertaken. It will always be challenging to make comparisons for asset types across plants due to the distinctive operating modes (e.g. load balancing) that place different stresses on equipment. Achieving neutrality remains challenging simply because, like many organisations, the structure of SPG is not able to offer a central incentive that might prevent inherent bias arising due to gaming for resource investment. Therefore educating and training engineers on expressing uncertainties (e.g. O’Hagan et al, 2006, Cooke, 1991) is the primary mechanism used to increase awareness of the importance of providing an honest assessment of subjective probabilities.
7. Concluding Remarks and Further Work
Despite limitations of our study, we have managed to provide insight into risk
practices that have led to process improvements in support of technical risk management at
SPG. Our limitations are largely due to the practical constraints of a short-term project and
24 interviews were conducted in SPG, albeit with a representative selection of engineers with whom in-depth discussion was held. It is evident that our SPG interviews surfaced examples of bias, some of which can arguably be better controlled in future and hence their impact on risk assessments reduced through improved elicitation of probability judgements. As the risk management process is repeated at regular intervals, there is an opportunity for building in a
feedback loop to engineers who provide expert judgement. This would provide opportunity to
design mechanisms, which are understood from an experimental context, to support better
assessment of uncertainties into the risk management process. The importance of knowledge
networks on the value of a probability elicitation process has emerged as a particularly interesting insight. Acknowledging the nature of such networks and nurturing them to sustain or develop the knowledge base is important in supporting experts in assessing uncertainty and requires action by companies like SPG who have an ageing physical and human asset population. We have shown that having a standard process and a management software tool in the form of an ERM system is not sufficient for supporting elicitation. The functionality and design features of the system require careful consideration to support probability elicitation. For example, screen layouts and the probability elicitation method used form a major part of the elicitation process, hence scientific principles of expert probability elicitation must be integral to an ERM system. An ERM system will only support decisions that are as good as the data, judgemental or observed, that it contains. Any shortcomings in the probability assessments will influence the quality and validity of information provided by an ERM system.
25 a direct statement of probability (i.e. DSP) is least effective in providing an accurate assessment, especially for very low probability values, even though it is the method that allows the expert most control and flexibility in the specification of a probability value. Interestingly all our respondents appear less able to assess low probability values. Methods that use a predefined numerical scale, either with or without words, yield lower probability estimates than those observed for the selected questions we asked. The company group claimed more confidence using the VN5pt method than the students, but this is not surprising given this is close to the existing organisational standard method, but there was evidence of anchoring on the verbal cues rather than the numerical values. Scales with verbal anchors appear to cue respondents to select a particular probability value and so can affect the choice of probability value recorded. This appears particularly important where there are higher levels of uncertainty, or unfamiliarity with the method, thus highlighting the importance of on-going training and feedback to experts in the use of the probability elicitation method selected. All respondents prefer methods with a scale, although the preferred method for both groups was not necessarily the one that provided the most accurate results. It seems obvious to state, but we cannot underestimate the importance of selecting a probability elicitation method that fits the application context and the range of probabilities being assessed.
26 likelihood, can be examined as has been reported in a new experimental study involving university students reported by Haase et al (2013).
References
1. Vose, D. Risk Analysis, Wiley: 2008.
2. United Nations Economic Commission for Europe, Risk Management in Regulatory
Frameworks: Towards a Better Management of Risks, United Nations, New York: 2012.
3. Ferrell WR, Discrete subjective probabilities and decision analysis: Elicitation, calibration and combination in Wright, George and Ayton, Peter (eds) Subjective
Probability. Oxford, England. John Wiley & Sons. 1994. p. 411-51.
4. Lambert J, Bessière V, N’Goala G. Does expertise influence the impact of
overconfidence on judgment, valuation and investment decision? Journal of Economic
Psychology. 2012;33(6):1115-28.
5. Cooke RM. Experts in uncertainty. Opinion and subjective probability in science. New York: Oxford University Press; 1991.
6. Meyer MA, Booker JM. Eliciting and Analyzing Expert Judgement. London: Academic Press Limited; 2001.
7. O'Hagan A, Buck CE, Daneshkhah A, Eiser JR, Garthwaite PH, Jenkinson DJ.
Uncertain Judgements: Eliciting Experts' Probabilities. Chichester: John Wiley and
Sons; 2006.
8. Bedford T, Quigley J, Walls L. Expert Elicitation for Reliable System Design. Statistical Science. 2006;21(4):428-50.
9. Kahneman D, Slovic P, Tversky A. Judgement Under Uncertainty: Heuristics and
27 10. Alpert M, Raiffa H. A progress report on the training of probability assessors. In: Kahneman D, Slovic P, Tversky A, (eds). Judgement under Uncertainty: Heuristics and Biases. Cambridge: Cambridge University Press; 1982. p. 294-305.
11. van der Gaag LC, Renooij S, Witteman CL, Aleman BM, Taal BG. How to elicit many
probabilities. Proceedings of the Fifteenth conference on Uncertainty in artificial
intelligence; 1999: Morgan Kaufmann Publishers Inc.
12. Renooij S. Probability elicitation for belief networks: issues to consider. The Knowledge Engineering Review. 2001;16(03):255-69.
13. Clemen RT, Fischer GW, Winkler RL. Assessing Dependence: Some Experimental
Results. Management Science. 2000;46(8):1100-15.
14. Revie M, Bedford T, Walls L. Evaluation of elicitation methods to quantify Bayes linear
models. Proceedings of the Institution of Mechanical Engineers, Part O: Journal of Risk
and Reliability. 2010;224(4):322-32.
15. Fischhoff B. Eliciting knowledge for analytical representation. Systems, Man and Cybernetics, IEEE Transactions on. 1989;19(3):448-61.
16. Abbas AE, Budescu DV, Yu H-T, Haggerty R. A comparison of two probability
encoding methods: Fixed probability vs. fixed variable values. Decision Analysis.
2008;5(4):190-202.
17. Garthwaite PH, Jenkinson DJ, Rakow T, Wang DD. Comparison of fixed and variable
interval methods for eliciting subjective probability distributions. Tech. rep., University
of New South Wales, 2007.
18. Gurmankin AD, Helweg-Larsen M, Armstrong K, Kimmel SE, Volpp KG. Comparing
the standard rating scale and the magnifier scale for assessing risk perceptions. Medical
28 19. Haase N, Renkewitz F, Betsch C. The measurement of subjective probability: Evaluating
the sensitivity and accuracy of various scales. Risk Analysis. 2013;33(10):1812-28.
Acknowledgements