Hypervariable Noncoding Sequences in
Saccharomyces cerevisiae
Justin C. Fay
1and Joseph A. Benavides
Department of Genetics, Washington University School of Medicine, St. Louis, Missouri 63108 Manuscript received February 20, 2005
Accepted for publication May 12, 2005
ABSTRACT
Compared to protein-coding sequences, the evolution of noncoding sequences and the selective con-straints placed on these sequences is not well characterized. To compare the evolution of coding and noncoding sequences, we have conducted a survey for DNA polymorphism at five randomly chosen loci among a diverse collection of 81 strains ofSaccharomyces cerevisiae. Average rates of both polymorphism and divergence are 40% lower at noncoding sites and 90% lower at nonsynonymous sites in comparison to synonymous sites. Although noncoding and coding sequences show substantial variability in ratios of polymorphism to divergence, two of the loci,MLS1andPDR10, show a higher rate of polymorphism at noncoding compared to synonymous sites. The high rate of polymorphism is not accompanied by a high rate of divergence and is limited to a few small regions. These hypervariable regions include sites with three segregating bases at a single site and adjacent polymorphic sites. We show that this clustering of polymorphic sites is significantly greater than one would expect on the basis of the spacing between polymorphic fourfold degenerate sites. Although hypervariable noncoding sequences could result from selection on regulatory mutations, they could also result from transient mutational hotspots.
P
ROBABILISTIC models for the molecular evolu- ulatory sequences that have been examined in detail, mostly those acting early in Drosophila development. tion of DNA sequences have provided much insightThe genome sequencing of closely related species has into protein function and evolution (Kimura1983;Fay
provided a wealth of data on the molecular evolution andWu2003). The power of these models is derived
of both coding and noncoding sequences (Cliftenet al. in part from the genetic code, which results in the
inter-2003 ;Kelliset al.2003;Thomaset al.2003 ;Richards
spersion of sites with nonsynonymous and synonymous
et al.2005). One of the main motivations for these proj-effects on the amino acid sequence of a protein. In
ects has been the identification of conserved noncoding contrast to protein-coding sequences, we know relatively
sequences, the majority of which likely function in gene little about the function and evolution ofcis-regulatory
regulation. The identification of regulatory sequences sequences. Although some models have been developed
by their conservation between species presents a chal-(Moseset al.2004a,b), a major limitation is the paucity
lenge to understanding their evolution since not all reg-of experimentally identifiedcis-regulatory sequences.
ulatory sequences may be tightly conserved. One approach The examination of polymorphism and divergence
is to study noncoding sequences in their entirety, elimi-incis-regulatory sequences has shown that while these
nating any bias in the method used to distinguish func-sequences are constrained, substantial variation exists
tional and nonfunctional sequences. both within and between species (Jenkinset al. 1995;
The examination of polymorphism and divergence
LudwigandKreitman1995;Ludwiget al.1998;Tautz
in unannotated noncoding sequences has revealed a andNigro1998;Dermitzakiset al.2003;Moseset al.
number of regions showing a higher than expected rate 2003 ;Phinchongsakulditet al.2004). This variation
of polymorphism or divergence. The rate of polymor-can be explained under a neutral model since there are
phism but not divergence was found to be greater in the degenerate positions within transcription factor binding
5⬘-UTR and intronic sequence ofhunchbackcompared to sites (Moses et al.2003) and redundant binding sites
that in synonymous sites in adjacent hunchbackcoding within an enhancer (Ludwiget al.1998, 2000). In one
sequences (Tautz and Nigro 1998). A small 200-bp study, the DNA sequence variation was found to be
in-region upstream ofAttacin Cshowed a rate of polymor-consistent with a neutral model (Jenkinset al. 1995).
phism 10-fold higher than that found at nearby synony-However, these studies have been limited to the few
reg-mous sites (LazzaroandClark2001). Divergence and linkage disequilibrium were also much higher in the region. Examination of polymorphism and divergence
Sequence data from this article have been deposited with the EMBL/
in 136 5⬘-UTR sequences in humans revealed a higher
GenBank Data Libraries under accession nos. AY942206–AY942556.
ratio of divergence to polymorphism at 5⬘-UTR com-1Corresponding author:Department of Genetics, Box 8510, 4444
For-est Park Pkwy., St. Louis, MO 63108. E-mail: [email protected] pared to that in fourfold degenerate sites found in
RESULTS
cent coding sequences (Hellmannet al.2003). The same
result was found for noncoding sequences upstream of DNA polymorphism:DNA polymorphism was surveyed accessory gland proteins (Kohnet al.2004). Although in 81 strains ofS. cerevisiae(Table 1), constituting a total there are a number of caveats to comparing variation of 3561 bp of intergenic sequence and 3671 bp of coding in noncoding sites to that in synonymous sites, together sequence. A total of 191 polymorphic sites were found, the data suggest the selective forces acting on coding constituting 67 unique haplotypes. Four of the polymor-and noncoding sequences may be quite different. phic sites contained 3 segregating bases. Twelve inser-To compare rates of variation in coding and noncod- tions and no deletions were found. The 12 insertions ing sequences, we have surveyed DNA polymorphism at ranged in length from 1 to 3 bp. Of the 12 insertions, five randomly chosen loci in a diverse collection of 81 8 were within a string of A or T bases ranging in size strains ofSaccharomyces cerevisiae. For each locus we ex- from 4 to 11 bp, 1 was within a C
4repeat, 1 consisted of
amined 608–845 bp of coding sequence at the 5⬘end a TA
2 repeat, and 1 consisted of a TC5repeat.
of the gene and 611–804 bp of noncoding sequence, Heterozygous sites were found in 35 of the 81 strains nearly the entire 5⬘- intergenic sequence. The five loci and at 94 of the 191 polymorphic sites. A chi-square include:CCA1, a tRNA nucleotidyltransferase (Aebiet al. test for Hardy-Weinberg equilibrium identified 45 poly-1990); CYT1, which encodes cytochrome c1, a compo- morphic sites with a significant deficit of heterozygous nent of the mitrochondrial respiratory chain (Sadler strains (P ⬍ 0.001). Because most natural isolates of
et al.1984);MLS1, a malate synthase (Hartiget al.1992); S. cerevisiaeare homothallic diploids (Mortimer et al. PDR10, an ATP-binding cassette membrane pump in- 1994), haploid spores are capable of switching mating volved in pleiotropic drug resistance (BalziandGof- type and selfing. Thus, loss of heterozygosity is not un-feau1995); andZ DS2, known to function in chromatin expected. However, of the 35 strains with heterozygous silencing and cell cycle progression (Bi and Pringle sites, 10 strains were heterozygous at between 11 and 26
1996;RoyandRunge1999). Similar to variation at non- sites while the remaining 25 strains were heterozygous at synonymous sites, all five loci show lower rates of diver- 5 or fewer sites. The strains with high levels of heterozy-gence in noncoding compared to synonymous sites. Yet, gosity can be explained by a recent mating between two two genes,MLS1andPDR10, show higher rates of poly- distantly related strains or by loss of their capability to morphism at noncoding compared to synonymous sites. sporulate, a common phenotype found in commercial
wine strains (Johnstonet al.2000).
The distinction of haploid and diploid strains is im-portant for allele frequency estimates and other
popula-MATERIALS AND METHODS
tion genetic analyses. Although sporulation is a clear
Strains: Strains were obtained from a variety of sources. indication of diploidy, the absence of sporulation is un-B1–B6 were obtained from B. Dunn. I14 was collected by J. Fay.
informative since some diploids sporulate at very low
CDB and PR were obtained from Red Star Yeast (Oakland,
frequencies. To avoid this problem we analyzed only one
CA). K1–K15 were obtained from N. Goto-Yamamoto and the
NODAI culture collection. M1–M34 were provided by R. Mor- allele from each strain. For those strains containing
timer. UC1–UC10 were obtained from the University of Cali- heterozygous sites, we inferred haplotypes using the pro-fornia (Davis, CA) Department of Viticulture and Enology gram PHASE (
Stephenset al.2001) and randomly chose
culture collection. SB was bought at Whole Foods (Berkeley,
one of the two inferred haplotypes. Because 16 of the
CA). Y1–Y12 were provided by C. Kurtzman from the
Agricul-heterozygous sites are unique variable sites that are
pres-ture Research Service Culpres-ture Collection. Y JM145–Y JM1129
were obtained from J. McCusker. YPS163–YPS1009 were pro- ent in only a single strain, the random sampling resulted
vided by P. Sniegowski. in the loss of 7 polymorphic sites. All subsequent
analy-Polymorphism survey: Five genes from divergently tran- ses are based on the 184 polymorphic sites that re-scribed intergenic sequences were randomly chosen from the
mained (Table 2).
Saccharomyces Genome Database, excluding RNA genes and
Diversity at synonymous sites ranges from 0.33 to
genes of unknown function. Genes with no clear ortholog in
S. paradoxuswere not considered. For each gene, the 5⬘-inter- 1.32% at the five loci (Table 3), where diversity is
mea-genic sequence and a portion of the coding sequence were sured by the average number of pairwise differences amplified by PCR, purified, and both strands were sequenced between strains per base pair. The overall average diver-using BigDye (Perkin Elmer, Boston) termination sequencing.
sity, 0.84%, is higher than that in humans, 0.11–0.15%
Phred and Phrap were used to call bases and assemble a
contig-(Cargillet al.1999;Halushkaet al.1999), but lower
uous sequence for each strain (EwingandGreen1998). Consed
was used to visualize the sequence assemblies and to identify het- than that in Drosophila melanogaster, 1.41% (Kern and
erozygous sites. Only one of the two haplotypes inferred using Begun2005).
PHASE were used in the analyses (Stephenset al.2001). Se- The frequency spectrum is slightly skewed toward rare quences were aligned using ClustalW. Population genetic
analy-variants compared to that expected from a randomly
mat-ses were done using DNASP (Rozasand Rozas1999).
Sub-ing population of constant size under a Wright-Fisher
stitution rates between species were estimated using PAML
TABLE 1
Strains studied and their source
ID Strain Location Source Date
B1 Lalvin 71B France Vineyard (commercial) NA
B2 Levuline AL S NA Vineyard (commercial) NA
B3 Zymaflore F15 France Vineyard (commercial) NA
B4 Lalvin C Y-3079 NA Vineyard (commercial) NA
B5 Lalvin BM45 NA Vineyard (commercial) NA
B6 Zymalfore VL 3 France Vineyard (commercial) NA CDB Coˆte des Blancs Germany Vineyard (commercial) NA
I14 Italy Vineyard (soil) 2002
K1 Kyokai no. 1 Japan Sake 1906
K5 Kyokai no. 5 Japan Sake 1925
K9 Kyokai no. 9 Japan Sake 1950s
K10 Kyokai no. 10 Japan Sake 1952
K11 Awamori Japan Sake (Shochu) 1981
K12 AKU-4011 Japan Sake NA
K13 NRIC 23 Japan Sake NA
K14 NRIC 1413 Japan Sake NA
K15 NRIC 1685 Japan Sake NA
M1 Italy Vineyard 1993
M2 Italy Vineyard 1993
M3 Italy Vineyard 1993
M4 Italy Vineyard 1993
M5 Italy Vineyard 1993
M6 Italy Vineyard 1993
M7 Italy Vineyard 1993
M8 Italy Vineyard 1993
M9 Italy Vineyard 1993
M11 Italy Vineyard 1993
M12 Italy Vineyard 1993
M13 Italy Vineyard 1993
M15 Italy Vineyard 1993
M17 Italy Vineyard NA
M19 Italy Vineyard NA
M20 Italy Vineyard NA
M21 Italy Vineyard NA
M22 Italy Vineyard NA
M24 Italy Vineyard NA
M29 Italy Vineyard 1994
M30 Italy Vineyard 1994
M31 Italy Vineyard 1994
M32 Italy Vineyard NA
M33 Italy Vineyard NA
M34 Italy Vineyard NA
PR Pasteur red France Vineyard (commercial) NA
S288C California Nature (fig) 1937
SB S. boulardii Indonesia Nature (lychee fruit) NA
UC1 UCD 51 France Vineyard 1948
UC2 UCD 175 Sicily, Italy Vineyard 1953
UC4 UCD 529 Germany Vineyard Pre-1958
UC5 UCD 612 Kurashi, Japan Sake Pre-1974
UC6 UCD 765 Australia Vineyard NA
UC7 UCD 781 Switzerland Vineyard NA
UC8 UCD 820 South Africa Vineyard Pre-1988
UC9 UCD 762 Italy Vineyard Pre-1984
UC10 UCD 2120 California Vineyard 1998
Y1 NRRL y 390 Nature (mushroom) Pre-1940
Y 3 NRRL y1438 Africa Fermentation (palm wine) Pre-1946
Y4 NRRL y1532 Indonesia Nature (fruit) Pre-1947
TABLE 1 (Continued)
ID Strain Location Source Date
Y 5 NRRL y1546 West Africa Fermentation (bili wine) Pre-1947
Y6 NRRL yb1952 French Guiana NA Pre-1950
Y8 NRRL y 2411 Turkey Vineyard Pre-1957
Y9 NRRL y 5997 Indonesia Fermentation (ragi) Pre-1962 Y10 NRRL y7567 Philippines Fermentation (coconut) Pre-1973 Y12 NRRL y12633 Ivory Coast Fermentation (palm wine) Pre-1981 Y JM145 Segregant Y JM128 Missouri Clinical Pre-1989
Y JM269 Fermentation (apple juice) 1953
Y JM270 Europe Vineyard Pre-1957
Y JM280 Segregant Y JM273 United States Clinical Pre-1994
Y JM308 United States Clinical Pre-1994
Y JM320 Segregant Y JM309 United States Clinical Pre-1994 Y JM326 Segregant Y JM310 United States Clinical
Y JM339 Segregant YJM311 United States Clinical Pre-1994 Y JM421 Segregant Y JM419 United States Clinical Pre-1994
Y JM434 Europe Clinical
Y JM436 Europe Clinical Pre-1994
Y JM440 United States Clinical Pre-1994
Y JM454 United States Clinical Pre-1994
Y JM627 Segregant Y 55 France NA
Y JM1129 NRRL y-567 Fermentation (distillery) Pre-1912
YPS1000 New Jersey Nature (oak exudate) 2000
YPS1009 New Jersey Nature (oak exudate) 2000
YPS163 Pennsylvania Nature (oak exudate) 1999
ID, identification number; NA, not available.
⫺1.09 among the five genes, none of which are signifi- tion. Seven strains were from natural samples, including oak tree exudates, a mushroom, a fig, and various fruits. cant (Table 3). One hundred twenty-eight SNPs have a
minor allele frequency of⬍10% compared to the 99 ex- Eleven strains were obtained from clinical samples of immunocompromised patients. Ten strains were obtained pected under a Wright-Fisher model (Watterson1975).
Four of the 12 insertions, all found within the promoter from sake fermentations. Seven strains were obtained from fermentations excluding wine and sake. Two strains ofPDR10, have a minor allele frequency of ⬎10%.
Population structure:We examined population struc- were from an unknown source.
Significant population differentiation was found both ture stratified by the source from which each strain was
obtained and by continent from which each strain was among sample sources and among sample locations (Table 3,P⬍0.001 for all genes). However, the sources isolated (Table 1). Forty-two strains were from Europe,
14 from Asia, 15 from America, 4 from Africa, and 6 are and locations from which the strains were isolated are correlated with one another. Most European strains of unknown origin. Forty-four strains were isolated from
grapes, wine fermentations, or commercial wine produc- were obtained from vineyards, most North American
TABLE 2
Polymorphic sites identified in five genes
Surveyed sites Polymorphic sites
Gene Sample size Noncoding Coding S ynonymous NC N S I
CC A1 73 721 788 179.4 20 1 11 2
CY T1 67 611 608 149.1 15 1 10 2
ML S1 77 804 845 186.5 41 4 12 0
PDR10 75 730 758 177.4 26 7 6 8
ZDS2 59 695 672 140.7 21 5 8 0
Total 81 3561 3671 833.1 123 18 47 12
TABLE 3
Population sample statistics from five genes
(⫻100) Kst
Gene NC N S Ta jima’sD Fu and Li’sD Source Location
CC A1 0.39 0.03 0.76 ⫺1.08 ⫺1.54 0.28 0.28
CY T1 0.25 0.01 1.32 ⫺1.09 0.51 0.11 0.08
MLS1 0.91 0.10 0.80 ⫺0.60 ⫺1.51 0.34 0.25
PDR10 0.55 0.15 0.33 ⫺1.05 ⫺2.46 0.46 0.37
ZDS2 0.51 0.16 0.99 ⫺0.69 0.37 0.23 0.20
Average 0.521 0.091 0.838 ⫺0.90 ⫺0.93 0.28 0.24
, the average number of pairwise differences between strains per base pair.Kst(Hudsonet al.1992) was measured by source and location as designated in Table 1.
strains were obtained from clinical samples, and most pected given the population structure found inS. cere-visiaeand its ability to reproduce asexually.
Asian strains were obtained from fermentation of
sub-There is ample evidence of recombination within each strates other than grapes.
of the five loci. Each locus shows evidence of between Different patterns of variation were found among
dif-two and five recombination events by the four-gamete ferent groups of strains. A significant reduction in
diver-test (Table 4). The absolute value of D⬘within a locus is sity is found within strains from wine and sake compared
negatively correlated with distance between polymor-with diversity polymor-within other groups and total diversity
(Ta-phic sites (P⫽ 5⫻10⫺5), but not for the randomized
ble 4). In addition to a reduction in diversity, the
vine-data (Table 6). This could be due to gene conversion yard strains also show a greater proportion of rare
vari-or recombination between individuals from the same ants, as measured by Ta jima’sD, compared to that in
subpopulation but not from different subpopulations. other groups and to the total (Table 4).
The recombination mutation ratio, estimated from the
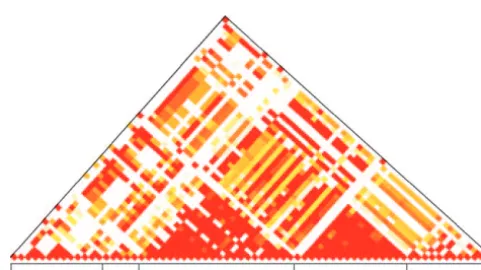
Linkage disequilibrium and recombination:There are
ratio ofwfrom synonymous sites over 4Nc, ranges from
significant levels of linkage disequilibrium between
un-1.4 to 2.7 and the average is 2.1 (Table 7). The mutation linked genes (Figure 1). Linkage disequilibrium was
mea-rate has been estimated fromC AN1andSU P3at 2.25⫻ sured by the average absolute value ofD⬘for all
polymor-10⫺10per base pair per generation (Drake1991). Given
phic sites with a minor allele frequency of ⬎10% among
that 82% of spontaneous mutations are single-base sub-the 45 strains for which sub-there was no missing data
(Ta-stitutions (Kanget al.1992), the point mutation rate is ble 5). The average absolute value ofD⬘from all pairwise
1.84⫻ 10⫺10. The genomic average rate of
recombina-comparisons between loci ranges from 0.57 to 0.82. All
tion is 0.34 cM/kbp or 6.8⫻10⫺6recombination events
pairwise comparisons within loci range from 0.71 (ZDS2)
per base pair (Cherryet al.1997). Similar to a previous to 0.98 (PDR10). The expected absolute value ofD⬘for
study (Jensen et al. 2001), the laboratory estimate of unlinked sites is 0.26 and was obtained by resampling
the ratio of recombination events to mutation events is of polymorphic sites, keeping the allele frequencies
con-four orders of magnitude greater than that inferred stant. This high rate of linkage disequilibrium can be
ex-TABLE 4 Diversity within groups
Sourcea Strains (⫻100)b R
m TD
Sake wine 9 0.10 (0.01) 3 0.839 Grape wine 23 0.14 (0.03) 5 ⫺1.57 Clinical 4 0.42 (0.10) 2 0.311 Nature 5 0.50 (0.08) 3 ⫺0.31 Fermentation 4 0.55 (0.15) 0 0.563 Total 45 0.42 (0.03) 31 ⫺0.57
, the average number of pairwise differences between strains,
per base pair;Rm, the minimum number of recombination Figure1.—Linkage disequilibrium measured by |D⬘|. Only pairs with |D⬘|⬎0.5 and a significant association are shown events; TD, Tajima’sD- statistic.
aOnly strains without missing data are used. (Fisher’s exact test,P⬍0.05). The color indicates |D⬘| that
ranges from 0.5 (yellow) to 1.0 (red).
TABLE 7 TABLE 5
Average pairwise linkage disequilibrium Population sample statistics from 45 strains with data from all five genes
Gene No. sites CCA1 CYT1 MLS1 PDR10 ZDS2
Gene W(⫻100) R(⫻100) W/R
CCA1 11 0.75 0.73 0.76 0.82 0.65
CYT1 4 0.36 0.88 0.59 0.65 0.58 CCA1 1.28 0.48 2.66
MLS1 20 0.33 0.28 0.94 0.75 0.69 CYT1 1.53 1.04 1.48
PDR10 14 0.27 0.23 0.23 0.98 0.57 MLS1 0.98 0.36 2.73
ZDS2 10 0.34 0.33 0.30 0.26 0.71 PDR10 0.65 0.27 2.40
ZDS2 1.30 0.94 1.38
Linkage disequilibrium (LD) within a locus is shown on the Average 1.15 0.62 2.13 diagonal, LD between loci is shown above the diagonal, LD
between randomized data is shown below the diagonal. Link- W, a measure of variation based on the number of segregat-age disequilibrium was measured by the absolute value ofD⬘ ing sites (Watterson1975);R, a measure of recombination for sites with a minor allele frequency of⬎10%. Only the 45 (Hudson1987).
strains with complete data for all five genes were used.
With the exception ofCY T1, the genes examined in this from the polymorphism data. This can be explained by
study have a synonymous substitution rate nearly identi-higher rates of asexual compared to sexual
reproduc-cal to the average rate and do not have high levels of tion as well as by mating-type switching, which enables
codon bias. a cell to mate with its forebear following meiosis.
The pattern of substitutions at synonymous sites is
in-Selection on synonymous sites: The detection of
se-dicative of whether synonymous sites are at mutation-lection on nonsynonymous or noncoding sites is greatly
selection balance. If they are not, the assumption that facilitated if synonymous sites are effectively neutral. In
synonymous sites are effectively neutral is violated. In S. cerevisiae, there is ample evidence that synonymous
Drosophila, the relationship between codon bias and sites are not neutral (BennetzenandHall1982;
Bul-synonymous substitution rate is very weak if present
mer1987). However, not all genes and not all synonymous
(Dunn et al. 2001; Bierne and Eyre-Walker 2003). sites may be influenced by selection. For the purposes of
de-There is, however, a clear difference in the pattern of tecting selection on nonsynonymous or noncoding sites,
preferred and unpreferred synonymous substitutions synonymous sites may be considered effectively neutral
betweenD. melanogasterand D. similans(Akashi1996; if their substitution rate and pattern of preferred and
Begun2001). To determine whether patterns of synony-unpreferred synonymous changes are no different from
mous substitutions inS. cerevisiaeshow a similar nonequi-those in neutral sites.
To determine which genes inS. cerevisiae are clearly affected by selection on synonymous sites, we compared the synonymous substitution rate to codon bias (Fig-ure 2). From 1538 genes, there is a clear reduction in the synonymous substitution rate for genes with high codon bias or a small effective number of codons (ENC). However, most genes have a synonymous substitution rate that is not correlated with codon bias. We arbitrar-ily classified genes as high and low bias, using an ENC cutoff of 45. The 1331 high-bias genes have an average synonymous substitution rate of 0.87 and show no cor-relation between codon bias and synonymous substi-tution rate. In contrast, the low-bias genes have an aver-age synonymous substitution rate of 0.60 and show a significant correlation between codon bias and synony-mous substitution rate (Pearson’sr⫽0.74,P⬍10⫺15).
TABLE 6 Figure 2.—Synonymous substitution rate among S.
cere-visiae,S. paradoxus, andS. mikataein relation to the average
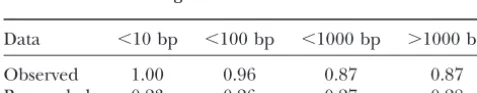
co-Average absolute value ofDⴕ
don bias from the three species, as measured by ENC (Wright 1990). The dashed line shows the arbitrary cutoff used to dis-Data ⬍10 bp ⬍100 bp ⬍1000 bp ⬎1000 bp
tinguish high- and low-biased genes. The two solid lines are the least-squares fit of a regression of codon bias and synonymous Observed 1.00 0.96 0.87 0.87
substitution rate for the genes showing high and low codon Resampled 0.23 0.26 0.27 0.28
TABLE 8
Preferred and unpreferred synonymous polymorphism and divergence
Polymorphic changes Fixed differences
Gene P →P P →U U →P U →U P →P P →U U →P U →U
CC A1 2 3 2 2 3 5 6 5
CY T1 2 3 2 1 5 4 2 3
ML S1 3 3 4 0 9 8 8 2
PDR10 1 0 2 1 3 11 11 5
ZDS2 1 1 2 4 1 5 6 6
Total 9 10 12 8 21 33 33 21
PandU, preferred and unpreferred codons, respectively;e.g.,P →Pis a synonymous substitution from a preferred to a different preferred codon.
librium status, we compared the number of unpreferred combineddN/dSratios are 0.09, 0.10, and 0.09 for the
branch leading toS. cerevisiae,S. paradoxus, andS. mika-and preferred changes along the lineage leading to
S. cerevisiaeand within strains ofS. cerevisiae (Table 8). tae, respectively.
The ratio of noncoding to synonymous substitutions Both polymorphic and fixed synonymous changes show
an equal number of preferred to unpreferred (P →U) (dNC/dS) measures the selective constraint on
noncod-ing sequences, assumnoncod-ing the mutation rate is the same and unpreferred to preferred (U →P) changes.
The data show that the synonymous substitution rate across the coding and noncoding sequences. All of the promoters show considerable levels of functional con-and pattern of synonymous substitution in four of the
five genes are consistent with those expected for neutral straint. The combineddNC/dSratios are 0.53, 0.49, and
0.49 for the branch leading toS. cerevisiae,S. paradoxus, sites.CYT1has a reduced rate of synonymous
substitu-tion, but, interestingly, has the highest rate of synony- andS. mikatae, respectively. This implies that nearly one-half of intergenic sequences are functionally constrained, mous-site diversity (Table 3). The HKA test (Hudson
et al.1987) reveals a lower ratio of synonymous polymor- only slightly⬎0.52, the mediandNC/dSfrom 2098 genes
(Donigeret al.2005). phism to divergence inCYT1compared to that inPDR10
(P⫽0.048), but not in comparison to that in any of the Under the same assumptions used to test for branch-specificdN/dSratios, the ratio of nonsynonymous- to
syn-other three genes. After correction for multiple
compar-isons this difference is not significant. onymous-site polymorphism (pN/pS) should equaldN/dS.
This comparison is the basis for the McDonald-Kreitman
Selection on nonsynonymous and noncoding sites:
The ratio of nonsynonymous to synonymous substitu- (MK) test (McDonald and Kreitman 1991), which compares polymorphic sites and fixed differences rather tions (dN/dS) measures the selective constraint on a
pro-tein. In the absence of positive selection or any changes than estimates of substitution rates. The averagepN/pS
ratio, 0.11, is nearly identical to that of divergence, 0.09 in selective constraint, thedN/dSratio should be constant
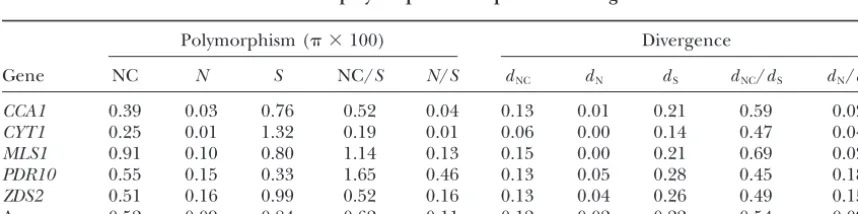
across lineages and should not be greater than one (Fay (Table 9). Similarly, the averagepNC/pSratio of diversity,
0.62, is similar to that of divergence, 0.54 (Table 9). andWu2001). None of the five proteins show
signifi-cant differences in the levels of constraint among the The comparison of N/S ratios from polymorphism and divergence can be misleading if positive selection lineages leading toS. cerevisiae,S. paradoxus, andS.
mika-tae(likelihood-ratio test using PAML, P ⬎ 0.05). The increases theN/Sratio of divergence and negative
selec-TABLE 9
Rates of DNA polymorphism compared to divergence
Polymorphism ( ⫻100) Divergence
Gene NC N S NC/S N/S dNC dN dS dNC/dS dN/dS
CCA1 0.39 0.03 0.76 0.52 0.04 0.13 0.01 0.21 0.59 0.02
CYT1 0.25 0.01 1.32 0.19 0.01 0.06 0.00 0.14 0.47 0.04
MLS1 0.91 0.10 0.80 1.14 0.13 0.15 0.00 0.21 0.69 0.02
PDR10 0.55 0.15 0.33 1.65 0.46 0.13 0.05 0.28 0.45 0.18
ZDS2 0.51 0.16 0.99 0.52 0.16 0.13 0.04 0.26 0.49 0.15
Average 0.52 0.09 0.84 0.62 0.11 0.12 0.02 0.22 0.54 0.09
tion increases theN/Sratio of polymorphism (Fayet al. 2001). The effect of negative selection on theN/Sratio of polymorphism can be examined by comparing low-frequency to common polymorphism. Both Drosophila (Fayet al.2002) and humans (Fayet al.2001) show an elevated N/Sratio of rare compared to common poly-morphism, indicative of deleterious mutations segregat-ing at low frequency in the population. InS. cerevisiae, the ratio of the rate of nonsynonymous and synonymous polymorphism that is rare, 0.12, is nearly identical to the rate of common polymorphism, 0.11. The ratio of NC/Sfrom rare polymorphism, 0.60, is also very similar
to that of common polymorphism, 0.62. This can be Figure3.—Sliding window of polymorphism compared to
divergence for noncoding and synonymous sites. Divergence
explained if most deleterious mutations are recessive
(red) is betweenS. cerevisiaeandS. paradoxusas measured by
and removed from the population following
mating-the Jukes-Cantor model (JukesandCantor1969), and
poly-type switching and selfing.
morphism (black) is measured by diversity among strains
with-The overall pattern of polymorphism and divergence out missing data. The range of synonymous-site divergence indicates selective constraint along the lineage leading (gray) and polymorphism (light gray) is shown as shaded
re-gions. The plot is separated into six regions labeled below
to S. cerevisiae is similar to that found among extant
the abscissa. The first five regions are from the noncoding
populations. However, natural selection may influence
sequences 5⬘of each gene. The last region (Syn) is the
con-polymorphism and divergence at individual genes or
catenation of fourfold degenerate synonymous sites from the
regions without affecting overall patterns of polymor- coding sequences of all five genes. phism and divergence. Because of the paucity of
nonsyn-onymous polymorphism and divergence, we compared
variation only in noncoding to synonymous sites. The If locus-specific differences in the ratio of noncoding polymorphism to divergence have occurred by chance, NC/Sratio of diversity is larger than that of divergence
forML S1,PDR10, andZ DS2and lower than that of di- the ratio of polymorphism to divergence should be relatively constant across a sliding window of each non-vergence for CC A1 and CY T1. In addition, the NC/S
ratio of polymorphism is greater than unity for both coding sequence. Alternatively, if natural selection has increased or decreased the rate of noncoding polymor-ML S1 andPDR10.
Two tests can be used to assess the significance of the phism or divergence, the effect of selection may well be localized to a portion of the noncoding region. To difference between noncoding and synonymous
poly-morphism and divergence. The MK test can be applied examine diversity in the rate of noncoding polymor-phism and divergence, we plotted a sliding window of to the number of polymorphic and fixed noncoding
and synonymous changes (McDonald andKreitman diversity and substitution rate across the noncoding re-gion from each gene as well as across the concatenated 1991). However, the MK test assumes the mutation rate
in the two regions is the same, the coalescence time for fourfold degenerate synonymous sites from all of the genes (Figure 3). The twoy- axes in Figure 3 are scaled the two regions is the same, and the number of fixed
differences between species can be reliably determined. such that the average rate of synonymous polymorphism is equal to the average rate of synonymous divergence. The first two assumptions are reasonable when the MK
test is applied to nonsynonymous and synonymous Noncoding divergence is more variable and on average lower than synonymous-site divergence, as expected. changes. However, the latter assumption is not justified
when divergence is ⬎5–10% because of multiple hits Noncoding polymorphism is also much more variable than synonymous polymorphism, but in four different (Templeton1996). The HKA test can also be applied
to noncoding- and synonymous-site polymorphism and regions is greater than the range found at synonymous sites, as shown in Figure 3 (light gray area). Two of the divergence (Hudsonet al.1987). The HKA test
explic-itly accounts for any differences in mutation rates or noncoding hypervariable regions lie upstream ofM LS1 and the other two are upstream of PDR10 and Z DS2. coalescence times between the two regions, but, like the
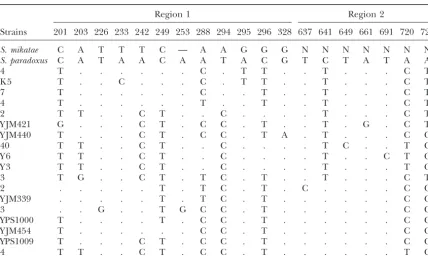
MK test, does not account for multiple hits. Despite The two hypervariable regions upstream ofML S1 con-tain 2 of the 4 sites with 3 segregating bases and 5 these concerns, we applied an MK and an HKA test to
noncoding and synonymous polymorphism and diver- additional segregating sites that are within 3 bases of one another (Table 10). The hypervariable region up-gence. For the MK test, the number of fixed differences
along the lineage leading to S. cerevisiaewas estimated stream ofPDR10has 10 segregating sites that are within 7 bp of another segregating site (Table 11).
by the maximum-likelihood estimate of the synonymous
and noncoding substitution rate multiplied by the num- To determine whether there are regions with more noncoding polymorphism than can be explained by a ber of synonymous and noncoding sites. Neither the
TABLE 10
Haplotypes from two hypervariable regions upstrem ofMLS1
Region 1 Region 2
Strains 201 203 226 233 242 249 253 288 294 295 296 328 637 641 649 661 691 720 721
S. mikatae C A T T T C — A A G G G N N N N N N N
S. paradoxus C A T A A C A A T A C G T C T A T A A
4 T . . . C . T T . . T . . . C T
K 5 T . . C . . . C . T T . . T . . . C T
7 T . . . C . . T . . T . . . C T
4 T . . . T . . T . . T . . . C T
2 T T . . C T . . C . . . . T . . . C T
Y JM421 G . . . C T . C C . T . . T . G . C T
Y JM440 T . . . C T . C C . T A . T . . . C C
40 T T . . C T . . C . . . . T C . . T C
Y 6 T T . . C T . . C . . . . T . . C T C
Y 3 T T . . C T . . C . . . . T . . . T C
3 T G . . C T . T C . T . . T . . . C T
2 . . . T . T C . T . C . . . . C C
Y JM339 . . . T . T C . T . . . C C
3 . . G . . T G C C . T . . . C C
YPS1000 T . . . . T . C C . T . . . C C
Y JM454 T . . . C C . T . . . C C
YPS1009 T . . . C T . C C . T . . . C C
4 T T . . C T . C C . T . . . T C
Nucleotide positions are shown in two regions upstream ofMLS1. The strains column lists the number of strains with the haplotype shown on the right or the name of the strain if the haplotype is unique.
regating sites is that it has well-defined statistical proper- metrically distributed with parameter p, which can be estimated from the number of polymorphic sites per ties compared to a sliding-window analysis, which is
dependent on the window length and step size. Assum- base pair.
If there is an increase in the rate of polymorphism ing a constant rate of polymorphism, p, and given a
polymorphic site, the probability ofdsites until the next within a portion of a noncoding region, the distance between segregating sites should be less than that ex-polymorphism is
pected under a neutral model. The expected distances p(1⫺ p)(d⫺1).
were calculated using the geometric distribution with a rate parameter,p, estimated from concatenated four-Thus, the distance between polymorphic sites is
geo-TABLE 11
Haplotypes from the hypervariable region upstream ofPDR10
Nucleotide position
Strains 436 469 472 490 496 533 538 545 577 582 586 605
S. mikatae — C A — T — — — G T T T
S. paradoxus — G A T T G T G A A T T
47 A . . . A . T G .
Y1 A . . . A . . A . T G .
B6 A . . . . C . A . T G .
I14 G . . . A . T G .
Y JM436 G . . . C . . T G C
YPS1009 G . . . C . T T G C
Y 3 G A C . . . C . . T G .
15 G . C . . . C . . T A C
K13 G . C . . . C . . . A C
5 G . C . . . C . . T G C
YPS163 G . . C . . C . . T G .
TABLE 13 TABLE 12
Distance between consecutive segregating sites Distribution of SNPs in conserved sequences
Category Unconserved Conserved Distance
Total 92 91
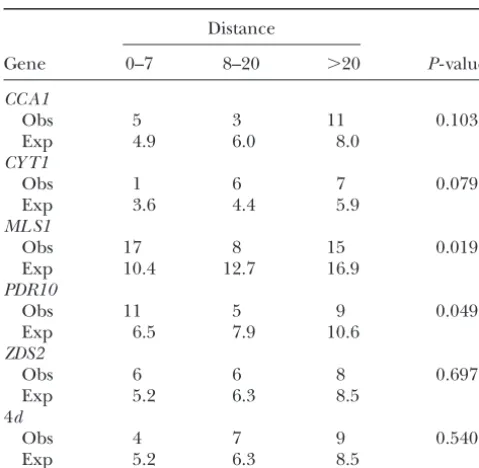
Gene 0–7 8–20 ⬎20 P- value
Noncoding 64 54
CC A1 nd 3 12
Obs 5 3 11 0.103 4d 14 8
Exp 4.9 6.0 8.0 ML S1 12 10
CY T1 PDR10 6 2
Obs 1 6 7 0.079
Conserved sites have the same base inS. mikatae,S.
para-Exp 3.6 4.4 5.9
doxus, andS. cerevisiae.MLS1andPDR10are the SNPs in hyper-ML S1
variable noncoding sequences. nd, nondegenerate sites; 4d,
Obs 17 8 15 0.019
fourfold degenerate sites.
Exp 10.4 12.7 16.9
PDR10
Obs 11 5 9 0.049
Exp 6.5 7.9 10.6 phic sites in positions that are not conserved. Although
ZDS2 a little less than half of the noncoding polymorphic sites
Obs 6 6 8 0.697 are found in conserved positions, the same proportion
Exp 5.2 6.3 8.5
of fourfold degenerate sites (4d) are found in positions
4d
conserved across species (Table 13).
Obs 4 7 9 0.540
Previous studies have found reduced levels of
varia-Exp 5.2 6.3 8.5
tion in experimentally identified functional noncoding
Distance is the number of base pairs to the next polymorphic sequences (LudwigandKreitman1995;Ludwiget al. site. 4dis concatenated fourfold degenerate sites from all five
1998;TautzandNigro1998;Dermitzakiset al.2003;
genes.P- value is from aG- test with Williams’ correction. Obs,
Phinchongsakulditet al.2004), but high levels of
vari-observed; Exp, expected.
ation in unannotated noncoding sequences (Tautzand
Nigro 1998; Lazzaro and Clark 2001). Of the five intergenic sequences, the promoters of C YT1, ML S1, fold degenerate synonymous sites. To test the
goodness-andCOQ5, adjacent toZ DS2, have been identified by of-fit between the observed and expected distance values
deletion constructs. For C YT1, the minimal promoter we binned the distance between segregating sites in
was delineated to a 209-bp sequence 351 bp upstream three classes, 0–7 bp, 8–20 bp, and⬎20 bp, to ensure the
ofC YT1(Oechsneret al.1992). ForML S1, the minimal expected number of sites in each category is greater
promoter was delineated to a 190-bp sequence, 474 bp than five. Synonymous sites provide a good fit to the
upstream of MLS1 (Caspary et al. 1997). For COQ5, geometric distribution using aG- test with Williams’
cor-functional promoter elements were found in a 26-bp rection (Sokal and Rohlf 1995) (Table 12). Of the
and a 90-bp sequence starting 400 bp upstream ofCOQ5 five noncoding regions, onlyML S1andPDR10show a
(Hagermanet al.2002). ForCY T1, the rate of polymor-significant deviation from a geometric distribution
us-phism in the experimentally defined promoter, 6/209, ing the rate parameter from synonymous sites (P ⫽
is much less than the total rate found in all synonymous 0.019 andP⫽0.049, respectively). AlthoughML S1and
sites, 47/833 (Table 2). In contrast, the experimentally PDR10 are not individually significant after correction
defined promoter ofML S1has a rate of polymorphism for multiple tests, the combined probability of all five
more than twice that of synonymous sites, 14/190, as it genes is significant (P⫽0.007, Fisher’s test of combined
encompasses one of the hypervariable regions identified probabilities) and the sum of the data from all five genes
by the sliding-window analyses (Figure 4). While the is also significant (P⫽0.024,G- test). Furthermore, the
rate of polymorphism for one of the twoCOQ5promoter G- test is conservative because the overall rate of
non-regions is low, 1/90, the other has a rate of 3/26, four coding polymorphism is less than that of synonymous
times that of synonymous sites (Figure 4). Thus, while polymorphism and so the expected distance between
seg-polymorphic sites are not overpresented in conserved regating noncoding sites should be greater than the
dis-positions (Table 13), they tend to be found in experi-tance between concatenated fourfold degenerate sites.
mentally defined promoter sequences (Figure 4). The significant clustering of polymorphic sites in
non-coding regions suggests that there may be positive or balancing selection on functional noncoding sequences.
DISCUSSION
To determine whether polymorphic sites occur in
polymor-Figure4.—Multiple sequence alignment of experimentally defined promoters (gray) up-stream ofMLS1 (A) andZDS2(B). Polymor-phic sites are shown in green and transcription factor-binding sites designated in the original study are shown in red. Arrows show sites with three segregating bases.
and their evolution. To address this issue we have com- PDR10noncoding sequences showed any significant de-parture from neutrality by any of the statistical tests of pared DNA sequence variation found within and
be-tween Saccharomyces species in noncoding and coding heterogeneity implemented in DNA Slider (McDonald
1998). It is likely that the power of these tests is limited sequences. The main result is the observation of
non-coding sequences with higher than expected rates of when rates of divergence are high, since at high diver-gence the number of runs should become relatively polymorphism. A secondary finding is extensive linkage
disequilibrium, even between unlinked loci. Population constant for any distribution of polymorphic sites. There are few explanations for the clustering of poly-subdivision, possibly caused by two separate
domestica-tion events (FayandBenavides2005), is likely a major morphic noncoding sites upstream ofML S1andPDR10. Our evidence comes from comparing the distance be-contributor to linkage disequilibrium.
On average, rates of DNA polymorphism and diver- tween noncoding polymorphic sites to synonymous polymorphic sites. Thus, a number of factors that affect gence in noncoding sites areⵑ40% lower than those
at synonymous sites (Table 9). Yet four small regions polymorphism at synonymous sites should be consid-ered. First, a reduced mutation rate at synonymous sites within noncoding sequences show rates of
polymor-phism greater than those at synonymous sites (Figure 3). should cause a decrease in diversity and an increase in the distance between polymorphic synonymous sites. The clustering of polymorphic sites upstream ofML S1
andPDR10 is significantly greater than that expected However, divergence at synonymous sites is greater than that found at noncoding sites. Second, selection could on the basis of fourfold degenerate sites.
For a variety of reasons, commonly used statistical tests result in a reduction in diversity at synonymous but not at noncoding sites, thereby increasing the distance be-of neutrality show no significant results for theML S1
andPDR10promoter. Neither an MK test nor an HKA tween synonymous polymorphic sites. With the excep-tion ofPDR10, there is no evidence for a reduction in test showed any significant differences between rates of
polymorphism and divergence at noncoding and synon- synonymous-site diversity across the five genes (Table 3). Even if diversity at synonymous sites withinPDR10were ymous sites. The lack of significance can be explained
since both tests measure differences between the rates reduced, the statistical test for clustering of noncoding sites relies on the combined fourfold degenerate data of polymorphism and divergence between two classes of
sites, averaged over the entire region, whereas the hyper- from all five genes. Finally, some synonymous sites may be functionally constrained, thereby lowering rates of variable sequences are limited to small regions within
the intergenic sequences. The runs test is designed to polymorphism and the distance between polymorphic sites. Only CC A1 shows evidence for significant levels detect heterogeneity in the ratio of polymorphism to
di-vergence since polymorphic sites and fixed differences of constraint on synonymous sites (Figure 2). Yet instead of showing a reduced rate of polymorphism,CC A1has are expected to be evenly interspersed between one
at the Genome and Sequencing Center for use of an ABI 3730xl
se-Hypervariable noncoding sequences could also be
quencer; and two anonymous reviewers for useful comments on the
caused by mutation hotspots in noncoding sequences.
interpretation of the data.
Yet hotspots should increase both polymorphism and divergence, and only polymorphism appears inflated. Furthermore, there is little evidence for large-scale
mu-LITERATURE CITED
tational heterogeneity across the S. cerevisiae genome
Aebi, M., G. Kirchner, J. Y. Chen, U. Vijayraghavan, A. Jacobson (Chin et al. 2005). If mutational hotspots are present
et al., 1990 Isolation of a temperature-sensitive mutant with an
but not at a fixed location, polymorphic sites should altered tRNA nucleotidyltransferase and cloning of the gene
en-coding tRNA nucleotidyltransferase in the yeast Saccharomyces
cluster but divergence should average to a uniform
dis-cerevisiae. J. Biol. Chem.265:16216–16220.
tribution over a long enough period of time. Although
Akashi, H., 1996 Molecular evolution betweenDrosophila
melanogas-transient mutational hotspots provide a rather tenuous terandD. simulans: reduced codon bias, faster rates of amino
acid substitution, and larger proteins inD. melanogaster. Genetics
explanation for the data, two mechanisms are possible.
144:1297–1307.
First, a polymorphic site may increase the mutation rate
Balzi, E., and A. Goffeau, 1995 Yeast multidrug resistance: the
at nearby bases. Second, recombination hotspots have PDR network. J. Bioenerg. Biomembr.27:71–76.
Begun, D. J., 2001 The frequency distribution of nucleotide
varia-been found to be transient (Ptaket al.2005;Winckler
tion in Drosophila simulans. Mol. Biol. Evol.18:1343–1352. et al.2005). If recombination hotspots are transient in
Bennetzen, J. L., andB. D. Hall, 1982 Codon selection in yeast.
yeast and mutagenic, or repair deficient, they may result J. Biol. Chem.257:3026–3031.
Bi, E., andJ. R. Pringle, 1996 ZDS1 and ZDS2, genes whose
prod-in transient mutational hotspots. If this is the case,
hyper-ucts may regulate Cdc42p in Saccharomyces cerevisiae. Mol. Cell.
variable noncoding sequences should be observed across
Biol.16:5264–5275.
the genome. Little or no clustering would be observed Bierne, N., andA. Eyre-Walker, 2003 The problem of counting
sites in the estimation of the synonymous and nonsynonymous
in coding sequences since most mutations would be
substitution rates: implications for the correlation between the
removed by negative selection.
synonymous substitution rate and codon usage bias. Genetics
Selection on noncoding sites can both increase and 165:1587–1597.
Bulmer, M., 1987 Coevolution of codon usage and transfer RNA
decrease the distance between polymorphic sites. Both
abundance. Nature325:728–730.
changes in selective constraint and the presence of
Cargill, M., D. Altshuler, J. Ireland, P. Sklar, K. Ardlieet al.,
deleterious mutations can influence the ratio of non- 1999 Characterization of single-nucleotide polymorphisms in
coding regions of human genes. Nat. Genet.22:231–238.
coding- to synonymous-site diversity. Yet, the distance
Caspary, F., A. HartigandH. J. Schuller, 1997 Constitutive and
between noncoding polymorphic sites should be at the
carbon source-responsive promoter elements are involved in the
least equal to that found at synonymous sites. Positive regulated expression of the Saccharomyces cerevisiae malate
syn-thase gene MLS1. Mol. Gen. Genet.255:619–627.
selection, diversifying selection, and balancing selection
Cherry, J. M., C. Ball, S. Weng, G. Juvik, R. Schmidtet al., 1997
can all increase the rate of polymorphism at noncoding
Genetic and physical maps of Saccharomyces cerevisiae. Nature
sites above that of synonymous sites. Although positive 387:67–73.
Chin, C. S., J. H. ChuangandH. Li, 2005 Genome-wide regulatory
selection predicts very short sojourn times for variants
complexity in yeast promoters: separation of functionally
con-under selection, population subdivision would inhibit
served and neutral sequence. Genome Res.15:205–213.
the rapid spread of a selected allele through the entire Cliften, P., P. Sudarsanam, A. Desikan, L. Fulton, B. Fultonet al.,
2003 Finding functional features in Saccharomyces genomes
species (Slatkin andWiehe 1998). Alternatively,
bal-by phylogenetic footprinting. Science301:71–76.
ancing or diversifying selection could account for the
Dermitzakis, E. T., C. M. BergmanandA. G. Clark, 2003 Tracing
excess of noncoding compared to synonymous polymor- the evolutionary history of Drosophila regulatory regions with
models that identify transcription factor binding sites. Mol. Biol.
phism and predicts elevated rates of polymorphism but
Evol.20:703–714.
not of divergence. Although there is no clear way to
Doniger, S., J. HuhandJ. C. Fay, 2005 Identification of functional
confidently distinguish these models of selection, one transcription factor binding sites using closely related
Saccharo-myces species. Genome Res.15:701–709.
pertinent observation is that the ratio of NC/Sis greater
Drake, J. W., 1991 A constant rate of spontaneous mutation in
DNA-than one within some but not all groups of strains
cate-based microbes. Proc. Natl. Acad. Sci. USA88:7160–7164.
gorized by source of isolation. Dunn, K. A., J. P. BielawskiandZ. Yang, 2001 Substitution rates
in Drosophila nuclear genes: implications for translational
selec-In conclusion, there are two plausible models that
tion. Genetics157:295–305.
can explain the hypervariable noncoding sequences.
Ewing, B., andP. Green, 1998 Base-calling of automated sequencer
First, hypervariable regions could be caused by transient traces using phred. II. Error probabilities. Genome Res.8:186–194. mutational hotspots. Second, hypervariable regions could Fay, J. C., andJ. A. Benavides, 2005 Evidence for domesticated and wild populations of Saccharomyces cerevisiae. PLoS Genet.1:e5.
be caused by some form of natural selection acting on
Fay, J. C., andC.-I Wu, 2001 The neutral theory in the genomic
mutations that affect gene expression. With hypervari- era. Curr. Opin. Genet. Dev.11:642–646.
able regions found in three of the five genes, only two Fay, J. C., andC.-I Wu, 2003 Sequence divergence, functional con-straint, and selection in protein evolution. Annu. Rev. Genomics
showing significance, it is difficult to determine whether
Hum. Genet.4:213–235.
the hypervariable sites are common, and more likely the Fay, J. C., G. J. WyckoffandC.-I Wu, 2001 Positive and negative result of a mutational explanation, or rare, and more selection on the human genome. Genetics158:1227–1234.
Fay, J. C., G. J. WyckoffandC.-I Wu, 2002 Testing the neutral
likely the result of natural selection.
theory of molecular evolution with genomic data from Drosoph-We thank B. Dunn, N. Goto-Yamamoto, R. Mortimer, C. Kurtzman, ila. Nature415:1024–1026.
ral fermentation of grape musts. Yeast10:1543–1552. 36:485–490.
Halushka, M. K., J. B. Fan, K. Bentley, L. Hsie, N. Shenet al., 1999 Moses, A. M., D. Y. Chiang, M. Kellis, E. S. LanderandM. B. Eisen, 2003 Position specific variation in the rate of evolution in tran-Patterns of single-nucleotide polymorphisms in candidate genes
for blood-pressure homeostasis. Nat. Genet.22:239–247. scription factor binding sites. BMC Evol. Biol.3:19.
Moses, A. M., D. Y. ChiangandM. B. Eisen, 2004a Phylogenetic Hartig, A., M. M. Simon, T. Schuster, J. R. Daugherty, H. S.
Yooet al., 1992 Differentially regulated malate synthase genes motif detection by expectation-maximization on evolutionary mix-tures. Pac. Symp. Biocomput., 324–335.
participate in carbon and nitrogen metabolism of S. cerevisiae.
Nucleic Acids Res.20:5677–5686. Moses, A. M., D. Y. Chiang, D. A. Pollard, V. N. IyerandM. B. Eisen, 2004b MONKEY: identifying conserved transcription-factor Hellmann, I., S. Zollner, W. Enard, I. Ebersberger, B. Nickelet al.,
2003 Selection on human genes as revealed by comparisons to binding sites in multiple alignments using a binding site-specific evolutionary model. Genome Biol.5:R98.
chimpanzee cDNA. Genome Res.13:831–837.
Hudson, R. R., 1987 Estimating the recombination parameter of a Oechsner, U., H. Hermann, A. Zollner, A. HaidandW. Bandlow, 1992 Expression of yeast cytochrome c1 is controlled at the finite population model without selection. Genet. Res.50:245–250.
Hudson, R. R., M. KreitmanandM. Aguade, 1987 A test of neutral transcriptional level by glucose, oxygen and haem. Mol. Gen. Genet. 232:447–459.
molecular evolution based on nucleotide data. Genetics116:153–159.
Hudson, R. R., D. D. BoosandN. L. Kaplan, 1992 A statistical test Phinchongsakuldit, J., S. MacarthurandJ. F. Brookfield, 2004 Evolution of developmental genes: molecular microevolution of for detecting geographic subdivision. Mol. Biol. Evol.9:138–151.
Jenkins, D. L., C. A. OrtoriandJ. F. Brookfield, 1995 A test for enhancer sequences at the Ubx locus in Drosophila and its impact on developmental phenotypes. Mol. Biol. Evol.21:348–363. adaptive change in DNA sequences controlling transcription.
Proc. R. Soc. Lond. Ser. B Biol. Sci.261:203–207. Ptak, S. E., D. A. Hinds, K. Koehler, B. Nickel, N. Patilet al., 2005 Fine-scale recombination patterns differ between chimpanzees Jensen, M. A., H. L. True, Y. O. ChernoffandS. Lindquist, 2001
Molecular population genetics and evolution of a prion-like pro- and humans. Nat. Genet.37:429–434.
Richards, S., Y. Liu, B. R. Bettencourt, P. Hradecky, S. Letovsky tein inSaccharomyces cerevisiae. Genetics159:527–535.
Johnston, J. R., C. BaccariandR. K. Mortimer, 2000 Genotypic et al., 2005 Comparative genome sequencing of Drosophila pseudoobscura: chromosomal, gene, and cis-element evolution. characterization of strains of commercial wine yeasts by tetrad
analysis. Res. Microbiol.151:583–590. Genome Res.15:1–18.
Roy, N., and K. W. Runge, 1999 The ZDS1 and ZDS2 proteins Jukes, T. H., andC. R. Cantor, 1969 Evolution of protein
mole-cules, pp. 21–132 inMammalian Protein Metabolism III, edited by require the Sir3p component of yeast silent chromatin to enhance the stability of short linear centromeric plasmids. Chromosoma H. N.Munro. Academic Press, New York.
Kang, X. L., F. Yadao, R. D. GietzandB. A. Kunz, 1992 Elimination 108:146–161.
Rozas, J., andR. Rozas, 1999 DnaSP version 3: an integrated pro-of the yeast RAD6 ubiquitin conjugase enhances base pair
transi-tions and G.C-T.A transversions as well as transposition of the Ty gram for molecular population genetics and molecular evolution analysis. Bioinformatics15:174–175.
element: implications for the control of spontaneous mutation.
Sadler, I., K. Suda, G. Schatz, F. KaudewitzandA. Haid, 1984 Genetics130:285–294.
Sequencing of the nuclear gene for the yeast cytochrome c1 Kellis, M., N. Patterson, M. Endrizzi, B. BirrenandE. S. Lander,
precursor reveals an unusually complex amino-terminal pre-2003 Sequencing and comparison of yeast species to identify
sequence. EMBO J.3:2137–2143. genes and regulatory elements. Nature423:241–254.
Slatkin, M., andT. Wiehe, 1998 Genetic hitch-hiking in a subdi-Kern, A. D., andD. J. Begun, 2005 Patterns of polymorphism and
vided population. Genet. Res.71:155–160. divergence from noncoding sequences of Drosophila
melanogas-Sokal, R. R., andF. J. Rohlf, 1995 Biometry: The Principles and Practice
ter and D. simulans: evidence for nonequilibrium processes. Mol.
of Statistics in Biological Research. W. H. Freeman, New York. Biol. Evol.22:51–62.
Stephens, M., N. J. SmithandP. Donnelly, 2001 A new statistical Kimura, M., 1983 The Neutral Theory of Molecular Evolution. Cambridge
method for haplotype reconstruction from population data. Am. University Press, Cambridge, UK.
J. Hum. Genet.68:978–989. Kohn, M. H., S. FangandC. I. Wu, 2004 Inference of positive and
Ta jima, F., 1989 Statistical method for testing the neutral mutation negative selection on the 5⬘regulatory regions of Drosophila
hypothesis by DNA polymorphism. Genetics123:585–595. genes. Mol. Biol. Evol.21:374–383.
Tautz, D., andL. Nigro, 1998 Microevolutionary divergence pat-Lazzaro, B. P., andA. G. Clark, 2001 Evidence for recurrent
paralo-tern of the segmentation gene hunchback in Drosophila. Mol. gous gene conversion and exceptional allelic divergence in the
Biol. Evol.15:1403–1411. Attacin genes ofDrosophila melanogaster. Genetics159:659–671.
Templeton, A. R., 1996 Contingency tests of neutrality using intra/ Ludwig, M. Z., andM. Kreitman, 1995 Evolutionary dynamics of
interspecific gene trees: the rejection of neutrality for the evolu-the enhancer region of even-skipped in Drosophila. Mol. Biol.
tion of the mitochondrial cytochrome oxidase II gene in the Evol.12:1002–1011.
hominoid primates. Genetics144:1263–1270. Ludwig, M. Z., N. H. PatelandM. Kreitman, 1998 Functional
Thomas, J. W., J. W.Touchman, R. W.Blakesley, G. G.Bouffard, analysis of eve stripe 2 enhancer evolution in Drosophila: rules
S. M.Beckstrom-Sternberget al., 2003 Comparative analyses governing conservation and change. Development125:949–958.
of multi-species sequences from targeted genomic regions. Na-Ludwig, M. Z., C. Bergman, N. H. PatelandM. Kreitman, 2000 ture424:788–793.
Evidence for stabilizing selection in a eukaryotic enhancer ele- Watterson, G. A., 1975 On the number of segregating sites in
ment. Nature403:564–567. genetical models without recombination. Theor. Popul. Biol.7:
McDonald, J. H., 1996 Detecting non-neutral heterogeneity across 256–276.
a region of DNA sequence in the ratio of polymorphism to diver- Winckler, W., S. R. Myers, D. J. Richter, R. C. Onofrio, G. J. gence. Mol. Biol. Evol.13:253–260. Mcdonaldet al., 2005 Comparison of fine-scale recombination McDonald, J. H., 1998 Improved tests for heterogeneity across a rates in humans and chimpanzees. Science308:107–111.
region of DNA sequence in the ratio of polymorphism to diver- Wright, F., 1990 The ‘effective number of codons’ used in a gene.
gence. Mol. Biol. Evol.15:377–384. Gene87:23–29.
McDonald, J. H., andM. Kreitman, 1991 Adaptive protein evolu- Yang, Z., 1997 PAML: a program package for phylogenetic analysis tion at the Adh locus in Drosophila. Nature351:652–654. by maximum likelihood. Comput. Appl. Biosci.13:555–556. Mortimer, R. K., P. Romano, G. Suzziand M. Polsinelli, 1994