DOI: 10.1534/genetics.103.025908
Note
On the Distribution of Temporal Variations in Allele Frequency: Consequences
for the Estimation of Effective Population Size and the Detection of Loci
Undergoing Selection
Isabelle Goldringer*
,1and Thomas Bataillon
†*UMR de Ge´ne´tique Ve´ge´tale, INRA UPS INA-PG CNRS, Ferme du Moulon, 91190 Gif sur Yvette, France and†UMR 1097 Diversite´ et Ge´nomes des Plantes Cultive´es, INRA Domaine de Melgueil, 34130 Mauguio, France
Manuscript received December 17, 2003 Accepted for publication June 7, 2004
ABSTRACT
The effective population size (Ne) is frequently estimated using temporal changes in allele frequencies at neutral markers. Such temporal changes in allele frequencies are usually estimated from the standardized variance in allele frequencies (Fc). We simulate Wright-Fisher populations to generate expected distribu-tions ofFc and ofFc (Fc averaged over several loci). We explore the adjustment of these simulatedFc distributions to a chi-square distribution and evaluate the resulting precision on the estimation ofNefor various scenarios. Next, we outline a procedure to test for the homogeneity of the individualFcacross loci and identify markers exhibiting extremeFc-values compared to the rest of the genome. Such loci are likely to be in genomic areas undergoing selection, drivingFcto values greater (or smaller) than expected under drift alone. Our procedure assigns a P-value to each locus under the null hypothesis (drift is homogeneous throughout the genome) and simultaneously controls the rate of false positive among loci declared as departing significantly from the null. The procedure is illustrated using two published data sets: (i) an experimental wheat population subject to natural selection and (ii) a maize population undergoing recurrent selection.
T
HE effective population size (Ne), defined as the 1/2Ne)t] (CrowandKimura1970). Iftis not too large(tⰆNe),Necan be approximated byNe⬇(P0(1⫺P0)t)/
size of an ideal Wright-Fisher population
undergo-ing the same rate of genetic change as the population (2V(Pt)) and therefore an estimator forNebased on the
standardized variance in allele frequency is (V(Pt))/
under study, is an essential parameter to predict the
evolution of a population due to genetic drift in terms of (P0(1⫺P0)).NeiandTajima(1981) proposed
estimat-ing the standardized variance in allele frequency between rates of loss of genetic variation, fixation of deleterious
alleles, or inbreeding (Wright 1969). However, ob- generationtxandtyfor each locuslwithKlalleles as
taining direct estimates ofNefrom demographic data
has often proved difficult. An alternative is to use indi- Fˆc,l⫽
冢
1
Kl
冣
兺
Kli⫽1
(px(i,l)⫺py(i,l))2
(px(i,l)⫹ py(i,l))/2⫺px(i,l)py(i,l)
, (1)
rect methods, for instance, those based on the
measure-ment of temporal changes in allele frequencies at neu- wherepx(i,l)[respectivelypy(i,l)] represents the frequency
tral markers (Krimbas and Tsakas 1971; Waples of alleleiat locuslin the sample ofSxindividuals drawn
1989a). The foundation of these methods is that the at generation tx (respectively Sy individuals at ty). A
variance of allele frequency due to drift from parents weighted mean ofFˆc,l-values across several loci,
to offspring,V(P1), depends onNeas follows:V(P1)⫽
P0(1⫺P0)/2Ne, whereP0is the frequency in the parental Fˆ
c⫽
兺
lKlFˆc,l
兺
lKl, (2)
population. After t generations of drift, the expected
frequency of the allele is E(Pt) ⫽ P0 and the variance is then typically used to estimateN
evia
of the allele frequency, V(Pt) ⫽ E(Pt ⫺ P0)2, can be
written as a function ofNe:V(Pt)⫽P0(1⫺P0)[1⫺(1⫺
Nˆe⫽
ty⫺ tx
2(Fc⫺ 1/(2Sx)⫺ 1/(2Sy))
(3)
(Waples 1989a). Note that Equation 1 assumes that
1Corresponding author:UMR de Ge´ne´tique Ve´ge´tale, INRA UPS
INA-alleles frequencies are estimated from samples taken
PG CNRS, Ferme du Moulon, 91190 Gif sur Yvette, France.
E-mail: [email protected] prior to reproduction (so-called plan II sampling scheme).
We use that sampling in the remainder of this article; and the true effective population size. In the second part, we outline a procedure to identify loci with “ex-allowing for an alternative sampling scheme is
straight-forward. treme” individualFˆc,l-values. We illustrate our approach
by reanalyzing two experimental data sets: temporal
vari-Recently, renewed interest in estimating Ne has led
to the development of numerous methods using allele ation in allele frequencies at 29 markers in an
experi-mental wheat population under natural selection and frequencies observed in a series of temporally spaced
samples of a population.WilliamsonandSlatkin(1999) frequencies at 82 markers in a maize population under
recurrent selection.
and Anderson et al. (2000) introduced a
maximum-likelihood approach to estimateNe.Berthieret al.(2002) The actual distribution ofFc and its consequences for
estimatingNe:To investigate the actual distribution of
proposed a coalescent-based likelihood approach to
es-timate Ne and Wang (2001) devised a faster approxi- Fc, we simulated Wright-Fisher populations using an
exact multinomial sampling scheme. We generated ex-mate version using a pseudo-maximum-likelihood method.
These methods, tested by the authors for some values pected distributions of temporal variations in allele
fre-quencies conditional on initial allele frefre-quencies. Distri-of population parameters (Ne,l,Kl, andpx(i,l)), have proved
to be slightly more accurate than the Fcmethod, but butions were based on 3000 independent replicates. In
each replication, several loci with the same initial allele
are much more computationally intensive. Hence Fc
-based estimators ofNeremain frequently used in prac- frequencies were simulated and Fc was computed. All
simulations were carried out using Mathematica(
Wol-tice (Fujiioet al.1999;Turneret al.1999;Goldringer
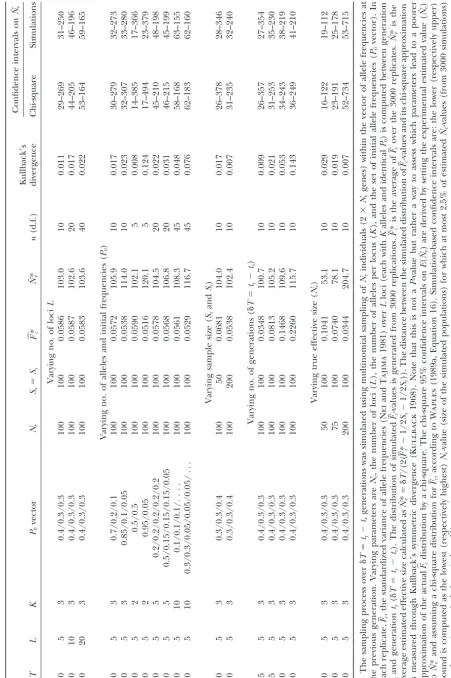
et al.2001;Shikanoet al.2001). Properties ofFc-based fram1996). Our simulations show that substantial
de-parture of the actual distribution ofFcfrom a chi-square
estimators ofNeand the quality of the confidence
inter-vals around such estimates depend critically on the dis- distribution, as measured through Kullback’s (1968)
symmetric measure of divergence between both
distri-tribution of Fc-values. Confidence intervals around Ne
have been based on the fact thatnFc/E(Fc), withn ⫽ butions (see Table 1), can be observed under a variety of
conditions depending on the parameter values chosen
兺l(Kl⫺1), is distributed approximately as a chi-square
with n d.f. (Lewontin and Krakauer 1973). Hence, (Table 1). The actualFc distribution is closest to a
chi-square and thus Ne is best estimated when biallelic
assessing the adjustment of the actualFc distribution to
a chi-square distribution is important. The chi-square marker loci with equal frequencies are used. Conversely,
the discrepancy between the actualFc distribution and
approximation has been studied for some special cases,
but the effects of initial allele frequencies, of the num- the chi-square approximation is large when allele
fre-quencies are strongly unbalanced (P0⬍0.1 for at least
ber of alleles, of the number of loci, and of the number
of generations as well as the “true” effective population one allele), when the number of alleles per locus is
large (K ⱖ 5) such as for microsatellite markers, or
size on the distribution of Fc-values and onNˆeare still
poorly known (Waples1989a). when the number of generations increases (␦T⫽ty⫺
tx ⬎ 15 when Ne ⫽ 100 is assumed). Increasing the
Before averaging estimates ofFcobtained at individual
loci to obtainFc and an estimate ofNe, it is desirable to sample sizes up to 200 or 500 individuals does not
dimin-ish the discrepancy, especially for a high number of test whether all loci used for that study have experienced
the same effective population size. This implicit assump- alleles (data not shown). In most cases, the distribution
of simulated values is shrunk compared to the chi-square tion, which underlies all methods of estimation
men-tioned above, is rarely tested. Several factors can modify approximation. In addition, the actual distribution is a
bit skewed toward higher values ofFc. As a consequence,
the local effective size at a given locus. The recurrent
elimination of deleterious variants linked to a marker the distribution ofNˆe in the simulations is often more
narrow than the one based on the chi-square approxi-locus, known as “background selection,” will reduce the
effective size locally; this effect depends on the local mation. Confidence intervals at the 95% level based on
either the chi-square approximation or the actual Fc
recombination rates and on genome-wide parameters
describing spontaneous mutation and their effect on distribution are given in Table 1. These are exactly the
intervals that would be computed in experimental
stud-fitness (Charlesworth et al. 1993). Hitchhiking will
also drive higher than expected the temporal variance ies. Chi-square confidence intervals are often wider than
the confidence intervals based on the simulatedFc
(Ta-in allele frequency of markers l(Ta-inked to a positively
selected variant (WieheandStephan1993). ble 1). The width of this interval, which is connected
to the precision of the estimation, depends mainly on The remainder of this note is organized as follows.
In the first part, we study the actualFc distribution and the number of independent alleles used [L(K ⫺ 1)].
Note that the productL(K⫺1) is also the number of
the quality of the chi-square approximation. The actual
distribution ofFc, its divergence from a chi-square distri- degrees of freedom of the chi-square used in previous
approximations. Confidence intervals derived from
sim-bution, and the quality of theNe estimation based on
Fc are studied under various scenarios by varying the ulated data are reduced by 10–25% relative to
chi-square-based confidence intervals for scenarios involving unbal-initial allele frequencies, the number of loci, the
10, or very large number of alleles (K ⫽ 10), sample
sizes⬍100, ␦T⬎ 10, or Ne ⬍ 75. Otherwise, they are
quite close to the chi-square-based intervals (reduction
is⬍10%). Similar results are found with larger sample
sizes (200 and 500 individuals).
Except for␦T⫽ 5 generations,Nˆ*e, computed from
F*c (an average ofFc over 3000 independent replicates),
is always higher than the population size Ne used in
simulations. This indicates thatFc-based estimation tends
to return overestimated values of Ne. Richards and
Leberg(1996) and Luikartet al.(1999) argued that
the overestimation of NeusingFc [orPollak’s (1983)
estimator,Fˆk] is due mainly to the loss of alleles in early
generations, suggesting that the bias would be greater with increasing drift and when there are rare alleles.
Luikartet al. (1999) focused on the estimation ofNe
Figure 1.—Distribution ofP-values for the 82 loci in the
after very strong bottlenecks (Ne ⫽4–40), which were
maize data set ofLabateet al.(1999).
not considered here. Whereas our results confirm the existence of a greater bias for rare alleles, for the range
ofNewe considered, population size does not appear as
genotyped at 29 RFLP loci (Goldringeret al. 2001).
critical; however, increasing the number of generations
For each locus l, we pooled the remaining 28 loci to
between samples leads to overestimation ofNe. Hence,
obtain a globalFc estimate and anFc-based estimate of
to improve precision on the Fc-based estimation ofNe,
Ne (described hereafter as the genome-wide average
we recommend generating the actual Fc distribution
estimate). The expected distribution ofFcat locuslwas
using simulations based on the estimated valueNˆeand
then obtained (using typically 3000–5000 independent
obtaining a confidence interval directly onNˆe. With such
simulations) conditional onNˆe(excluding locusl) and
a gain in accuracy, the performance of the Fc-based
the observed initial allele frequencies (at locusl). We
estimator of Ne becomes close to those of
likelihood-then tested whether the observed temporal variance of based estimators.
allele frequencies at locusl,Fˆc,l, was significantly larger
Distribution ofFcat individual loci and the detection
than the genome-wide average variations by computing
of loci departing from pure drift: Once Ne has been p, the probability forFˆ
c,l to be greater than or equal to
estimated on the basis of Fc by averaging over several the observed value at this locus on the basis of the
marker loci, it is desirable to test whether all loci
consid-simulated distribution described above. Note that one ered have undergone the same rate of change in allele
could also test for the presence of loci exhibiting smaller
frequency. Heterogeneity in individualFc-values might than expected variations in allele frequency. Some loci
be used as evidence for selection since “while natural exhibited some “excess drift” relative to the rest of the
selection will operate differently for each locus and each allele loci and accordingly fairly smallP-values:Fba242-C(P⫽ at a locus, the effect of breeding structure(migration, genetic 0.021),Fba280-C(P⫽0.042),Fba65-D(P⫽0.085), and
drift, inbreeding)is uniform over all loci” (Lewontinand Fba204-A(P⫽0.09). However, the distribution ofP-values
Krakauer 1973, pp. 176–177). Loci with significantly was fairly uniform (data not shown) and to take into
ac-highFˆc,l-values should be discarded before (re)comput- count the fact that multiple loci were examined we
com-ingFcto yield a more reliable estimate ofNe. puted the expected false discovery rates, also known as
We propose a way to identify, in a series of experimen- q-values, using the distribution ofP-values (seeStoreyand
talFˆc,lmeasurements, markers exhibitingFˆc,l-values sig- Tibshirani2003 for details). Theq-values were calculated
nificantly higher than expected under pure drift based using the package QVALUE (http://faculty.washington.
on Nˆe. To do so, each Fˆc,l-value should be compared edu/jstorey/qvalue/index.html). This analysis suggests
to an expected distribution based on a genome-wide that declaring onlyFba242-CandFba280-Cas “significant”
effective size estimated from the remaining loci and for excess of drift would still yield an estimated rate of
the trajectory of allele frequencies at this locus. We false positives ofⵑ40% among these two loci.
exemplify below our method with two published data Next we consider the study published byLabateet al.
sets. First we consider individual Fˆc,l-values estimated (1999), where temporal variations in allele frequencies
from temporal variations of allele frequencies in an were surveyed at 82 RFLP loci after 12 generations in
experimental composite wheat population undergoing maize populations undergoing recurrent selection. A
natural selection. A total of 250 and 213 individuals P-value was calculated at each locus (Figure 1), using
the method described above. The distribution ofP
Fc-values significantly higher than expected on the basis
of mean Ne, thereby providing a (formal) way of
as-sessing if selection is operating on any given genomic
segment (see also Luikartet al. 2003 for a review of
available methods for population structure). One
poten-tial caveat of our method is that the distribution ofFc
under the null hypothesis is generated using
informa-tion from the data (to estimate the genome-wideNe). We
verified through simulations (see online supplementary material at http://www.genetics.org/supplemental/) that our procedure is actually fairly robust to uncertainty
in the estimation of the genome-wide Ne. A program
generating the expected individual or meanFc
distribu-Figure2.—Expected proportion of false positives (q-values)
tions used in this note is available upon request as a
among the loci found to be departing significantly from the
genome-wide average effective size in the maize data set as Mathematicanotebook from the authors.
a function of the individual threshold used for significance
We thank F. Hospital, I. Bonnin, and C. Dillmann for helpful discus-(P-value). Calculations of the q-values were done using the
sions and A. Tsitrone, R. Waples, and an anonymous reviewer for procedure proposed byStoreyandTibshirani(2003).
their comments on earlier versions of this article. We thank O. Martin for correcting and improving the English of this article.
ues was then used to calculate correspondingq-values
LITERATURE CITED
(Figure 2). In contrast with the previous case, the
distri-bution of P-values is clearly L-shaped (Figure 1) and Anderson, E. C., E. G. Williamson andE. A. Thompson, 2000
Monte Carlo evaluation of the likelihood forNefrom temporally
choosing aq-value cutoff of 0.05 yields 10–11 loci
exhib-spaced samples. Genetics156:2109–2118.
iting significant departures from the genome-wide level Beaumont, M. A., and R. A.Nichols, 1996 Evaluating loci for use
in the genetic analysis of population structure. Proc. R. Soc. Lond.
of drift. This method proved to be somewhat more
con-Ser. B263:1619–1626.
servative than the one used by the authors, who declared
Berthier, P., M. A. Beaumont, J. M. CornuetandG. Luikart, 2002
14 loci as outliers (Labateet al. 1999). Discarding those Likelihood-based estimation of the effective population size using
temporal changes in allele frequencies: a genealogical approach.
outlier loci, one can compute a new genome-wide
effec-Genetics160:741–751.
tive size and check that no more loci exhibitFc-values
Charlesworth, B., M. T. Morganand D.Charlesworth, 1993
departing significantly from the null hypothesis of ho- The effect of deleterious mutations on neutral molecular
varia-tion. Genetics134:1289–1303.
mogenous drift (data not shown).
Crow, J. F., andM. Kimura, 1970 An Introduction to Population
Genet-Waples (1989b) proposed a method based on the
ics Theory. Burgess Publishing, Minneapolis.
chi-square test of homogeneity to test the hypothesis Fujiio, Y., M. NakajimaandA. A. Barinova, 1999 Decrease of the
effective population size during maintenance of the guppy strain.
that observed changes in allele frequencies can be
satis-Fish. Sci.65:362–366.
factorily explained by drift alone. This allows one to
Goldringer, I., J.Enjalbert, A.-L.Raquinand P.Brabant, 2001
examine the variation of a particular allele according Strong selection in wheat populations during ten generations of
dynamic management. Genet. Sel. Evol.33(Suppl. 1): 441–463.
to the range of possible Ne-values for the population
Krimbas, C. B., andS. Tsakas, 1971 The genetics ofDacus oleaV:
under study. Yet, this test has not been widely used in
changes of esterase polymorphism in natural population
follow-experimental studies. Indeed, it is rather complicated ing insecticide control: Selection or drift? Evolution25:454–460.
Kullback, S., 1968 Information Theory and Statistics. Dover, New York.
to implement, particularly in cases of multiple alleles
Labate, J. A., K. R. Lamkey, M. LeeandW. L. Woodman, 1999
Tem-since it is necessary to consider covariances of
frequen-poral changes in allele frequencies in two reciprocally selected
cies for different alleles sampled at different times.Lew- maize populations. Theor. Appl. Genet.99:1166–1178.
Lewontin, R. C., andJ. Krakauer, 1973 Distribution of gene
fre-ontinandKrakauer (1973) provided the theoretical
quency as a test of the theory of the selective neutrality of
polymor-grounds for homogeneity tests of variation in allele
fre-phisms. Genetics74:175–195.
quencies, but they emphasized more spatial variation, Luikart, G., J. M. CornuetandF. W. Allendorf, 1999 Temporal
changes in allele frequencies provide estimates of population
and the test proposed for temporal variation, which
bottleneck size. Conserv. Biol.13:523–530.
again relies on the assumption of a chi-square
distribu-Luikart, G., P. R.England, D.Tallmon, S.Jordanand P.Taberlet,
tion of individualFc,l-values, is much too restrictive [see 2003 The power and promise of population genomics: from
genotyping to genome typing. Nat. Rev. Genet.4:981–994.
Beaumont and Nichols (1996) and Vitalis et al.
Nei, M., andF. Tajima, 1981 Genetic drift and estimation of effective
(2001) for the case of spatial variation in allele
frequen-population size. Genetics98:625–640.
cies]. The use of simulation-based distributions provides Pollak, E., 1983 A new method for estimating the effective
popula-tion size from allele frequency changes. Genetics104:531–548.
a robust method to test for homogeneity of Fˆc,l-values
Richards, C., andP. L. Leberg, 1996 Temporal changes in allelic
across loci before pooling estimates. Our procedure
frequencies and a population history’s severe bottlenecks.
Con-yields a more reliable genome-wide estimate of the real- serv. Biol.10:832–839.
Shikano, T., T. Chiyokuboand N. Taniguchi, 2001 Temporal
changes in allele frequency, genetic variation and inbreeding population size from temporal changes in allele frequency.
Ge-netics121:379–391.
depression in small populations of the guppy,Poecilia reticulata.
Heredity86:153–160. Waples, R. S., 1989b Temporal variation in allele frequencies:
test-ing the right hypothesis. Evolution43:1236–1251.
Storey, J. D., and R.Tibshirani, 2003 Statistical significance for
genomewide studies. Proc. Natl. Acad. Sci. USA100:9440–9445. Wiehe, T. H. E., and W.Stephan,1993 Analysis of a genetic
hitch-Turner, T. F., L. R. RidchardsonandJ. R. Gold, 1999 Temporal hiking model, and its application to DNA polymorphism data
genetic variation of mitochondrial DNA and the female effective from Drosophila melanogaster. Mol. Biol. Evol.10:842–854.
population size of red drum (Sciaenops ocellatus) in the northern Williamson, E. G., andM. Slatkin, 1999 Using maximum
likeli-Gulf of Mexico. Mol. Ecol.8:1223–1229. hood to estimate population size from temporal changes in allele
Vitalis, R., K. DawsonandP. Boursot, 2001 Interpretation of frequencies. Genetics152:755–761.
variation across marker loci as evidence of selection. Genetics Wolfram, S., 1996 The Mathematica Book, Ed. 3. Cambridge
Univer-158:1811–1823. sity Press, Cambridge/London/New York.
Wang, J., 2001 A pseudo-likelihood method for estimating effective Wright, S., 1969 Evolution and the Genetics of Populations,Vol. 2: The
population size from temporally spaced samples. Genet. Res.78: Theory of Gene Frequencies. University of Chicago Press, Chicago.
243–257.