ISSN (Print) : 2320 – 3765 ISSN (Online): 2278 – 8875
I
nternational
J
ournal of
A
dvanced
R
esearch in
E
lectrical,
E
lectronics and
I
nstrumentation
E
ngineering
(An ISO 3297: 2007 Certified Organization)
Vol. 5, Issue 3, March 2016
Minimization of Real Power loss using
Evolutionary Algorithm
Bhaskar Sharma1, Pooja Sharma2, Dr. Annapurna Bhargava3, S.C. Mittal4
PG Student [Power System], Dept. of EE, University College of Engineering, Kota, Rajasthan, India1
PG Student [Power System], Dept. of EE, University College of Engineering, Kota, Rajasthan, India2
Professor, Dept. of EE, University College of Engineering, Kota, Rajasthan, India3
Associate Professor, Dept. of EE, University College of Engineering, Kota, Rajasthan, India4
ABSTRACT: In deregulated power system, load demands are continuously increasing due to growth of population. In order to meet load demand, unscheduled power flow through transmission line which results in higher real & reactive power losses and voltage instability at buses. To overcome these problems, a Flexible Alternating Current Transmission System (FACTS) devices are installed at appropriate location to get the maximum possible benefits i.e. minimize real power loss in the power network and improve voltage profile at the buses. In this paper, a new evolutionary optimization techniques have been applied namely Genetic Algorithm (GA) and Differential Evolution (DE) algorithm to select the optimal parameters setting including rating of Static Var Compensator (SVC) to minimize real power loss and improve voltage profile and compare their performances. For validation of proposed algorithm and for comparison purpose, MATLAB program is carried out on IEEE 30-bus system. The results, we have obtained, indicates that DE is an easy to use, fast, robust and powerful optimization technique compared with GA.
KEYWORDS: FACTS, SVC, N-R method, GA and DE.
I. INTRODUCTION
In last few decades, electrical power companies are continuously increasing due to increase in demand of electrical power at load. Consequently, the power system becomes more difficult to operate, more insecure due to transfer of cheap power from generating companies to load and higher losses. These may lead to overloading of transmission lines and transformers. To alleviate these problems, utilities require to construct the new transmission line, install, and upgrade the system components. It has some problems viz. environmental issues, right of way and cost issues. Thereafter, with the development of power semi-conductor devices, it is possible to design power electronics equipment known as Flexible Alternating Current Transmission System (FACTS) devices. These devices are introduced by N.G. Hingorani in 1988. It controls magnitude and phase angle of voltage at the buses and impedance of the transmission system [1].
FACTS technologies provide the minimum infrastructure investment, environment impact and implementation time as compared to new transmission line. Among the FACTS devices, SVC is one of the effective measures for improving the voltage profile, reducing the real power loss, enhancing the transient stability and improving the dynamic characteristic of the power system [2]. The optimal parameters setting including rating of SVC is considered for the real power loss reduction, improvement in transient stability and increasing in power transfer capability. Therefore, the conventional power flow algorithm should incorporate with SVC considering one or all of the above mentioned factors [3].
ISSN (Print) : 2320 – 3765 ISSN (Online): 2278 – 8875
I
nternational
J
ournal of
A
dvanced
R
esearch in
E
lectrical,
E
lectronics and
I
nstrumentation
E
ngineering
(An ISO 3297: 2007 Certified Organization)
Vol. 5, Issue 3, March 2016
problems, new evolutionary based approaches namely, GA and DE algorithm have been applied for real power loss reduction by optimal parameter setting including rating of SVC. Also, performance of GA and DE are compared.
II. PROBLEM FORMULATION
The main objective of this paper is to determine the optimal location and optimal parameter setting of SVC to minimize real power loss and improve voltage profile, the following performance is selected:
Min F = Min
1
NL L k
P
(1) Where, F = Fitness functionPL = Total real power loss
Minimization of real power loss: The real power loss (PL) as first term of objective function F1(u,v) is defined as:
1 L k i 2 j 2 i j i
k=1
f (u,v) = P =
g [(V ) +(V ) - 2V V cos(
δ -δ )]
NL
j
å
(2) Where, NL = number of transmission line,g = conductance of line, and
V
iÐ
δ
iandV
jÐ
δ
j= voltage and phase angle at bus i and j.Minimization of size of SVC:The size of SVC as second term of objective function F2(u,v) is defined as :
f (SVC
2 size)
= rating of SVC in per unit (3) Subjected to following equality constraints:
NB
Gi Di i j ij i j ij i j
j=1
P - P - V
å
V [G cos(
δ -δ )+B sin(δ -δ )]
=
0
For i =1, 2,….NB (4)NB
Gi Di i j ij i j ij i j
j=1
Q - Q - V
å
V [G sin(
δ -δ )-B cos(δ -δ )]=0
For i =1, 2,….NB (5)Where, NB = total number of buses,
P
GiandQ
Gi= generator real and reactive power at bus,
P
DiandQ
Di= active and reactive power load demand at bus i,
B
ij = transfer susceptance of line between bus i and j, and
V
iandV
j= voltage magnitude at bus i and j. Subjected to Inequality constraints are following:Reactive power generation Q ≤Q ≤Q i = 1…. NG (6) Voltage magnitude V ≤V ≤V i = 1…. NB (7) Where, ng = total number of generated bus.
III. DESCRIPTION OF DE
Rainer Stron and Kenneth Price who was first introduced the Differential Evolution (DE) algorithm in 1995 and since then the DE algorithm has been used in many practical cases. DE is a heuristic and population based optimization technique. This algorithm is a direct search method that chooses individual as fixed number of population vector for each generation (G). DE solves a different type of global optimization problems such as dis-continuous, non-linear, non-differential, and multi-dimension objective function over a wide range of the real life application in the field of science and number of branches of engineering.
ISSN (Print) : 2320 – 3765 ISSN (Online): 2278 – 8875
I
nternational
J
ournal of
A
dvanced
R
esearch in
E
lectrical,
E
lectronics and
I
nstrumentation
E
ngineering
(An ISO 3297: 2007 Certified Organization)
Vol. 5, Issue 3, March 2016
selection. Generally, DE algorithm uses the following notation: DE/x/y/z. Where, x stands for mutated vector, y for a number of difference vector and z for which type of crossover scheme is used- exponential crossover or binomial crossover [6]-[8].
The advantages of DE can be summarised as follows [9]-[10]. DE has the following steps [11]:
Step-1 Randomly generates an initial population of NP individuals within the feasible space. P( )
= X( ), = ( )+ (0,1) × ( )− ( ) (8) Step-2 Calculate the fitness value for the each individual of the each member of the population based on the objective function to be minimized.
Step-3 Generate new population by using mutation, crossover and selection operator.
Mutation- The mutation operator creates mutant or donor vector that randomly selecting three individuals or vectors
X( ), X( ), X( ) from current population. A difference of any two individuals out of three individuals is added to third one. The mutant vector v(, )can be expressed as:
v(, )= X( ), + F × X( ), −X( ), (9)
Where r1, r2, r3∈ (1 to NP) and F is real and constant number, which can take the value between 0 to 2.
Crossover- The process of crossover plays vital role in order to augment the potential diversity of the population vector. Using crossover operation, the trial vector can generated by exchanging the element or component of target vector and donor vector. The following expression for binominal crossover is:
(, )= v,
( )
, if (0,1)≤ =
X( ), , otherwise (10)
Where i = 1 to NP, j = 1 to D, jrand = randomly chosen index ∈ (1 to NP) that sure for trial vector get at least one parameter from mutant vector, rand (0,1) is uniformly distributed number within (0,1) generated for each j. CR is crossover rate. The range of CR is [0,1].
Selection- Selection specify under what condition which one of the child and parent will survive in the next generation. The selection operation is described as:
X(, )= ,
( )
( (, ))≤ (X( ), )
X( ), ℎ (11)
Step-4 Terminate process will occurs if the optimal solution is obtained or maximum number of the generation or iterations are reached; otherwise go to step-3.
Step-5 Stop the process, print the best individual.
IV. DESCRIPTION OF GA
Conventional methods have been used to solve the problem of power system design, planning and operation for different applications. But these methods have some disadvantages- stuck in global minima, more iterations and providing sub-optimal solution. In this regard, evolutionary algorithm have been used that can give better solution in several conditions and can easily applied in field of science and number of branches engineering [12]-[13].
Genetic algorithm (GA) is a kind of evolutionary algorithm, based on the concept from natural genetics and Darwinian survival of the fittest. GA is first pioneered by Holland in the 60’s and 70’s. The GA control parameters- population size, crossover probability, and mutation probability are chosen and initial population is randomly generated of finite length of string. If pre-defined convergence is not satisfied, then genetic operators- selection, crossover and mutation are carried out [14]-[15]. The process of GA can described as follows:
Step-1 Inputs of GA including population size, crossover probability and mutation probability. Also, set maximum number of generations or iterations and time as stopping criterion for random generation of population.
Step-2 Calculate the fitness value for each individual of population according to objective function. Step-3 New population is generated by selection, crossover and mutation.
ISSN (Print) : 2320 – 3765 ISSN (Online): 2278 – 8875
I
nternational
J
ournal of
A
dvanced
R
esearch in
E
lectrical,
E
lectronics and
I
nstrumentation
E
ngineering
(An ISO 3297: 2007 Certified Organization)
Vol. 5, Issue 3, March 2016
b) Crossover- Crossover sometime referred as recombination. Two individuals or parents are combined with crossover operation to form child for the next generation.
c) Mutation- Mutation operator makes small random changes in the individual in the population to create mutation children. It provides the broader space to search optimal solution in GA and as a result high diversity.
Step-4 Terminate process will occurs if the optimal solution is obtained or maximum number of the generation or iterations are reached; otherwise go to step-3.
Step-5 Stop the process, print the best individual.
V. RESULTS AND DISCUSSION
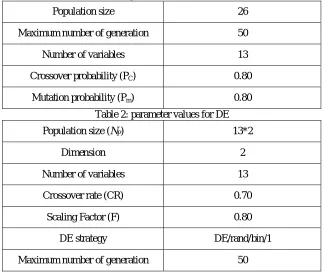
For the simulation purpose a MATLAB codes for GA, DE and modified power flow algorithm including SVC are developed. To investigate the verification of proposed approaches, both GA and DE algorithm have been tested on IEEE 30-bus system. This system has one slack bus, 5 generator buses, 24 load buses and 41 transmission lines[16]. All the load buses i.e. PQ buses are considered as optimal location of SVC. For optimal placement of SVC obtain by applying N-R method to find most severity bus among all 30 buses. The single line outage are considered as contingence in test system. In this paper, we considered the four different cases– Base Case (without Line Outage), Line Outage 36 and Line Outage 37. The GA and DE parameters utilized in this simulation are shown in Table 1 & 2.
Table 1: parameter values for GA
Population size 26
Maximum number of generation 50
Number of variables 13
Crossover probability (PC) 0.80
Mutation probability (Pm) 0.80
Table 2: parameter values for DE
Population size (NP) 13*2
Dimension 2
Number of variables 13
Crossover rate (CR) 0.70
Scaling Factor (F) 0.80
DE strategy DE/rand/bin/1
Maximum number of generation 50
ISSN (Print) : 2320 – 3765 ISSN (Online): 2278 – 8875
I
nternational
J
ournal of
A
dvanced
R
esearch in
E
lectrical,
E
lectronics and
I
nstrumentation
E
ngineering
(An ISO 3297: 2007 Certified Organization)
Vol. 5, Issue 3, March 2016
Table 3: Comparison of real power loss under base case with GA
Bus voltage V30 (pu)
Bus voltage V29 (pu)
Bus voltage
V26 (pu) Real power loss (pu) Optimal value
Without SVC With SVC Without SVC With SVC Without SVC With SVC Without SVC With SVC With
GA SVC
0.962 1.024 0.974 1.036 0.966 1.022 0.1821 0.1786 0.1740 0.35, 0.38, 0.18
Table 4: Comparison of real power loss under base case with DE
Bus voltage V30 (pu)
Bus voltage V29 (pu)
Bus voltage
V26 (pu) Real power loss (pu)
Optimal value Without SVC With SVC Without SVC With SVC Without SVC With SVC Without SVC With SVC With
DE SVC
0.973 0.982 0.985 1.001 0.976 1.019 0.1798 0.1679 0.1649 0.73, 0.16, 0.35
Figure1: Comparison of real power loss under base case
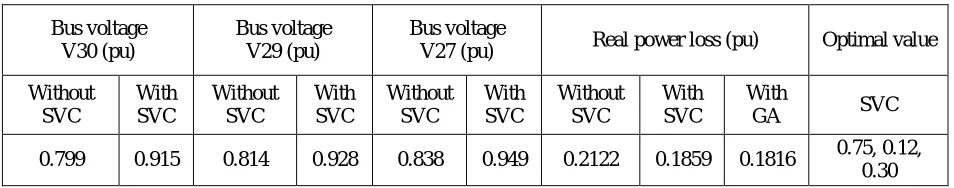
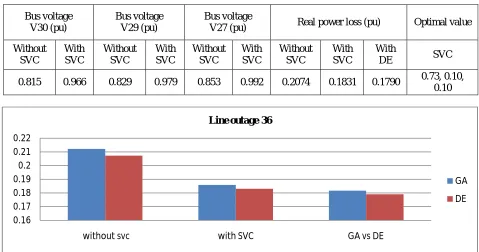
Line outage 36- Run N-R load flow, when SVC is not connected to find the optimal location of SVC. In this case, there are three most severe location of SVC in test system namely; bus number 30, 29 and 27. The voltages at these buses and real power loss with GA and DE are given in below Table 5 & 6:
Table 5: Comparison of real power loss under line outage 36 with GA
Bus voltage V30 (pu)
Bus voltage V29 (pu)
Bus voltage
V27 (pu) Real power loss (pu) Optimal value
Without SVC With SVC Without SVC With SVC Without SVC With SVC Without SVC With SVC With
GA SVC
0.799 0.915 0.814 0.928 0.838 0.949 0.2122 0.1859 0.1816 0.75, 0.12, 0.30 0.155 0.16 0.165 0.17 0.175 0.18 0.185
without svc with SVC GA vs DE
Base case
GA
ISSN (Print) : 2320 – 3765 ISSN (Online): 2278 – 8875
I
nternational
J
ournal of
A
dvanced
R
esearch in
E
lectrical,
E
lectronics and
I
nstrumentation
E
ngineering
(An ISO 3297: 2007 Certified Organization)
Vol. 5, Issue 3, March 2016
Table 6: Comparison of real power loss under line outage 36 with DE
Bus voltage V30 (pu)
Bus voltage V29 (pu)
Bus voltage
V27 (pu) Real power loss (pu) Optimal value
Without SVC With SVC Without SVC With SVC Without SVC With SVC Without SVC With SVC With
DE SVC
0.815 0.966 0.829 0.979 0.853 0.992 0.2074 0.1831 0.1790 0.73, 0.10, 0.10
Figure 2: Comparison of real power loss under line outage 36
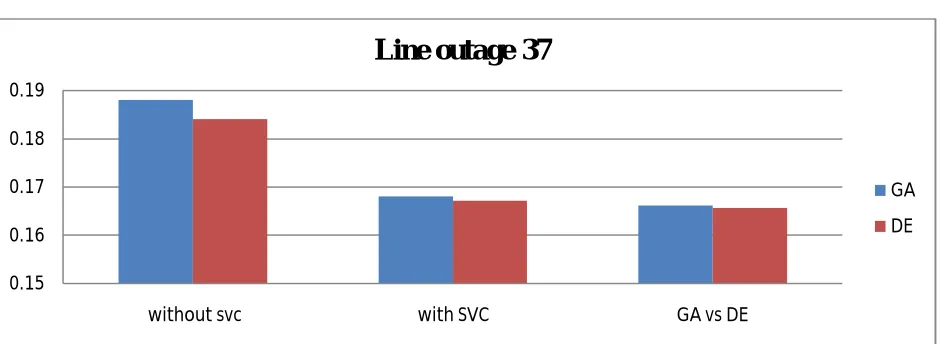
Line outage 37- Run N-R load flow, when SVC is not connected to find the optimal location of SVC. In this case, there are three most severe location of SVC in test system namely; bus number 30, 29 and 26. The voltages at these buses and real power loss with GA and DE are in given below Table 7 & 8:
Table 7: Comparison of real power loss under line outage 36 with GA
Bus voltage V30 (pu)
Bus voltage V29 (pu)
Bus voltage
V26 (pu) Real power loss (pu) Optimal value
Without SVC With SVC Without SVC With SVC Without SVC With SVC Without SVC With SVC With
GA SVC
0.925 1.019 0.914 1.011 0.963 1.043 0.1881 0.1681 0.1662 0.50, 0.03, 0.41
Table 8: Comparison of real power loss under line outage 36 with DE
Bus voltage V30 (pu)
Bus voltage V29 (pu)
Bus voltage
V26 (pu) Real power loss (pu) Optimal value
Without SVC With SVC Without SVC With SVC Without SVC With SVC Without SVC With SVC With
DE SVC
0.938 0.973 0.927 0.980 0.974 0.998 0.1841 0.1672 0.1657 0.44, 0.10, 0.89 0.16 0.17 0.18 0.19 0.2 0.21 0.22
without svc with SVC GA vs DE
Line outage 36
GA
ISSN (Print) : 2320 – 3765 ISSN (Online): 2278 – 8875
I
nternational
J
ournal of
A
dvanced
R
esearch in
E
lectrical,
E
lectronics and
I
nstrumentation
E
ngineering
(An ISO 3297: 2007 Certified Organization)
Vol. 5, Issue 3, March 2016
Figure 3: Comparison of real power loss under line outage 36
VI. CONCLUSION
In this paper, the effectiveness of optimal installation of SVC for minimizing the real power losses under single line outages in the network has been investigated. Determination of optimal location of SVC was found based on weakest bus among all buses. One of the newest evolutionary techniques namely, GA and DE algorithm have been successfully applied to solve the optimization problem under consideration. Three variables were considered to be optimized i.e. voltage at voltage controlled bus, tap setting of transformer and rating of SVC. The performance of DE is compared with GA. With proposed algorithms, it is possible for real power loss reduction using placement of SVC in the network. The obtained results show that DE has superior feature including high quality solution, good computation efficiency, easy, fast, simple and robust.
REFERENCES
[1]. Ghamgeen Rashed, Yuanzhang Sun, HI Shaheen. Optimal Location of Thyristor Controlled Series Compensation in a Power System based on Differential Evolution Algorithm Considering Transmission Loss Reduction. In Intelligent Control and Automation (WCICA), 2011 9th World Congress on, pages 610–616. IEEE, 2011.
[2]. Amit Debnath, Joseph Rualkima Rante, and Champa Nandi. Stability Enhancement with SVC. International Journal of Computer Applications, 72(5):19–25, 2013.
[3]. Ghamgeen I Rashed, Yuanzhang Sun, and HI Shaheen. Optimal Location and Parameter Setting of TCSC for Loss Minimization Based on Differential Evolution And Genetic Algorithm. Physics Procedia, 33:1864–1878, 2012.
[4]. MA Abdel-Moamen and Narayana Prasad Padhy. Newton-Raphson TCSC Model for Power Flow Solution of Practical Power Networks. In Power Engineering Society Summer Meeting, 2002 IEEE, volume 3, pages 1488–1493. IEEE, 2002.
[5]. Dharamjit and D.K.Tanti. Load Flow Analysis on IEEE 30 bus System. International Journal of Scientific and Research Publications, Volume 2, Issue 11, November 2012.
[6]. Linda Slimani and Tarek Bouktir. Application of Differential Evolution Algorithm to Optimal Power Flow Incorporating FACTS: A Case Study. Journal of advanced science and applied engineering, vol. 1 pages 8-15, 2015.
[7]. MM Farsangi H Nezamabadi-pour. Differential Evolutionary Algorithm for Allocation of SVC in a Power System.
[8]. Swagatam Das and Ponnuthurai Nagaratnam Suganthan. Differential Evolution: A survey of the State-of-the-Art. Evolutionary Computation, IEEE Transactions on, 15(1):4–31, 2011.
[9]. Rainer Storn and Kenneth Price. Differential Evolution – A Simple and Efficient Heuristic for Global Optimization over Continuous Spaces. Journal of Global Optimization 11: 341–359, 1997.
[10]. Kenneth V. Price. Differential Evolution: A Fast and Simple Numerical Optimizer, IEEE Transactions on, 524–527, 1996.
[11]. A Kai Qin and Ponnuthurai N Suganthan. Self-Adaptive Differential Evolution Algorithm for Numerical Optimization. In Evolutionary Computation, 2005. The 2005 IEEE Congress on, volume 2, pages 1785–1791. IEEE, 2005.
[12]. Shraddha Udgir, Laxmi Srivastava, and Manjaree Pandit. Optimal Placement and Sizing of SVC for Loss Minimization and Voltage Security Improvement using Differential Evolution Algorithm. IEEE International Conference on Recent Advances and Innovations in Engineering (ICRAIE), 2014, pages 1–6. IEEE, 2014.
[13]. Shishir Dixit, Laxmi Srivastava, and Ganga Agnihotri. Optimal Placement of SVC for Minimizing Power Loss and Improving Voltage profile using GA. International Conference on Issues and Challenges in Intelligent Computing Techniques (ICICT), pp. 123-129, 2014.
[14]. VA Preethi, S Muralidharan, and S Rajasekar. Application of Genetic Algorithm to Power System Voltage Stability Enhancement using FACTS Devices. In Recent Advancements in Electrical, Electronics and Control Engineering (ICONRAEeCE), 2011 International Conference on, pages 333–338. IEEE, 2011.
0.15 0.16 0.17 0.18 0.19
without svc with SVC GA vs DE
Line outage 37
GA
ISSN (Print) : 2320 – 3765 ISSN (Online): 2278 – 8875
I
nternational
J
ournal of
A
dvanced
R
esearch in
E
lectrical,
E
lectronics and
I
nstrumentation
E
ngineering
(An ISO 3297: 2007 Certified Organization)
Vol. 5, Issue 3, March 2016
[15]. Nithin Skaria, Sarin Baby, DM Anumodu, et al. Genetic Algorithm based Optimal Location of SVC in Power System for Voltage Stability Enhancement. In Emerging Research Areas: Magnetics, Machines and Drives (AICERA/iCMMD), 2014 Annual International Conference on, pages 1–6. IEEE, 2014.