Resource Constraint Estimation using
Performance Metric with respect to LEACH
Protocol in WSN
Syed TazirulIlm
1,Diganta Bordoloi
21
Assistant Professor, Dept. of Co mputer Sc ience, AIMT, Gu wahati, Assam, India
2
Assistant Professor, Dept. of Co mputer Sc ience, GIMT, Assam, India
ABSTRACT
:
With the advancement in Wireless Co mmunication and Mic ro Electro -Mechanica l Systems wh ich is followed by Nano-e lectro mechanical System(NEMS) has lead the develop ment of Wireless Sensor Network(WSN).Wireless sensor network whose acronym is “WSN” is a network that consists of nodes cable of sensing the environment and then send the sense data to the Base station (Sink Node).The sensing nodes has resource constraints like low power as it runs on button cell(3Vo lt), so when they send the sense data then the routing protocol should be energy efficient and should have low/minima l latency as well. In this paper we have simulated the Low Energy Adaptive Clustering Hierarchy (LEACH) Protocol in Mat Lab and then evaluated the performance metric and have come out with conclusions which are le ft for the scope of future study and research.
KEYWORDS: W ire less Sensor Network, Latency, Clustering Hie rarchy based routing .
I. IN TRO DUC TION
Rapid progress in Wire less Sensor Network in the beginning was mot ivated by Military and Defence applications. But due to the advancement in MEMS[1] technology the range of Applications is no longer constrained to Defence and Military instead it‟s now a days used in Vivid application like health care , mon itoring and tracking, surveillance, etc, so WSN has achieved the tremendous prospects in Application.The Wireless Sensor Network can be broadly classified into Homogeneous Wireless Sensor Network and Heterogeneous Wireless Sensor Network and to enhance the lifetime of the network now a days the later kind is used. The Homogeneous Wireless Sensor Network consist of similar motes(nodes) having equivalent resources whereas the Heterogeneous Wireless Sensor Network consists of motes with varied resources.WSN contain heavy sense data and when the motes send the sense data to the cluster head then the CH send the sense data by aggregating the data thereby removing the unreliable and overlapped data. For e xa mple applying the beam forming technique several signals are aggregated into single signal which contain the informat ion re lated to all the signal.Till now the research in wire less sensor network is done ma inly in Network Layer and Mediu m Access Control(MA C) Layer protocols focusing on optimization of Energy, synchronization of Clock and localization of node; So research in routing protocol has increased tremendously.
In order to evaluate the LEA CH[2] p rotocol we have used the following performance metrics:
a) Energy Consumption: The mote‟s energy is dissipated due to sending the sense data to the sink node and to come up with an energy optimized protocol it‟s important to evaluate this metric.
b) Network Lifetime: Since in heterogeneous WSN motes with different resourced are used so advanced node should be selected to form the cluster head(CH) , so we will chec k the type of selection of Cluster Head. c) Latency: The latency of the network should be low or minimized o verall, so we check this metric a lso.
II. BAC KGROUND
The progress in MEMS technology has led to the development in WSN and the motes are power and resource constrained so to optimize the energy at various levels we need to have light knowledge on the energy depletion by the radio signal. The research in the low energy powered radio integrated circu it is on -going and this filed is highly motivated by the applications in mobile and embedded system. So to optimize the energy we must give a restriction to the duty cycle, wh ich is actually the percentage of the duration for which the rad io signal is active. For e xa mp le European Countries need to ma intain the duty cycle smaller than 10% for 434 Mh z band and less than 1% for 868 Mh z band.
The first order radio model[3] is used for the estimation of energy consumption by the radio signal fo r the Wireless Sensor Network.
A.THE FIR ST ORDER RA DIO M ODEL
When the mote need to send the sense data to the Cluster Head then the mote‟s energy is depleted by the Transmitter to transmit the package of „n‟ b its:
--- (1)
Where „ETx’ is the transmitter energy, „r‟ is the distance between the sender and receiver, „Etc’ is the energy
that radio circuit needs to spend in order to process „n‟ bits, „Eamp’ is the amplification energy.
The equation (1) can be fu rther elaborated as follo ws:
---(2)
Where „Etrans‟ is the transmission energy for single bit &∊a mp is the transceiver energy dissipation & „γ‟ is the Path loss component.
Path loss component (γ) is linked to mediu m of propagation and the value range from „2‟ to „4‟ where former value is used for free space propagation and later value is used for mu lti path propagation where there are some obstacles.
After transmitting the packet the receiver that is the Cluster Head needs to receive the packet and to receive the package of „n‟ bits the following energy is spent:
---(3)
Where ERx is the energy spent on receiving the signal, Erecvis the energy depletion for rece iving the single bit.
III.LEACHPRO TOCOL[5]
The Low Energy Adaptive Clustering Hiera rchy (LEA CH) routing protocol organized themselves in the form of clusters. Two types of clusters are formed :
E
Tx(
n
,
r
) =
E
tc(
n
) +
E
am p(
n
,
r
)
E
Tx(
n
,
r
) =
E
tc(
n
) +
E
am p(
n
,
r
)= n.E
trans+ n.
∊
amp.r
γE
Rx(
n
) =
R
rc(
n
) =
n
⋅
E
recv Intra Cluster: This cluster is formed by association of mote with a Cluster Head (CH).
Inter Cluster: This cluster is formed by the association of CH with the Base Station (Sin k Node).
All motes in the WSN other than the CH & SN senses the environment and send the sense data to the CH and on receiving the sense data the CH performs the data fusion technique to aggregate the data. The aggregated data is then send to the Base Station by the Cluster Head so as to reduce the netwo rk bandwidth & Energy dissipation in the nodes.
The LEA CH is self-organized& Se lf Adaptive protocol where the operation is based on the rounds and each round begins with the following stages:
a) Advertisement Phase: In this phase the node contend in the election process by choosing a random number in between 0 to 1 and then compare this value with the Threshold value (Tn). If the generated random number is less than Tn then that node is chosen as the Cluster Head(CH).
Where „P‟ is the desire % of Cluster Head fo r the Network, „r‟ is round number,„G‟ is the set of nodes that has not formed CH yet in the current epoch that is ( r mod 1/P).
b) Cluster Set Up Phase: After the fo rmer phase the non CH decides to form c luster with the selected CH based on the minimu m distance of the node (ni) to the CH using the Euclidean Distance Equation:
c) Steady State Phase: After forming the cluster the respective CH creates a schedule based on the number of nodes using TDMA. The non CH nodes turn off the radio signal until their turns came for data transfer to CH.
SN
CH
Diagra m:WSN N/W with motes, CH & SN.
The LEA CH Protocol process[6] is shown below:
The cluster head loses its energy rapidly compared to non -cluster head due to the following reasons:
In intr a cluster operations the CH energy depleted due to „ERx‟ as shown in equation (3).
In inter cluster act ivity the CH node energy depleted due to „Eda‟ that is the Aggregation energy for aggregating the sense data before transmitting it to the SN. In addition to Eda energy the CH expend the energy in „ETx‟ as shown in equation (2).
As discussed earlier the „ETx‟ energy is also dependent on the path loss component and due to which we compute the Threshold distance „d0= √ (Efs/ Emp) „ where „Efs‟ is the amplification co-efficient of free space and „Emp‟ is the amplification co-efficient of multi path. If the distance between the CH to the BS that is „d‟ is less than or equal to „d0‟ then the free space component is considered that is γ=2 else multi path component is considered that is γ=4.
IV.SIMULATION OF LEACH
To simulate the LEA CH protocol we have used MatLab R2009a and in the simu lation we have tried to figure out the deme rits of LEA CH protocol using the following input para meters. As discussed earlie r to evaluate the performance of LEA CH we have considered those performance metrics
A SIM ULATION PARAMETER
The following para meters were considered for simu lation:
a) The motes are randomly deployed so as to ease the deployment process and then to evaluate LEA CH in that environment.
b) We have considered the Heterogeneous WSN where we have two kinds of nodes:
Norma l nodes: These are the nodes having initia l energy E0 .
Advanced Node: These are the nodes having α times more energy than E0. c) We have placed the Sink Node or BS at the center of the area.
The other specific para meters are listed in the Table 1.
Table 1: Simulat ion Para meters.
Parame ter Parame ter Parame ter Parame ter
EDA=5 nJ/Bit Packet Size :4000 Bits Area=100 * 100 m2 ETx= 50 nJ/ Bit .
Rma x= 1200. m= 20 % of N. SN= (50,50)at Center ERx= 50 nJ/Bit.
α= 50 % of E0. m= 20 % of N. E0=0.25 J Efs= 10 pJ/Bit/ m2
N= 100. Emp= 0.0013 pJ/ Bit/ m4 P= 10 % o f N. Emp= 0.0013 pJ/ Bit/ m4
B EVALUATION OF SIM ULATION
The motes are deployed randomly and it can be analy zed fro m the fig 2. that the distribution is Uneven .
Fig 2.Random Node Deploy ment.Fig 3 Format ion of CH with the associated clusters.
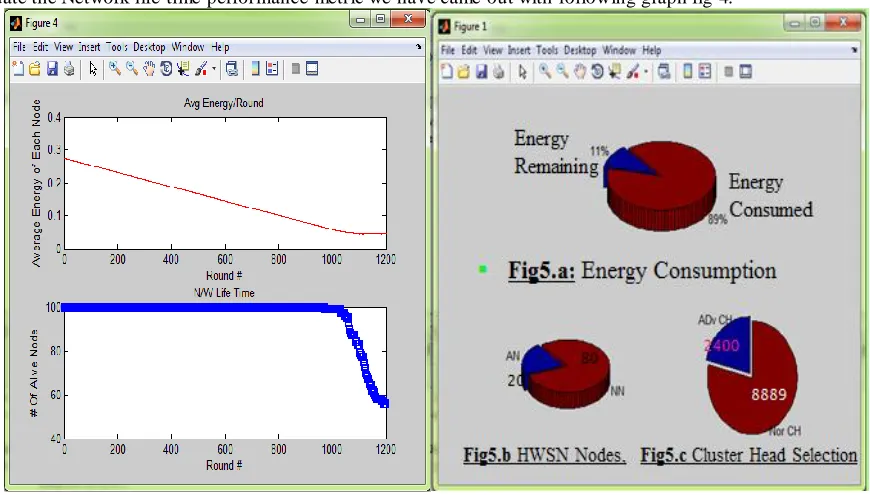
The above fig (3) shows the formation of Cluster Head which is shown in “* with green colored”. To evaluate the Network life time performance metric we have came out with following graph fig 4.
Fig. 4 Ene rgy depletion & Life time of N/W
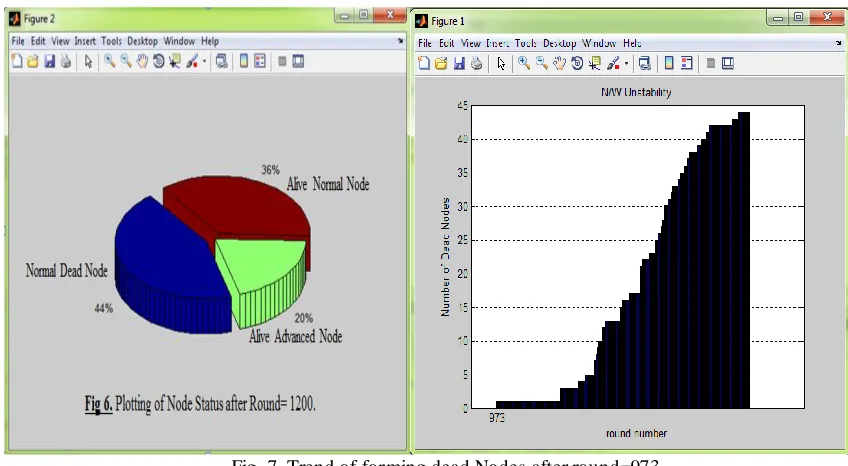
After running the simu lation with the given para meters at last we have the came out with the following graph fig 6.
Fig. 7. Trend of forming dead Nodes after round=973.
When we run the simulat ion for the last round r=1200 then we have co me out with the above graph figure 7.
V. CO NCLUSION
On the basis of our simulat ions we have come out with the following conclusions which are listed below:
i) In fig 5.(c) we have seen that in r=1200, “ 11289” CH were selected i.e an average of 9.4075 CH are selected per round and out of which only 2400 Advanced nodes were selected against 8889 Normal nodes, so an average of 2 Advanced node per round only.
So this is left for the scope of future study to make the electi on process be tter.
ii) While running the simu lation it has been noticed that sometimes no CH were selected fo r particular rounds that is round= ‘1196’ & ‘1200’; as the selection is based on the generation of random number between (0-1) & then comparison with a threshold value (Tn). So it can be possible for some rounds no CH may be selected & so the latency increase abruptly as no form of co mmunicat ion e xist.
So this is left for the scope of future study to lower the latenc y.
iii) LEA CH protocol is restricte d to small area as non CH to CH is single hop & CH to BS is also single hop, & using First order radio mode l, node’s dissipation energy is directly proportional to the Path Loss Component.
So this is left for the scope of future study to make LEACH be tter.
iv) LEA CH does not c onsider the residual energywhile selecting the CH, so although LEACH is dynamic but rotating the CH causes this issue & due to which the life-time of the node reduces.
So this is left for the scope of future study.
v) It has been noticed via the bar graph of figure= 6 that after the round 973 to 1200 the tende ncy of the de ad nodes incre ase exponentially.
So this is left for the scope of future study to re duce the rate of de ad node
REFERENCES
[1] Akyildiz LF, Su W, Sankarasubramaniam Y, Cayirci E. A survey on sensor networks. IEEE Communications Magazine, 2002, 40(8): 102~114.Vol.25, No.4: 114-124.
[2] R.A.Roseline and Dr.P.Sumathi, Energy Efficient Routing Protocol and Algorithms for Wireless Sensor Networks-A Survey. Global Journal of Computer Science and T echnology, vol.11, December 2011.
[3] Ian F. Akyildiz, Weilian Su, YogeshSankarasubramaniam, et al. Wireless Sensor Network: A survey [J].Computer Networks,2003,38(4):393-422. [4] Heinzelman W, Chandrakasan A, Balakrishnan H. Energy Efficient Communication Protocol for Wireless Microsensor Networks. In Proceedings of the 33rd Hawaii International Conference on System Sciences. Maui: IEEE Computer Society, 2000, Vol.2: 3005-3014. [5] Cui Li Ju, Hailing, Miao Yong, Li T ianpu, Liu Wei and Zhao Ze,Overview of Wireless Sensor Networks[J];Journal of Computer Research and Development;2005-01
[6] J. Yick, B. Mukherjee, and D. Ghosal, “Wireless sensor network survey,” Computer Networks,vol. 52, no. 12, pp. 2292-2330, Aug. 2008.
BIOGRAPHY
SYED TAZIRUL ILM is an Assistant Professor under the Co mputer Sc ience Depart ment, AIMT and has more than four years of teaching experience; he was also a Co mputer Trainee for one Year at IIT Gu wahati. He has co mpleted B.Tech fro m KIIT University &M.Tech (pursuing) from ASTU University . His research interests are WSN, DTN &CRN.