ECG SIGNAL PROCESSING WITH FIR DIGITAL FILTER BY
WINDOW TECHNIQUES
Mohandas Choudhary*
Ravindra Pratap Narwaria*
ABSTRACT
ECG plays a significant role in diagnosing most of the cardiac diagrams. So, it is desirable to filter the noisy ECG signal, particularly in the case of recording signals as weak as the ECG. This paper deals with some of the window techniques used to design FIR filter, different parameters like signal to noise ratio and power spectral density are calculated and compared for different window techniques. The results are observed and recorded using mat lab software and MIT-BIH arrhythmia data base.
Keywords:
Electrocardiogram, Window techniques, Input ECG Data Signal 228txt (MIII &
VI Lead), FIR digital filter, Average Power, Welch Power Spectrum Density and Signal to Noise Ratio (SNR).
1.
INTRODUCTION
One of the ways to diagnose heart diseases is to use electrocardiogram (ECG) signals. The function of the heart is to contract rhythmically and pump blood to the lungs for oxygenation and then pump this oxygenated blood into the general circulation. This perfect rhythm is
continuously maintained and signaled by the spread of electrical signals generated by the heart pacemaker, the Sinoatrial (SA) node. Detecting such electrical activity of the heart can
In Pan et al. proposed method Empirical Mode Decomposition was used for accurate removal of the baseline wander in ECG. The meaning of Base Line Drift noise is continuous drifting of ECG signal from base line. A suitable digital filter can be used to suppress the high-frequency embedded noise. The equiripple FIR low-pass filter by superimposing of the optimal method, the Butterworth IIR low-pass filter, the 8-point
moving-average filter, and the FIR filter designed by using a Kaiser window [7]. The
drift of the base line with respiration can be represented by a sinusoidal component at the frequency of respiration added to the ECG signal. The amplitude and the frequency of the sinusoidal component should be variables [12]. Some researchers have used analog filters for removal of the power line interference. S.Pooranchandra, N.kumarave[15], have used the wavelet coefficient threshold based hyper shrinkage function to remove power line frequency. Santpal Singh Dhillon and Saswat Chakrabarti[16], have used a simplified lattice based adaptive IIR Notch filter to remove power line interference. Hejjel L, used the analog digital notch filter for the reduction of the power line interference in the ECG signal for the heart rate variability analysis. The investigation addressed the analysis of the effects of AC interference and its filtering on the precision and accuracy of heart rate detection. This paper is concerned with finite impulse response filtering with noisy input and output measurements. A new least-squares (LS) based algorithm is proposed to estimate the FIR filter coefficients [13]. K.D. Chinchkhede, present the implementation of FIR filter with various window techniques [1], with reference of this paper we analysis of other window impulse function by using FDA tool and filter noisy ECG data signal.
2.
DIGITAL FIR FILTER
feedback (a recursive part of a filter), even though recursive algorithms can be used for FIR filter realization.
(a) Algorithm
Where h(n) impulse response of the ideal filter and ω(n) denotes the window.
(b) Chebyshevs Window Function
The Chebyshev window minimizes the Chebyshev norm of the side lobes for a main- lobe width 2ωc. The optimal Dolph-Chebyshev window transform can be written in close form as
The zero- phase Dolph – Chebyshev window, ω(n), is then computed as the inverse DFT of
. The α parameter control the side lobe level via the given formula
Thus, α = 2 gives side lobes which are 40db below the main lobe peak. Since the side lobes
(c) Nuttall window Function
Where N represents the width in samples of a discrete-time symmetrical window function and n is an integer with values .
(d) Tukey Window Function
Where N represents the width in samples of a discrete-time symmetrical window function and n is an integer with values .
3.
METHODOLOGY
In this paper reduce noise from ECG data signal. Input ECG Data signal 228txt(MIII & VI) collected from MIT-BIH. Data signal 228txt has the 3600 data samples. The first group is intended to serve as a representative sample of the variety of waveforms and artifact that an arrhythmia detector might encounter in routine clinical use. The band pass-filtered signals were digitized at 360 Hz per signal relative to real time using hardware constructed at the MIT Biomedical Engineering Center and at the BIH Biomedical Engineering Laboratory. The sampling frequency was chosen to facilitate implementations of 60 Hz (mains
frequency) digital notch filters in arrhythmia detectors. Since the recorders were battery-powered, most of the 60 Hz noise present in the database arose during playback. Sampling
Figure 3. Impuse Response of Chevyshevs Filter using FDA tool
Figure 4. Poles and Zero using Nuttal Window FIR Filter
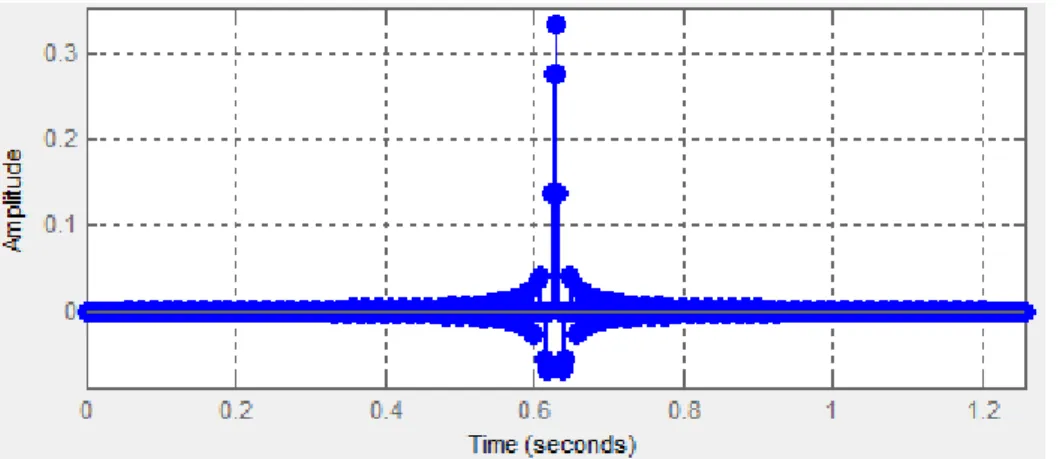
Figure 6. Noisy Data signal and Filtered ECG Data Signal using window techniques of MIII Lead Data
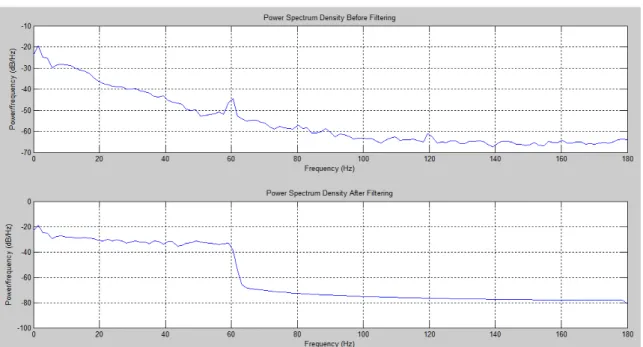
Original data signal with AWGN noise and the filter data signal spectrum analysis at 60 Hz frequency shown by the Welch power spectrum diagram in fig. 5. Signal to Noise power
ratio after with various window shown in table 1. Signal to noise ratio of the filtered signal calculated by
Where µ is mean and σ standard deviation of noisy signal.
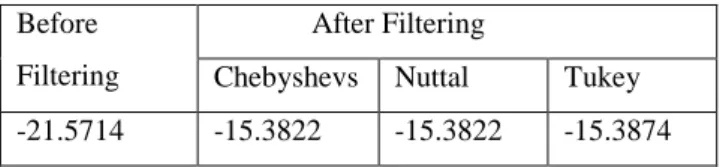
Table 1. SNR for various windows of 228txt (MIII)
Table 2. Average Power for various windows
4.
CONCLUSION
Figure 6. shows that noise has been reduced when ECG signal is filtered using FIR filter. Results have been concluded for these windows Chebyshevs, Nuttal and Tukey. Table1, shows the comparison of SNR for data 228txt(MIII Lead) and table2 show the comparasion of Average Power for data from the table are find that average power for Tukey window is more than the Chebyshevs and Nuttal window.
REFERENCES
[1] K.D. Chinchkhede “On the implementation of FIR Filter with various window for enhancement of ECG signal”, IJEST Vol.3 No.3 March 2011.
[2]
[3] Mahesh Chavan, R.A. Agrawal,M.D. Uplane,“FIR Equiripple digital filter for reduction of power line interference in the ECG Signal”,ISPRA 2008.
[4] Sornmo,L.,Laguna,P. “Bioelectrical Signal Processing in Cardiac and Neurological Application”,Elsevier,Amsterdam 2005.
[5] R.M. Rangayyan, “biomedical Signal Analysis: A Case-study Approach”, New York, NY: Wiley, ch.3, 2002.
[6] E.Farahabadi, “Noise Removal from Electrocardiogram signal Employing an artificial Neural Network in Wavelet Domain”, IEEE 2009.
[7] Ying-Wen Bai, “The Combination of Kaiser Window and Moving Average for the Low-Pass Filtering of the Remote ECG Signal”, IEEE 2004.
[8] Ferdjallah M,Barr RE., “Frequency domain digital filtering techniques for the removal of power line noise with application to the electrocardiogram”, comput Biomed Res.1990.
Before Filtering
After Filtering
Chebyshevs Nuttal Tukey
-21.5714 -15.3822 -15.3822 -15.3874
Before Filtering
After Filtering
Chebyshevs Nuttal Tukey
[9] Yong Lian and Poh Choo Ho, “ECG Noise Reduction using multiplier free FIR digital filter”, IEEE 2004.
[10] Syed Zahurul Islam, Syed Zahidul Islam, Razali Jidin, “Performance Study of Adaptive Filtering Algorithms for Noise Cancellation of ECG Signal”, IEEE 2009.
[11] Jamshaid K.,Akram O., Sabir F., “Application of Adaptive and Non Adaptive Filter in ECG Signal Processing”.
[12] Youcef Ferdi, Improved Lowpass Differentiator for Physiological Signal Processing”,CSNDSP 2010.
[13] Wei Xing Zheng,”A Least- Squares based algorithm for FIR filtering with noisy data”, IEEE 2003.
[14] Choy TT, Leung PM., “Real time microprocessor-based 50 Hz notch filter for ECG”, JBiomed Eng. 1988May;10(3):285-8.
[15] S.Pooranchandra, N.Kumaravel, “A novel method for elimination of power line frequency in ECG signal using hyper shrinkage function”, Digital Signal Processing, Volume18, Issue 2, March 2008.