ARTICLE
Trans-ethnic Meta-analysis and Functional Annotation Illuminates
the Genetic Architecture of Fasting Glucose and Insulin
Ching-Ti Liu,1,84,* Sridharan Raghavan,2,3,4,84 Nisa Maruthur,5,6,7,84 Edmond Kato Kabagambe,8,84 Jaeyoung Hong,1 Maggie C.Y. Ng,9,10 Marie-France Hivert,11,12,13 Yingchang Lu,14,15 Ping An,16 Amy R. Bentley,17 Anne M. Drolet,18 Kyle J. Gaulton,19 Xiuqing Guo,20 Loren L. Armstrong,21 Marguerite R. Irvin,22 Man Li,7 Leonard Lipovich,18,23 Denis V. Rybin,1 Kent D. Taylor,20
Charles Agyemang,24 Nicholette D. Palmer,9,25 Brian E. Cade,26 Wei-Min Chen,27 Marco Dauriz,28 Joseph A.C. Delaney,29 Todd L. Edwards,8 Daniel S. Evans,30 Michele K. Evans,31 Leslie A. Lange,32 Aaron Leong,2 Jingmin Liu,33 Yongmei Liu,34 Uma Nayak,27 Sanjay R. Patel,35 Bianca C. Porneala,2 Laura J. Rasmussen-Torvik,36 Marieke B. Snijder,24 Sarah C. Stallings,83 Toshiko Tanaka,37
Lisa R. Yanek,38 Wei Zhao,39 Diane M. Becker,38,40 Lawrence F. Bielak,39 Mary L. Biggs,41,42
Erwin P. Bottinger,14 Donald W. Bowden,9,10,25 Guanjie Chen,17 Adolfo Correa,43 David J. Couper,44 Dana C. Crawford,45 Mary Cushman,46 John D. Eicher,47,48 Myriam Fornage,49 Nora Franceschini,50 Yi-Ping Fu,51 Mark O. Goodarzi,52 Omri Gottesman,14 Kazuo Hara,14,53,54 Tamara B. Harris,55
Richard A. Jensen,42 Andrew D. Johnson,48 Min A. Jhun,39 Andrew J. Karter,56 Margaux F. Keller,57 Abel N. Kho,21 Jorge R. Kizer,58,59 Ronald M. Krauss,60 Carl D. Langefeld,61,62 Xiaohui Li,20
(Author list continued on next page)
Knowledge of the genetic basis of the type 2 diabetes (T2D)-related quantitative traits fasting glucose (FG) and insulin (FI) in African ancestry (AA) individuals has been limited. In non-diabetic subjects of AA (n¼20,209) and European ancestry (EA; n¼57,292), we per-formed trans-ethnic (AAþEA) fine-mapping of 54 established EA FG or FI loci with detailed functional annotation, assessed their rele-vance in AA individuals, and sought previously undescribed loci through trans-ethnic (AAþEA) meta-analysis. We narrowed credible sets of variants driving association signals for 22/54 EA-associated loci; 18/22 credible sets overlapped with active islet-specific enhancers or transcription factor (TF) binding sites, and 21/22 contained at least one TF motif. Of the 54 EA-associated loci, 23 were shared between EA and AA. Replication with an additional 10,096 AA individuals identified two previously undescribed FI loci, chrXFAM133A
(rs213676) and chr5PELO(rs6450057). Trans-ethnic analyses with regulatory annotation illuminate the genetic architecture of glycemic traits and suggest gene regulation as a target to advance precision medicine for T2D. Our approach to utilize state-of-the-art functional annotation and implement trans-ethnic association analysis for discovery and fine-mapping offers a framework for further follow-up and characterization of GWAS signals of complex trait loci.
Introduction
The global burden of type 2 diabetes (T2D [MIM: 125853]) is borne disproportionately by populations
with little genetic European ancestry (EA), especially
Afri-can AmeriAfri-cans.1Although environmental and behavioral
factors account for a large portion of these observed
race-ethnic disparities, genetic variation also contributes2,3
1Department of Biostatistics, School of Public Health, Boston University, Boston, MA 02118, USA;2Division of General Internal Medicine, Massachusetts
General Hospital, Harvard Medical School, Boston, MA 02114, USA;3Department of Veterans Affairs Medical Center, Eastern Colorado Health Care System, Denver, CO 80220, USA;4Division of General Internal Medicine, Department of Medicine, University of Colorado School of Medicine, Denver, CO 80220,
USA;5Division of General Internal Medicine, Johns Hopkins University School of Medicine, Baltimore, MD 21287, USA;6Welch Center for Prevention,
Epidemiology, and Clinical Research, Johns Hopkins University, Baltimore, MD 21287, USA;7Department of Epidemiology, Johns Hopkins University
Bloomberg School of Public Health, Baltimore, MD 21287, USA;8Division of Epidemiology, Department of Medicine, School of Medicine, Vanderbilt
Uni-versity Medical Center, Nashville, TN 37203, USA;9Center for Genomics and Personalized Medicine Research, Wake Forest University School of Medicine,
Winston-Salem, NC 27157, USA;10Center for Diabetes Research, Wake Forest University School of Medicine, Winston-Salem, NC 27157, USA;11
Depart-ment of Population Medicine, Harvard Pilgrim Health Care Institute, Harvard Medical School, Boston, MA 02215, USA;12Diabetes Unit, Massachusetts
General Hospital, Boston, MA 02114, USA;13Department of Medicine, Universite de Sherbrooke, Sherbrooke, QC J1G 0A2, Canada;14The Charles
Bronf-man Institute for Personalized Medicine, The Icahn School of Medicine at Mount Sinai, New York, NY 10029, USA;15The Genetics of Obesity and Related
Metabolic Traits Program, The Icahn School of Medicine at Mount Sinai, New York, NY 10029, USA;16Division of Statistical Genomics, Department of
Ge-netics, School of Medicine, Washington University, St Louis, MO 63108, USA;17Center for Research on Genomics and Global Health, National Human
Genome Research Institute, NIH, Bethesda, MD 20892, USA;18Center for Molecular Medicine and Genetics, School of Medicine, Wayne State University,
Detroit, MI 48201, USA;19Wellcome Trust Centre for Human Genetics, University of Oxford, Oxford OX3 7BN, UK;20Institute for Translational Genomics
and Population Sciences, Department of Pediatrics, Los Angeles Biomedical Research Institute, Harbor-UCLA Medical Center, Torrance, CA 90502, USA;
21Feinberg School of Medicine, Northwestern University, Chicago, IL 60611, USA;22Department of Epidemiology, School of Public Health, University
of Alabama – Birmingham, Birmingham, AL 35294, USA;23Department of Neurology, School of Medicine, Wayne State University, Detroit, MI 48201,
USA;24Department of Public Health, Academic Medical Center Amsterdam, Meibergdreef 15, 1105 AZ Amsterdam, the Netherlands;25Department of
Biochemistry, Wake Forest University School of Medicine, Winston-Salem, NC 27157, USA;26Division of Sleep and Circadian Disorders, Brigham and
(Affiliations continued on next page)
but remains understudied in persons of mostly or all
ge-netic African ancestry (AA).2–4A few studies have
exam-ined the association signals of EA-associated loci with levels of fasting glucose (FG) and insulin (FI) in ethnic
minorities, but on a relatively small scale.5–7
Genome-wide association studies (GWASs) with meta-analysis in EA populations have identified more than 50 loci
associ-ated with T2D-relassoci-ated quantitative traits (QTs),
particu-larly levels of fasting glucose (FG) and insulin (FI).8
Asso-ciated SNPs at these loci are common, with modest effect
sizes.8–10 At most SNPs the causal action remains
un-known, because most lie in non-coding regions of the genome. Now, these have been annotated for regulatory
function.11–14 We collected a large sample of AA
Women’s Hospital, Harvard Medical School, Boston, MA 02115, USA;27Center for Public Health Genomics, Department of Public Health Sciences, School
of Medicine, University of Virginia, Charlottesville, VA 22908, USA;28Division of Endocrinology, Diabetes & Metabolism, Department of Medicine,
Uni-versity of Verona, 37126 Verona, Italy;29Department of Epidemiology, University of Washington, Seattle, WA 98195, USA;30California Pacific Medical
Cen-ter Research Institute, San Francisco, CA 94107, USA;31Health Disparities Research Section, Laboratory of Epidemiology and Population Sciences, National
Institute on Aging, NIH, Baltimore, MD 21224, USA;32Department of Genetics, University of North Carolina, Chapel Hill, NC 27607, USA;33Fred
Hutch-inson Cancer Research Center, Seattle, WA 98109, USA;34Center for Human Genetics, Division of Public Health Sciences, Wake Forest University School of
Medicine, Winston-Salem, NC 27157, USA;35Department of Medicine, University of Pittsburgh, Pittsburgh, PA 15213, USA;36Department of Preventive
Medicine, Feinberg School of Medicine, Northwestern University, Chicago, IL 60611, USA;37Translational Gerontology Branch, National Institute of Aging at Harbor Hospital, Baltimore, MD 21225, USA;38GeneSTAR Research Program, Division of General Internal Medicine, Department of Medicine, Johns
Hopkins University, Baltimore, MD 21287, USA;39Department of Epidemiology, School of Public Health, University of Michigan, Ann Arbor, MI
48109, USA;40Department of Health Policy and Management, Johns Hopkins University Bloomberg School of Public Health, Baltimore, MD 21287,
USA;41Department of Biostatistics, University of Washington, Seattle, WA 98195, USA;42Cardiovascular Health Research Unit, Department of Medicine,
School of Medicine, University of Washington, Seattle, WA 98195, USA;43Department of Medicine, University of Mississippi Medical Center, Jackson, MS
39216, USA;44Collaborative Studies Coordinating Center, Department of Biostatistics, Gillings School of Global Public Health, University of North
Car-olina, Chapel Hill, NC 27514, USA;45Department of Epidemiology and Biostatistics, Institute for Computational Biology, Case Western Reserve University,
Cleveland, OH 44106, USA;46Department of Medicine and Pathology, University of Vermont, College of Medicine, Burlington, VT 05405, USA;47National
Heart, Lung, and Blood Institute’s Framingham Heart Study, Framingham, MA 01702, USA;48Population Sciences Branch, Division of Intramural Research, National Heart, Lung, and Blood Institute, NIH, Framingham, MA 01702, USA;49Institute of Molecular Medicine and Human Genetics Center, University
of Texas Health Science Center at Houston, Houston, TX 77030, USA;50Department of Epidemiology, University of North Carolina, Chapel Hill, NC 27514,
USA;51Cardiovascular Epidemiology and Human Genomics Branch, National Heart, Lung, and Blood Institute, NIH, Framingham, MA 01702, USA;52
Di-vision of Endocrinology, Diabetes & Metabolism, Cedars-Sinai Medical Center, Los Angeles, CA 90048, USA;53Department of Diabetes and Metabolic
Dis-eases, Graduate School of Medicine, The University of Tokyo, Tokyo 113-8655, Japan;54Department of Diabetes, Endocrinology, and Metabolism, Tokyo
Medical University, Tokyo 163-0023, Japan;55Laboratory of Epidemiology and Population Sciences, NIH, Bethesda, MD 20892, USA;56Division of
Research, Kaiser Permanente, Northern California Region, Oakland, CA 94612, USA;57Department of Genetics and Pharmacogenomics, Merck Research
Laboratories, 33 Avenue Louis Pasteur, Boston, MA 02115, USA;58Department of Medicine, Albert Einstein College of Medicine, Montefiore Medical
Cen-ter, Bronx, NY 10461, USA;59Department of Epidemiology and Population Health, Albert Einstein College of Medicine, Bronx, NY 10461, USA;60
Chil-dren’s Hospital Oakland Research Institute, Oakland, CA 94609, USA;61Center for Public Health Genomics, Wake Forest University School of Medicine,
Winston-Salem, NC 27157, USA;62Department of Biostatistical Sciences, Wake Forest University School of Medicine, Winston-Salem, NC 27157, USA;
63Department of Epidemiology and Biostatistics, Case Western Reserve University, Cleveland, OH 44106, USA;64Department of Epidemiology, Brown
Uni-versity, Providence, RI 02912, USA;65Department of Medicine, Brown University, Providence, RI 02903, USA;66Division of Geriatrics/Gerontology,
Depart-ment of Medicine, University of Mississippi Medical Center, Jackson, MS 39216, USA;67Tobago Health Studies Office, Scarborough, Tobago, Trinidad and
Tobago;68Department of Epidemiology, University of Pittsburgh, Pittsburgh, PA 15213, USA;69Behavioral Epidemiology Section, Laboratory of
Epidemi-ology & Population Science, Intramural Research Program, National Institute on Aging, NIH, Baltimore, MD 21224, US;70Division of Epidemiology and
Community Health, School of Public Health, University of Minnesota, Minneapolis, MN 55455, USA;71Division of Public Health Sciences, Wake Forest
University School of Medicine, Winston-Salem, NC 27157, USA;72University of Kentucky College of Public Health, Lexington, KY 40563, USA;73
Labora-tory of Neurogenetics, National Institute on Aging, NIH, Bethesda, MD 20892, USA;74The New York Academy of Medicine, New York, NY 10029, USA; 75
Department of Health Services, University of Washington, Seattle, WA 98195, USA;76Group Health Research Institute, Group Health Cooperative, Seattle, WA 98101, USA;77Department of Physiology and Biophysics, University of Mississippi Medical Center, Jackson, MS 39216, USA;78The Mindich Child
Health and Development Institute, The Icahn School of Medicine at Mount Sinai, New York, NY 10029, USA;79Center for Human Genetic Research,
Mas-sachusetts General Hospital, Boston, MA 02114, USA;80Programs in Metabolism and Medical & Population Genetics, Broad Institute, Cambridge, MA
02142, USA;81Department of Medicine, Harvard Medical School, Boston, MA 02115, USA;82Institute of Translational Medicine, Department of
Biostatis-tics, University of Liverpool, Liverpool L69 3BX, UK;83Vanderbilt Institute for Clinical and Translational Research, Vanderbilt University Medical Center,
Nashville, TN 37203, USA
84These authors contributed equally to this work 85Deceased
*Correspondence:[email protected](C.-T.L.),[email protected](J.B.M.) http://dx.doi.org/10.1016/j.ajhg.2016.05.006.
Jingling Liang,63Simin Liu,64,65William L. Lowe, Jr.,21Thomas H. Mosley,66Kari E. North,50 Jennifer A. Pacheco,21Patricia A. Peyser,39Alan L. Patrick,67Kenneth M. Rice,41Elizabeth Selvin,6,7
Mario Sims,43Jennifer A. Smith,39Salman M. Tajuddin,31Dhananjay Vaidya,7,38Mary P. Wren,25Jie Yao,20 Xiaofeng Zhu,63Julie T. Ziegler,61,62Joseph M. Zmuda,68Alan B. Zonderman,69Aeilko H. Zwinderman,24 AAAG Consortium, CARe Consortium, COGENT-BP Consortium, eMERGE Consortium, MEDIA
Consortium, Adebowale Adeyemo,17Eric Boerwinkle,49Luigi Ferrucci,37M. Geoffrey Hayes,21 Sharon L.R. Kardia,39Iva Miljkovic,68James S. Pankow,70Charles N. Rotimi,17Michele M. Sale,27
Lynne E. Wagenknecht,71Donna K. Arnett,72Yii-Der Ida Chen,20Michael A. Nalls,73MAGIC Consortium, Michael A. Province,16W.H. Linda Kao,7,85David S. Siscovick,29,42,74Bruce M. Psaty,29,42,75,76
individuals for genetic study and, taking advantage of differences in linkage disequilibrium (LD) patterns across EA and AA, used a trans-ethnic analytic approach to
improve mapping resolution15 and narrow the number
of potential causal SNPs at associated loci.15,16 We then
characterized predicted SNP function with detailed anno-tation information from diverse sources. We hypothe-sized that a trans-ethnic approach would identify SNPs with high likelihood of having regulatory, causal func-tion, with results illuminating mechanisms underlying glycemic regulation in African Americans as well as whites of European ancestry.
We created the African American Glucose and Insulin Genetic Epidemiology (AAGILE) Consortium, with up to 20,209 AA individuals from 16 cohorts, to conduct a fixed effects meta-analysis of association summary statis-tics at 3.3 million (HapMap2) SNPs for levels of FG and body mass index (BMI)-adjusted FI. We then combined meta-analysis results from AAGILE with those from the EA Meta-Analyses of Glucose and Insulin-related traits
Consortium (MAGIC, n¼ 57,292)10with three aims in
mind: (1) conduct trans-ethnic fine-mapping of 54 T2D QT loci (36 FG, 16 FI, 2 associated with both FG and FI) identified from EA and combine fine-mapping
with annotation resources including RegulomeDB,
ENCyclOpedia of DNA Elements (ENCODE), Islet Regu-lome, and Functional ANnotation of The mammalian
genOMe Consortium (FANTOM);11–14(2) assess the
bio-logic relevance (allelic heterogeneity, transferability, pop-ulation genetic selection, and consistency of association with T2D or insulin resistance traits) of the 54 EA FG and FI loci in AA individuals; and (3) identify additional FG and FI variants by combining association results from AAGILE and MAGIC using Meta-Analysis of
TRans-ethnic Association Studies (MANTRA)15 followed by de
novo or in silico replication in additional AA samples (n up to 10,096) for 62 potential additional SNPs that met pre-specified significance levels from the trans-ethnic meta-analysis. The study design is illustrated in Figure S1and characteristics of each participating cohort
are described inTable S1.
Material and Methods
Research Participants
A total of 20,209 (for FG) and 17,871 (for FI) non-diabetic men and women of African ancestry (AA) from 16 cohorts participated in stage 1 (Table S1). Additionally, up to 10,096 (for FG) and 6,669 (for FI) non-diabetic individuals from 14 cohorts were included in a stage 2 replication analyses. Participants were excluded from this study if they had a diagnosis of T2D by a physician, were on any diabetes treatment, or had a FG concentration equal to or greater than 7 mmol/L. HbA1c levels were not used as diagnostic criteria. FG and FI GWAS data for 57,292 (FG) and 52,328 (FI) EA individuals were obtained from MAGIC.10 Each participating
study has obtained institutional review board approval and all subjects provided written informed consent.
Genetic Variants
Genotyping was conducted in each cohort using commercially available genome-wide SNP arrays with quality control criteria for variants before imputation listed inTable S1. In all stage 1 discovery analyses, imputation was performed to infer ungeno-typed variants and fill in missing genotypes. We used phased haplotype data from the CEU and YRI HapMap phase 2 samples for the majority of contributing studies, using MACH17 or
IMPUTE2.18 Variants with lower imputation quality scores (MACHr2< 0.30 or IMPUTE2 information score< 0.40) were
excluded from further analyses. Approximately 3.3 million directly genotyped or imputed SNPs, including ~78,000 from the X chromosome, passed the quality control filters and were evalu-ated for association.
Traits and Covariates
In all cohorts, fasting blood samples were obtained from par-ticipants after an overnight (R8 hr) fast. Detailed descriptions of study-specific FG and FI measurements are given in
Table S1. Analyses of untransformed levels of FG and natural logarithm-transformed FI were adjusted for age, age squared, sex, and principal components (PC) for ancestry. In addition, we adjusted FI levels for BMI to reduce confounding by obesity.10 SNP-trait associations were tested using additive ge-netic models. Additional cohort-specific covariates (like study center for cohorts with multiple sites or relatedness for studies containing families) were included at the discretion of each cohort (Table S1).
Overview of Study Design and Analysis Strategy The overall study design is shown inFigure S1. We first performed fixed-effect meta-analyses of FG and FI in AA samples. We then conducted trans-ethnic meta-analyses by combining the fixed-ef-fect meta-analysis results from AAGILE with MAGIC. We fine-mapped FG and FI loci previously identified in EA by constructing 99% credible sets.15 Second, we used results from the
fixed-effect meta-analysis in AA to assess whether FG and FI loci identified in EA populations have genetic concordance or biolog-ical relevance in AA. Third, we carried forward 62 SNPs (not previ-ously described to be associated with FG or FI in persons of EA) based on low fixed-effect meta-analysis p values in AA or high log-Bayes factor (log(BF)) in the combined AA and EA trans-ethnic analysis for follow-up in additional non-diabetic samples of AA to identify additional FG and FI association signals. Specifically, the threshold for SNP promotion to replication was a fixed-effect meta-analysis p<10–6in AA samples, or p<10–5with log(BF) >5 in MANTRA. Meta-analyses were performed at two different sites and summary statistics were crosschecked to ensure consis-tency of results.
Meta-analysis of Samples from AAGILE and MAGIC Consortia
Each participating study from the AAGILE consortium performed a cohort-specific association analysis under an additive genetic model to test the genetic association of each genetic variant with FG and FI. The cohort-specific genome-wide association re-sults were corrected with genomic control, unlesslGC<1, before
To leverage differential patterns of LD between common vari-ants in EA and AA populations, we meta-analyzed GWAS results from AA in AAGILE and previously published EA results from MAGIC10 using the Meta-ANalysis of Trans-ethnic Association
Studies (MANTRA) software.15,20The results from MANTRA were used to fine-map the 54 loci (36 FG, 16 FI, 2 associated with both FG and FI) previously identified in EA samples and to priori-tize variants for discovery of previously undescribed variants asso-ciated with FG and FI in AA samples.
Construction of 99% Credible Sets
To improve fine-mapping resolution, we first constructed 99% credible sets for previously reported FG and FI loci identified in EA samples (36 FG, 16 FI, 2 associated with both FG and FI).8–10
We identified the genomic region 250 kb upstream and 250 kb downstream of the lead SNP from the EA meta-analysis and defined BFk, obtained from MANTRA analysis, as the Bayes factor
for SNP k. We calculated the posterior probability that SNP k is functional or tagging an unobserved causal SNP byBFk=PiBFi,
where i indexes SNPs in the locus of interest. The 99% credible sets are the collection of the minimum number of variants providing a cumulative posterior probability greater or equal to 0.99 for representing the causal variant at a given locus.21
Annotation of Credible Set SNPs
We focused our annotation analysis on loci that showed a 99% credible set reduction of at least 20% in the length of the genomic interval spanned by the variants in the credible set or in the num-ber of variants included in the credible set (13 FG, 8 FI loci, and 1 locus for both FG and FI). When examining the distribution of credible set reduction across all 54 FG and FI loci, we noted that there appeared to be a natural break point between 20% and 12%, so we selected 20% reduction as a threshold defining loci with substantial reduction. At these loci, we classified SNPs in the credible set into two groups: one group with SNPs included in the 99% credible set from the trans-ethnic fine-mapping with MANTRA and a second group that included only SNPs that were included in the 99% credible set using EA samples (MAGIC) but were excluded from the trans-ethnic 99% credible set. For brevity, we henceforth refer to these categories of SNPs as the ‘‘narrowed sets’’ and ‘‘excluded sets,’’ respectively.
To compare functional annotation of the narrowed versus excluded credible sets, we annotated SNPs from the narrowed and excluded sets separately using the HaploReg tool that searches for dbSNP annotation (synonymous substitution, non-synony-mous substitution, lying within an intron, 50 UTR, 30 UTR, or lncRNA, conservation in mammals, or having unknown position or function), genomic position, distance to the nearest named known protein-coding gene, eQTL data, and transcription factor motif, transcription factor binding site (TFBS), DNASe hypersensi-tivity (DHS), and histone marks associated with promoters and en-hancers derived from the ENCODE and Roadmap Epigenomics consortia.12We dichotomized the data from HaploReg for each SNP in the narrowed and excluded sets based on whether there was evidence of each specific annotation. To compare the narrow and excluded sets of SNPs for each trait, we performed a Fisher’s exact test to assess differences in proportions of SNPs in each set with a specific annotation characteristic.
We visually examined overlap between trait association and reg-ulatory annotation by plotting association statistics and regulato-ry data together. For each of the 22 loci with a reduction in the size
of at least 20% (either length of or the count of SNPs included in) of the 99% credible set after trans-ethnic analysis, we used Regulo-meDB to generate a single numeric score summarizing the strength of regulatory data associated with each SNP in the locus (within 250 kb on either side of the index SNP for that locus from MAGIC).11In brief, RegulomeDB uses data from ENCODE
and other published literature to annotate SNPs based on overlap with TFBS, TF motifs, DHS, eQTLs, and promoter histone marks and creates a score for each SNP ranging from 1 to 7, with 1 corre-sponding to the strongest degree of regulatory annotation, 6 cor-responding to the weakest degree of regulatory annotation, and 7 representing no data available. We then used statistical software R to make regional association plots as described above using the log(BF) for each SNP as the association statistic, with the color of each plotted SNP corresponding to its RegulomeDB score and the size of each plotted SNP corresponding to LD with the MAGIC index SNP in the YRI population. Finally, to visually examine over-lap between the 99% credible regions at these 22 loci and regula-tory data derived from pancreatic islets, we used the Islet Regu-lome Browser to generate plots with the same coordinates as represented in the regional plots and aligned the schematic repre-sentation of islet-derived regulatory annotation from the Islet Reg-ulome Browser to the regional association plot.13
We performed additional annotation analyses for the narrowed set (from the trans-ethnic meta-analysis). The starting and ending chromosome position of the 99% credible region from the trans-ethnic analysis for each of the 22 loci with substantially reduced 99% credible sets were entered into the Islet Regulome Browser, and we cataloged the presence/absence of binding sites for five transcription factors (FOXA2, MAFB, NKX2.2, NKX6.1, PDX1) or the insulator protein CTCF, and histone marks associated with promoters, active enhancers, and inactive enhancers.11,13 In
addition to examining overlap between credible set SNPs and reg-ulatory annotation, we also manually annotated the credible set intervals for the 22 loci with substantially reduced 99% credible sets. The genomic interval for each narrowed trans-ethnic credible set was examined in the UCSC Genome Browser, and we cataloged RNA expression, DHS sites, TFBS, and promoter and enhancer his-tone marks in cell types relevant to FG and FI, namely liver, pancreatic, adipose, and muscle.
Genomic Annotation Enrichment Analysis
We tested for enrichment of chromatin state marks and TFBS using all variants in the trans-ethnic meta-analysis credible sets. We pooled chromatin states for promoter (TssA, TssFlnk) and enhancer (EnhA, EnhWk) elements for 93 cell types (after excluding cancer lines) from the Roadmap Epigenomics Con-sortium22 and used TF binding data for 165 proteins from
Interrogation of Transferability across Populations We investigated the transferability to AA of EA FG- and FI-associ-ated SNPs and loci. To evaluate SNP transferability, we tested in AA the association of index FG and FI SNPs from EA individuals in MAGIC8–10 (i.e., EA FG or FI SNPs with p< 53 10–8). We
defined SNP transferability as an EA index SNP showing in AA an association that was statistically significant (p< 0.05) and consistent in direction of effect as in the EA meta-analysis. To eval-uate locus transferability, given differences in local LD structure across populations, we also interrogated the flanking5250 kb re-gions of the index SNP in AA to search for any SNPs with a smaller association p than the EA index SNP. For locus transferability, we used a Bonferroni corrected p to determine the significance for each locus by adjusting for the effective number of independent tests within that locus, using the Li and Ji approach.24
Conditional Analysis of Signals with Significant SNP Associations in AA
We performed approximate conditional association analyses at loci with significant QT associations in AAGILE in order to test whether the associated AAGILE SNP was the same association signal as the MAGIC SNP. We used genome-wide complex trait analysis (GCTA)25for this analysis, because it allows approximate
conditional analyses in results from meta-analysis without the need for individual cohort data to conduct the tests. GCTA approximated the variance-covariance matrix of genotype using estimated allele frequency from the meta-analysis results and LD between SNPs from a reference sample. We calculated the associa-tion of the AA best SNP condiassocia-tional on the EA index SNP within the same locus in AA samples.
Concordance Analysis across Ancestry Groups
For this analysis, we considered SNPs that passed QC and had a MAF>1% in both EA- and AA-specific meta-analyses. We further excluded (1) EA-associated FG or FI loci, defined as those lying 500 kb upstream or downstream of previously reported SNPs for each loci as described,16and (2) AT/GC SNPs to avoid the potential
bias introduced by the strand misalignment between EA- and AA-specific meta-analysis. We then classified all the remaining SNPs into categories based on the association p value in the MAGIC EA samples: p%0.01, 0.01<p%0.5, and 0.5<p%1. For the SNPs within each category, we then selected a set of inde-pendent SNPs by identifying the most significant SNP, omitting the SNPs within 500 kb region apart from the most significant SNP, and then repeating this process until there were no more SNPs left. We then determined the direction of effect for the EA trait-raising allele between EA and AA samples and we calculated the proportion of these selected SNPs that share the same direction of effect. To determine the significance of the excess in concor-dance (with 50% expected), we then conducted one-sided bino-mial tests.
Population Differentiation and Natural Selection at QT Loci
We applied several approaches to evaluate population differentia-tion and natural selecdifferentia-tion at index FG or FI SNPs, using the trait-raising allele in EA as the risk allele. First, we compared the risk-allele frequencies in EA versus AA by calculating the absolute value difference between the allele frequency in EA and the risk-allele frequency in AA for each index SNP. Second, we used Wright’s fixation index26(F
st) to measure the degree of the
popu-lation differentiation due to genetic drift and reflected by the divergent allele frequencies. A value of Fstlying in range of 0 to
0.05 indicates little genetic differentiation; a value 0.05 to 0.15, moderate differentiation; and a value greater than 0.15, greater population differentiation.27,28We calculated Fstusing risk-allele
frequencies obtained from AAGILE cohorts for AAs and from MAGIC8–10 for EAs. We also calculated the F
st using CEU and
YRI HapMap2 data from two samples of equal size to ensure that the imbalance in sample size of our EA and AA samples does not obscure the population differentiation at any locus. Third, we used Haplotter29 to calculate the integrated haplotype score
(iHS) in HapMap2 data to measure the amount of extended haplo-type homozygosity and hence the evidence of recent positive se-lection at the index SNP. Fourth, we compared the effect alleles from the index SNP of each locus against the human genome to determine whether it was the major or minor allele using the UCSC Genome Browser GRCh37/hg19 version, produced by the Genome Reference Consortium in 2009.30
Associations of QT Loci with T2D and Insulin Resistance-Related Traits in AA Individuals
As described below, we assembled new African ancestry cohort data sources for triglycerides and initiated collaborations with new and existing consortia for body mass index (BMI), waist-to-hip ratio adjusted for BMI (WHRadjBMI), systolic and diastolic blood pressure, hypertension (HTN), and low-density and high-density lipoprotein cholesterol (LDL-C and HDL-C) to investigate the association of T2D QT SNPs with T2D and insulin resistance-related traits (BMI, WHRadjBMI, HTN, LDL-C, HDL-C, and triglyc-erides) in AA individuals. Specifically, we investigated the associa-tion of 25 SNPs, including 24 most associated SNPs (14 FG, 9 FI, and 1 SNP, rs780094, associated with both FG and FI) residing in the regions demonstrating locus transferability in AA and 1 previ-ously undescribed FI SNP (rs6450057). We also tested the associa-tion of the FI SNP on chromosome X, rs213676, with lipid traits (the only traits available for chromosome X). HapMap2-imputed GWAS meta-analysis summary statistics for 25 SNPs were obtained from the Meta-analysis of T2D in African Americans (MEDIA) con-sortium for T2D31(n up to 23,818), the African Ancestry
Anthro-pometry Genetics Consortium (AAAGC) for BMI32 (n up to
39,141) and WHRadjBMI32,33(n up to 19,049), and the Continen-tal Origins and Genetic Epidemiology Network (COGENT) for HTN and blood pressure34 (n up to 29,828). HapMap-imputed GWAS meta-analysis summary statistics for 26 SNPs were obtained from the Candidate gene Association Resource (CARe) consortium for LDL-C and HDL-C35(n up to 8,090) and the Electronic Medical
Records and Genomics Network (eMERGE) for triglycerides36(n
up to 2,838). SNPs with p< 0.05 and same direction of effect (i.e., FG/FI-increasing alleles associated with T2D or higher levels of the quantitative insulin-resistance traits, except for HDL-C where FG/FI-increasing alleles were expected to be associated with lower HDL-C) were considered significant.
Discovery and Replication of Previously Undescribed FG and FI SNPs in AA
previously reported to be associated with FG or FI in any ancestry, classified into three tiers of decreasing restrictiveness based on low fixed-effect meta-analysis p values in AA or high trans-ethnic meta-analysis (MANTRA) log(BF) in the combined AA and EA re-sults, for follow-up in 10,096 additional AA samples from 16 addi-tional, independent cohorts (Table S1). Identified variants were classified into three tiers to take forward to the replication stage. Tier 1 was variants with a fixed-effect meta-analysis p<10–6in
AA samples, or p<10–5with log(BF)>5 in MANTRA; tier 2 was
variants with log(BF)> 4andfixed-effect p< 10–5; and tier 3 was variants with log(BF)>4orfixed-effect p<10–5(Figure S1).
The 16 additional independent replication cohorts are listed in
Table S1. For replication, we sought either in silico look-ups of the 62 SNPs that met criteria for one of the three tiers from the discov-ery stage in the cohorts with extant genotyping array data or con-ducted de novo genotyping for SNPs in tier 1 in additional cohorts with DNA and trait levels. Each participating replication cohort implemented the same model used for discovery analyses to evaluate associations between SNPs and traits. First we compared discovery and replication results for significance and direction of effect. Then we meta-analyzed the discovery and replication stage results to obtain a combined, fixed effect inverse variance estimate for each of the 62 SNPs. Genome-wide statistical significance was set at p%5310–8, and associations were considered to be previ-ously undescribed if they were not in LD (r2<0.3 or not within
500 kb of a previously reported glycemia-associated SNP). Finally, we performed a trans-ethnic meta-analysis in MANTRA combining fixed effects estimates from the AAGILE discovery and replication combined meta-analysis with published EA results from MAGIC to get a trans-ethnic total effect size using all avail-able data for 62 SNPs. We considered an association to have reached genome-wide significance if the p%5310–8in
fixed-ef-fect meta-analysis or log(BF) from MANTRA was greater than 6, and we considered the association to be previously undescribed if the variants were not in LD (r2<0.3) or not within 500 kb of a SNP previously reported to be associated with FG or FI.
Results
Trans-ethnic Fine-Mapping and Annotation of Glycemic QT Loci Established in EA Populations To fine-map 54 loci previously associated with FG or FI in
EA,8–10we constructed 99% credible sets, the smallest set
of SNPs that accounts for 99% of the posterior probability of containing the causal variant at the locus, using meta-analysis results only from MAGIC EA samples and trans-ethnic meta-analysis results from both MAGIC EA samples and AAGILE AA samples (Table S2). Reflecting increased sample size and differences in LD structure between ancestry groups, trans-ethnic meta-analyses yielded more than 20% reduction in either the number of SNPs or the genomic interval spanned by the SNPs in credible sets for 22/54 loci (13 FG, 8 FI, and 1 associated with both FG
and FI; Table 1 and Figures S2 and S3) while we also
observed some loci with substantially enlarged credible
sets. For 4 of these 22 loci (GCK [MIM: 138079] and
ADCY5 [MIM: 600293] for FG, PPP1R3B [MIM: 610541]
for FI, andGCKR[MIM: 600842] for both) with a>20%
reduction in the credible set, the credible set included a
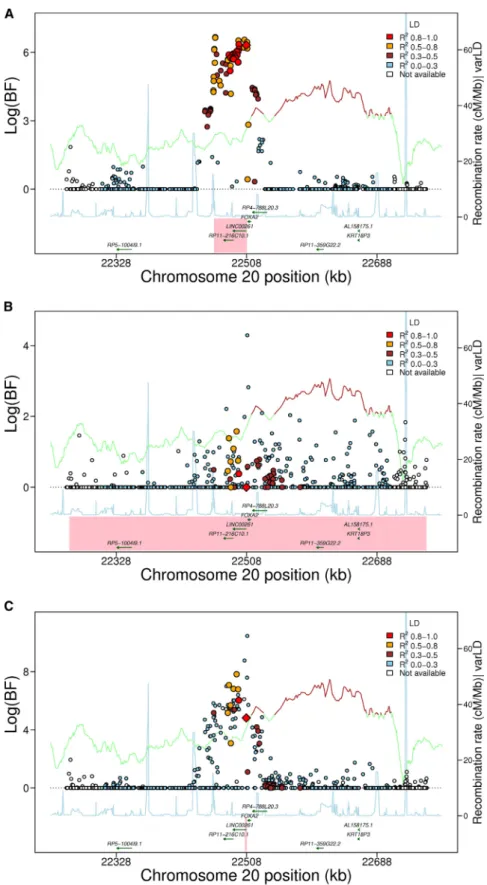
sin-gle SNP. We observed the greatest reduction (95%) in the
number of SNPs in the credible set at the FOXA2locus,
where the genomic width of the credible set was also greatly reduced (from ~46 kb to ~4 kb; 92% reduction), and the extent of LD surrounding the index SNP was less in AA than EA (Figure 1). The narrowed trans-ethnic CSs contained previously described functional variants at several loci, including the coding SNP rs1801282
(Gen-Bank: NC_000003.12; g.12351626C>G [p.Pro12Ala]) in
PPARG (MIM: 601487)37 and rs7903146 in TCF7L2
(MIM: 602228), which has been shown to overlap an islet
enhancer and modify enhancer activity.38In contrast, the
coding SNP rs1260326 at theGCKRlocus, presumed to be
causal based on prior studies,39,40was excluded from the
99% credible set. With the exception of non-synonymous
variants at DPYSL5 (MIM: 608383), COBLL1 (MIM:
610318)-GRB14(MIM: 601524), andPPARG(Table 2), the
greatly reduced credible sets mapped predominantly to non-coding sequences.
At 22 loci with a>20% reduction in the credible set, we
compared functional annotations of SNPs in the trans-ethnically generated credible sets (‘‘narrowed’’ set) to those of SNPs excluded from the EA-only credible sets
(‘‘excluded’’ set) using HaploReg annotation.12For the
nar-rowed set of nine FI loci, the SNP annotation from dbSNP indicated only a reduction in intronic SNPs and an in-crease in unknown function SNPs compared to the excluded set (Table S3). However, regulatory annotation data showed that the narrowed set of nine FI loci was en-riched for enhancer-associated chromatin marks and eQTLs when compared to the excluded set (76.3% versus
66.0%, p ¼ 0.004 for enhancer marks; 39.4% versus
28.5%, p¼0.002 for eQTLs [Table S3]). At the 14 FG loci,
we observed an enrichment of SNPs in 30UTR of genes,
but no enrichment of regulatory annotations in the
nar-row set compared to the excluded set (Table S4).Table S5
provides annotation information from HaploReg for each
SNP in these 22 derived credible sets, and the
Supple-mental NoteandTable S6show results from more exten-sive annotation from publicly available regulatory data.
As an example, manual annotation of the FOXA2 locus
shows that the top SNP lies just upstream of an lncRNA, LINC00261, with evidence for expression in liver and pancreas and overlapping numerous TFBSs in liver cell lines (Supplemental Note). This and prior evidence that
this lncRNA can regulate FOXA2 expression41 implicate
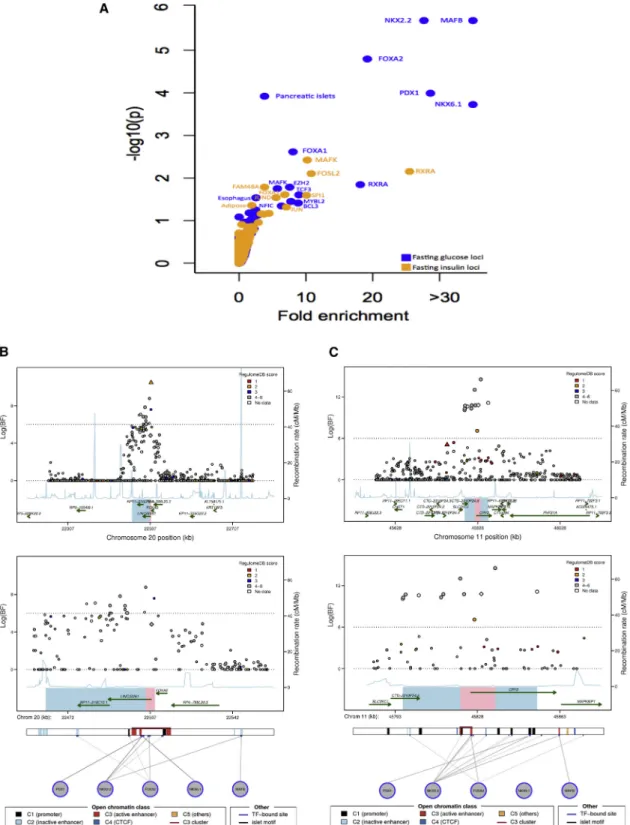
the lncRNA as a possible causal transcript at this locus. To more specifically examine whether variants at the 22 loci with greatly narrowed credible sets were enriched for individual TFBS or cell-type-specific chromatin marks, we employed a permutation test. We observed significant
enrichment (p< 1.9310–4) for FG loci at binding sites
for MAFB (p¼2310–6), NKX2-2 (p¼2310–6), FOXA2
(p¼ 1.6 3 10–5), and PDX1 (p ¼1.0 3 10–4) as well as
for chromatin marks in pancreatic islets (p¼1.2310–4)
(Figure 2A,Table S7). Among FI loci, we observed
adipose cells (p ¼ 0.048) and for several TFBSs such as
MAFK (p ¼ 0.0038) and RXRA (p¼ 0.0071) (Figure 2A,
Table S7).
We incorporated information from RegulomeDB and the
Islet Regulome Browser11,13to better visualize the
relation-ship between trait association and regulatory annotation
at the 22 loci with>20% reduction in the 99% credible
sets. Of the 14 FG loci, seven (CRY2 [MIM: 603732],
DPYSL5,FADS1 [MIM: 606148], FOXA2,GCKR, IGF2BP2
[MIM: 608289], andKL[MIM: 604824]) contained a SNP
with a RegulomeDB score%3, consistent with moderate
evidence for regulatory function (Figure S4). At four of
these seven loci (CRY2,FADS1, FOXA2, and GCKR), the
same SNP with strong regulatory annotation also had genome-wide significant evidence of association in the
trans-ethnic meta-analysis (log(BF) > 6) (Figures 2B, 2C,
andS4). Similarly, of the nine FI loci with reduced credible
set size, six of the credible regions (ANKRD55 [MIM:
615189]-MAP3K1[MIM: 600982],ARL15,FAM13A[MIM:
613299], GCKR, PPARG, andUHRF1BP) contained a SNP
with a RegulomeDB score%3, and at three of these loci
(GCKR, PPARG, and UHRF1BP1), the SNP with strong
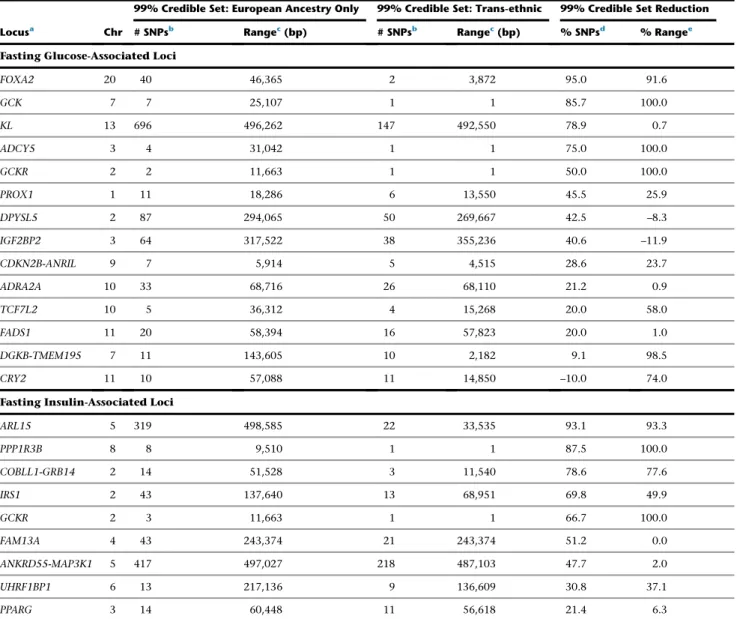
Table 1. 22 EA-Associated Type 2 Diabetes Quantitative Traits Loci with Substantially Reduced 99% Credible Sets Based on Trans-ethnic Fine Mapping
Locusa Chr
99% Credible Set: European Ancestry Only 99% Credible Set: Trans-ethnic 99% Credible Set Reduction
# SNPsb Rangec(bp) # SNPsb Rangec(bp) % SNPsd % Rangee
Fasting Glucose-Associated Loci
FOXA2 20 40 46,365 2 3,872 95.0 91.6
GCK 7 7 25,107 1 1 85.7 100.0
KL 13 696 496,262 147 492,550 78.9 0.7
ADCY5 3 4 31,042 1 1 75.0 100.0
GCKR 2 2 11,663 1 1 50.0 100.0
PROX1 1 11 18,286 6 13,550 45.5 25.9
DPYSL5 2 87 294,065 50 269,667 42.5 –8.3
IGF2BP2 3 64 317,522 38 355,236 40.6 –11.9
CDKN2B-ANRIL 9 7 5,914 5 4,515 28.6 23.7
ADRA2A 10 33 68,716 26 68,110 21.2 0.9
TCF7L2 10 5 36,312 4 15,268 20.0 58.0
FADS1 11 20 58,394 16 57,823 20.0 1.0
DGKB-TMEM195 7 11 143,605 10 2,182 9.1 98.5
CRY2 11 10 57,088 11 14,850 –10.0 74.0
Fasting Insulin-Associated Loci
ARL15 5 319 498,585 22 33,535 93.1 93.3
PPP1R3B 8 8 9,510 1 1 87.5 100.0
COBLL1-GRB14 2 14 51,528 3 11,540 78.6 77.6
IRS1 2 43 137,640 13 68,951 69.8 49.9
GCKR 2 3 11,663 1 1 66.7 100.0
FAM13A 4 43 243,374 21 243,374 51.2 0.0
ANKRD55-MAP3K1 5 417 497,027 218 487,103 47.7 2.0
UHRF1BP1 6 13 217,136 9 136,609 30.8 37.1
PPARG 3 14 60,448 11 56,618 21.4 6.3
The 22 EA-associated T2D QT loci include 13 fasting glucose, 8 fasting insulin, and 1 associated with both. Substantial reduction is defined as greater than 20% reduction in its genomic length or the number of SNPs.
aFor ease of comparison to previous studies, the loci are named based on the historically identified nearest protein-coding gene or genes to the index SNP in
Eu-ropean ancestry.
b# SNPs is the number of SNPs included in the 99% credible set.
cRange is defined as the maximum genomic distance based on hg18 among the SNPs included in the 99% credible set.
d%SNPs is (the number of SNPs in the EA-based 99% credible setthe number of SNPs in the trans-ethnic analysis-based 99% credible set)/the number of SNPs in
the EA-based 99% credible set.
e%Range is (the range of the EA-based 99% credible setthe range of the trans-ethnic analysis-based 99% credible set)/the range of the EA-based 99%
regulatory annotation also had genome-wide significant evidence of association in the trans-ethnic analysis (Figure S4). Then, from overlay of Islet Regulome Browser data, we found that 8 of 14 substantially narrowed credible sets for FG and 3 of 9 for FI had either a TFBS or an active islet-specific enhancer within the narrowed credible region
Figure 1. Trans-ethnic Analysis of Glycemic Quantitative Loci Provides Nar-rowed Intervals Spanned by the 99% Credible Set
Data are 500 kb regional association plots for fasting glucose atFOXA2, centered at the index SNP identified from European ancestry (EA) samples. The x axis denotes genomic position and the y axis denotes the log (BF), recombination rate, and varLD information61(a measure to
quan-tify LD variation differences comparing populations). The red diamond data point represents the index SNP within the region previously reported from EA samples. The color of each data point indicates its LD value (r2) with the index SNP based on
HapMap2 (YRI for AA results and CEU for EA results): white, r2 not available; blue,r2¼0.0–0.2; brown,r2¼0.2–0.5;
or-ange,r2¼0.5–0.8; red,r2¼0.8–1.0. The
blue line represents the recombination rate. The green line shows the varLD score at each SNP and is highlighted with dark brown if the varLD score is >95th per-centile of the genome-wide varLD score, comparing LD information between YRI and CEU HapMap2 samples.61The interval spanned by the 99% credible set is high-lighted in pink.
(A) Association results for fasting glucose in theFOXA2region in EA individuals. The 99% credible set contains 40 SNPs that span an interval of 46,365 bp.
(B) Association results for fasting glucose in theFOXA2region in AA individuals. The association signal is weaker than in EA samples, leading to a wider interval spanned by the 99% credible set.
(C) Association results for fasting glucose in theFOXA2region in both EA and AA in-dividuals. The 99% credible set contains 2 SNPs and spans an interval of 3,872 bp, a 95% reduction in the number of SNPs and a 91.6% reduction in the length of the credible set interval.
(Figures 2B, 2C, andS4). For example,
the narrowed credible region at the
FOXA2locus, which also overlaps an
lncRNA as noted above, falls within an active C3 enhancer cluster and
contains binding sites for both
NKX2-2 and FOXA2, raising the possi-bility that the causal genetic mecha-nism at this locus involves regulation
of FOXA2, the lncRNA at the locus,
or both (Figure 2B). The narrowed
credible region at the CRY2 locus also overlaps a C3
enhancer cluster in islets that contains an NKX2-2 TFBS
(Figure 2C). Furthermore, at three FG loci (GCK, ADCY5
[MIM: 600293], and GCKR) and both FI loci (GCKR and
PPP1R3B[MIM: 610541]) whose 99% credible set was
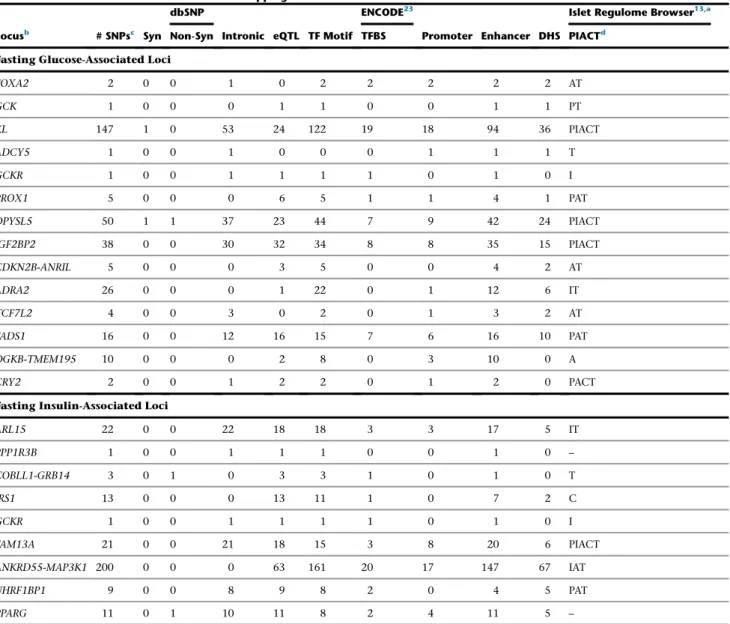
overlapped with regulatory annotation in either ENCODE, Roadmap, or the Islet Regulome (Table 2). Based on data derived from the Islet Regulome Browser, all 14 FG and 7 of 9 FI loci had evidence of regulatory function in pancre-atic islets within the credible set (Table 2). Nearly all loci with narrowed credible sets contained at least one tran-scription factor (TF) motif within the 99% credible set (13/14 FG and 9/9 FI) and had at least one variant
associ-ated withcis-eQTL data (11/14 FG and all 9 FI). In addition,
all 14 FG and 9 FI loci contained some regulatory evidence;
in contrast, only three of the loci (DPYSL5,
COBLL1-GRB14, andPPARG) contained a nonsynonymous variant
in their credible sets (Table 2).
Relevance of European T2D QT Loci for African Americans
To evaluate the relevance in AA individuals of genetic de-terminants of FG and FI identified from EA studies, we examined SNP and locus association transferability, allele frequency differences, and patterns of association between FG/FI SNPs and glycemia-related traits. We tested SNP transferability (defined as whether the index EA SNP was associated with the same trait in AA, with the same
direc-tion of effect, and p<0.05) at 54 EA-associated FG or FI
loci. Of 36 EA FG index SNPs, 11 SNPs reached SNP
trans-ferability criteria (binomial p¼9.87310–8for observing
11/36 meeting SNP transferability criteria) (Table 3). Of
Table 2. Genomic Annotation Characteristics at 22 EA-Associated Type 2 Diabetes Quantitative Traits Loci with Substantially Reduced 99% Credible Sets Based on Trans-ethnic Fine Mapping
Locusb # SNPsc Syn
dbSNP
Intronic eQTL TF Motif
ENCODE23
Promoter Enhancer DHS
Islet Regulome Browser13,a
Non-Syn TFBS PIACTd
Fasting Glucose-Associated Loci
FOXA2 2 0 0 1 0 2 2 2 2 2 AT
GCK 1 0 0 0 1 1 0 0 1 1 PT
KL 147 1 0 53 24 122 19 18 94 36 PIACT
ADCY5 1 0 0 1 0 0 0 1 1 1 T
GCKR 1 0 0 1 1 1 1 0 1 0 I
PROX1 5 0 0 0 6 5 1 1 4 1 PAT
DPYSL5 50 1 1 37 23 44 7 9 42 24 PIACT
IGF2BP2 38 0 0 30 32 34 8 8 35 15 PIACT
CDKN2B-ANRIL 5 0 0 0 3 5 0 0 4 2 AT
ADRA2 26 0 0 0 1 22 0 1 12 6 IT
TCF7L2 4 0 0 3 0 2 0 1 3 2 AT
FADS1 16 0 0 12 16 15 7 6 16 10 PAT
DGKB-TMEM195 10 0 0 0 2 8 0 3 10 0 A
CRY2 2 0 0 1 2 2 0 1 2 0 PACT
Fasting Insulin-Associated Loci
ARL15 22 0 0 22 18 18 3 3 17 5 IT
PPP1R3B 1 0 0 1 1 1 0 0 1 0 –
COBLL1-GRB14 3 0 1 0 3 3 1 0 1 0 T
IRS1 13 0 0 0 13 11 1 0 7 2 C
GCKR 1 0 0 1 1 1 1 0 1 0 I
FAM13A 21 0 0 21 18 15 3 8 20 6 PIACT
ANKRD55-MAP3K1 200 0 0 0 63 161 20 17 147 67 IAT
UHRF1BP1 9 0 0 8 9 8 2 0 4 5 PAT
PPARG 11 0 1 10 11 8 2 4 11 5 –
Abbreviations are as follows: Syn, synonymous SNP; non-syn, non-synonymous SNP; eQTL, expression quantitative trait loci; TF motif, transcription factor motif; TFBS, transcription factor binding site; DHS, DNase l-hypersensitive sites.
aThe information was obtained on December 1, 2014.
bFor ease of comparison to previous studies, the loci (13 fasting glucose, 8 fasting insulin, and 1 more for both) are named based on the historically identified
nearest protein-coding gene or genes to the index SNP in EA.
c#SNPs: the number of SNPs in trans-ethnic analysis-based 99% credible set.
Figure 2. Trans-ethnic Fine-Mapping of Glycemic Quantitative Trait Loci Highlights Overlap between Trait-Associated SNPs and Pre-dicted Regulatory Function
(A) Analysis for enrichment of posterior probabilities in SNPs overlapping transcription factor binding sites (TFBSs) and cell-type-specific enhancer and promoter marks at 22 (13 FG, 8 FI, and 1 both FG and FI) substantially narrowed 99% credible sets. x axis shows fold-enrichment above null, the y axis shows –log10(P) for enrichment, and FI and FG are indicated by yellow and blue points, respectively.
TFBSs and cell types with enhancer or promoter marks with p value for enrichment below 0.01 are labeled.
(B) Regional association plots for fasting glucose after trans-ethnic analysis demonstrating overlap between regulatory annotation and narrowed credible regions at theFOXA2locus.
(C) Regional association plots for fasting glucose after trans-ethnic analysis demonstrating overlap between regulatory annotation and narrowed credible regions at theCRY2locus.
18 EA index FI SNPs, 2 met SNP transferability criteria (Table 3). We also found excess concordance in direction of effect of the SNPs comparing EA with AA samples, irre-spective of the strength of association: of 36 EA FG index SNPs, 28 SNPs shared the same direction of effect in the
AA sample (binomial p¼5.97310–4); of 18 EA FI index
SNPs, 14 SNPs shared the same direction of effect in the
AA sample (binomial p¼0.015) (Figure S5). For both traits,
SNPs that met transferability criteria tended to have larger effect sizes than those not meeting the criteria, and the magnitudes of effect in EA were similar to those in AA sam-ples (Figure S5). There was genome-wide excess of direc-tional concordance of SNP effects comparing EA with AA
(binomial p¼ 0.021 for FG and binomial p ¼ 0.016 for
FI) when considering SNPs independent of previously
re-ported T2D QT associations and with p%0.01 in EA (Table
S8). This evidence supports the hypothesis that trans-ethnic meta-analysis in large samples could reveal addi-tional SNPs associated with glycemic traits.
We also evaluated locus transferability (defined as
whether any SNP within5250 kb of the index EA SNP
was associated with the same trait in AA at a
Bonferroni-corrected p<0.05) at the 54 EA-associated FG or FI loci.
Loci were transferable from the EA to AA individuals (ad-justing for the effective number of SNPs tested in each re-gion) for 15/38 FG loci and for 10/18 FI loci (Table 4, Figure S2). At six FG loci (GCK, ADCY5, GCKR, CRY2,
PPP1R3B, and MTNR1B [MIM: 600804]) and two FI loci
(PDGFC[MIM: 608452] andGCKR), the index SNPs from
the EA sample and the most significantly associated SNPs
in the AA sample were either in LD (r2R0.20) in YRI or
were the same SNP (Table 4). In contrast, for the remaining loci, the index SNP from the EA sample and the most
asso-ciated SNP in the AA sample were not in LD (r2<0.20 in
AA sample). For these loci with low LD between EA index SNP and the most associated AA SNP, we found a change
in effect size>10% for the AA SNP after conditioning on
the index SNP in EA at only three FG loci (SLC30A8
[MIM: 611145],PPP1R3B, andGCK) (Table S9). These
re-sults show ancestrally derived allelic heterogeneity giving more than one variant signal at these FG loci.
Allele Frequency Differences and Selection
FG-raising (38 SNPs) and FI-raising (18 SNPs) allele fre-quencies for EA index SNPs differed widely comparing AA with EA populations (absolute allele frequency differ-ences ranged from 0.007 to 0.825 for FG index SNPs and
0.017 to 0.540 for FI index SNPs) (Table S10,Figure S5).
We estimated Wright’s fixation index (FST)26 to
demon-strate whether selection pressure has resulted in widely different allele frequencies at any SNPs in AA versus EA
populations. FSTestimates were consistent with moderate
to substantial population differentiation for a minority of
FG and FI SNPs: FST > 0.15 at four FG loci (ADRA2A
[MIM: 104210], PCSK1 [MIM: 162150], OR4S1, and
ARAP1 [MIM: 606646]) and at one FI locus (UHRF1BP1)
in the AAGILE and MAGIC data. There was also evidence
of recent positive selection (absolute value of iHS>2) for
one FG locus (FOXA2) and three FI loci (UHRF1BP1,HIP1
[MIM: 601767], andMAP3K19) in the EA, yet no evidence
of recent selection in AA (Table S10).
Associations between FG/FI SNPs and Insulin Resistance-Related Metabolic Traits
Many FG/FI-associated loci identified in EA samples were also associated with T2D and other insulin
resistance-related traits.8,9 We investigated these associations in AA
individuals at 25 SNPs, including 24 AA SNPs (14 FG, 9 FI, and 1 associated with both FG and FI) at loci that showed transferability, plus the previously undescribed FI SNP (rs6450057) described in the next section. A second FI SNP (also described in the next section), rs213676, was not interrogated for association with metabolic traits due
to scant chromosome X data.Table S11 summarizes the
association results of these 25 FG/FI SNPs with T2D, body mass index (BMI), BMI-adjusted waist-to-hip ratio (WHR), blood pressure, hypertension (HTN), and lipid
levels in AA from several consortia.32–36,4214 of 25 (56%)
FG/FI SNPs were associated with T2D or an insulin
resis-tance-related trait (p<0.05 with an effect in the expected
direction [e.g., FG-raising SNP associated with increased
risk of T2D]). Six SNPs (24%; 4 [ADCY5, RREB1 (MIM:
602209),MTNR1B(MIM: 600804), andFOXA2] of 15 FG
SNPs and 2 [COBLL1-GRB14 and ARL15] of 11 FI SNPs)
were associated with higher odds of T2D in AA samples
(n up to 23,818).31 40% (6/15) of the FG-raising alleles
and 45% (5/11) of the FI-raising alleles were associated with insulin resistance-related traits in AA samples. The
FI SNP rs6717858 (COBLL1-GRB14) was associated with
three traits (T2D, BMI-adjusted WHR, and HDL-C).
rs17811863 (PDGFC), also an FI SNP, was associated with
both systolic and diastolic blood pressure.
Previously Undescribed Glycemic Quantitative Trait Loci
The strategy we used for glycemic loci discovery in AAGILE
is shown inFigure S1. Results of the discovery analysis are
shown inFigure S6. AAGILE GWAS results were combined
with MAGIC EA GWAS results10in a two-stage
meta-anal-ysis approach. In the discovery stage, results from 16
studies (n¼20,209) in the AAGILE AA GWAS fixed effects
meta-analysis were combined with results from 29 studies
(B and C) The index SNP in European ancestry (MAGIC) is represented by a diamond; the best SNP in African ancestry (AAGILE) is rep-resented by a triangle. SNPs are colored according to the score assigned in RegulomeDB11with lower score corresponding to stronger
level of evidence supporting regulatory function; data from the Islet Regulome Browser13for the genomic interval is shown below
(n¼57,292) from the MAGIC EA GWAS10for trans-ethnic
meta-analysis using MANTRA. A total of 62 SNPs met pre-specified multi-tiered criteria for stage 2 follow-up, with 12
SNPs in tier 1, 10 in tier 2, and 40 in tier 3 (Figure S1and
Table S12). Follow-up in the second stage, with up to 10,096 additional AA samples from 14 studies (Table S1), yielded two previously undescribed SNPs in loci associated with FI that exceeded GWAS significance thresholds (Table 5). We found no previously unknown FG loci.
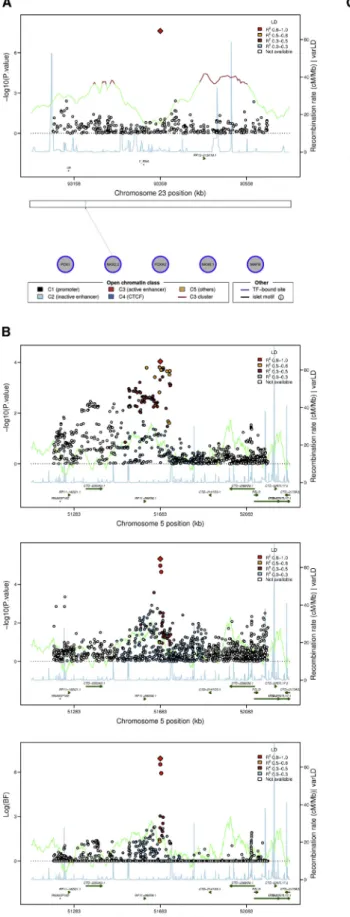
In the fixed effects meta-analysis of AA samples, we iden-tified a previously undescribed SNP (rs213676) on
chromo-some X nearFAM133Aassociated with FI (p¼2.4310–8)
(Figure 3A). This FI SNP was not included in the
trans-ethnic meta-analysis because MAGIC10 did not report
chromosome X results. Although rs213676 is in a region without known genes, this region might be of regulatory significance because it is known to harbor a TFBS in
pancreatic islets11,13(Figure 3A).
The other previously undescribed FI SNP, rs6450057 on chromosome 5 (Figure 3B), resides near four putative
lncRNA genes and the PELO (MIM: 605757) (or ITGA1
[MIM: 192968]) gene. In trans-ethnic analyses, this locus
achieved genome-wide significance (log(BF) ¼ 7.1) and
trans-ethnic fine-mapping reduced the credible set at this locus from 229 SNPs to just 3 SNPs. Interestingly, the
rs6450057 T allele is associated with higher FI (p¼3.13
10–6) in AA samples but with lower FI (p¼9.2310–5) in
EA samples in ancestry-specific fixed-effect meta-analyses (Table 5). The discordant direction of effect at this locus was observed across nearly all SNPs at the locus, regardless of LD with rs6450057 (Figure 3C). However, the direction of effects did not show a clear pattern in the association analysis after conditioning on rs6450057, implying that the signal at this locus was driven by rs6450057 (Figure S7). As with many of the glycemic QT loci described above, the 99% credible set at this locus did not include coding variants but did overlap an active C3 enhancer in
pancreatic islets11,13(Figure 3D).
Discussion
We assembled a large sample of AA individuals, combined resulting data with published data from EA individuals, and used trans-ethnic fine mapping to narrow the genomic interval containing putative causal SNPs for 22 of 54
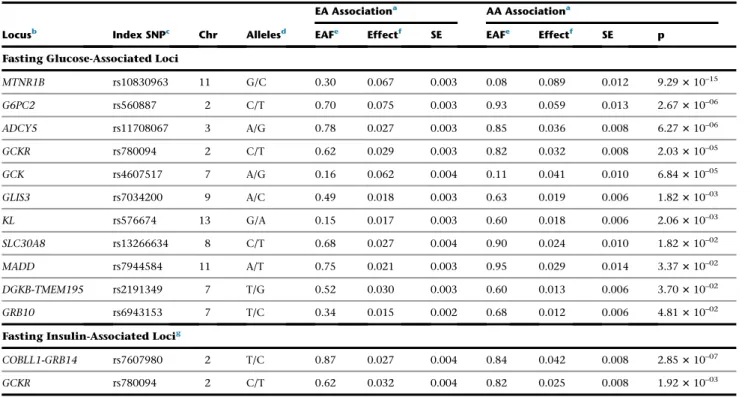
Table 3. SNP Transferability in AA Individuals at 13 EA-Associated Type 2 Diabetes Quantitative Trait SNPs
Locusb Index SNPc Chr Allelesd
EA Associationa AA Associationa
EAFe Effectf SE EAFe Effectf SE p
Fasting Glucose-Associated Loci
MTNR1B rs10830963 11 G/C 0.30 0.067 0.003 0.08 0.089 0.012 9.29310–15
G6PC2 rs560887 2 C/T 0.70 0.075 0.003 0.93 0.059 0.013 2.67310–06
ADCY5 rs11708067 3 A/G 0.78 0.027 0.003 0.85 0.036 0.008 6.27310–06
GCKR rs780094 2 C/T 0.62 0.029 0.003 0.82 0.032 0.008 2.03310–05
GCK rs4607517 7 A/G 0.16 0.062 0.004 0.11 0.041 0.010 6.84310–05
GLIS3 rs7034200 9 A/C 0.49 0.018 0.003 0.63 0.019 0.006 1.82310–03
KL rs576674 13 G/A 0.15 0.017 0.003 0.60 0.018 0.006 2.06310–03
SLC30A8 rs13266634 8 C/T 0.68 0.027 0.004 0.90 0.024 0.010 1.82310–02
MADD rs7944584 11 A/T 0.75 0.021 0.003 0.95 0.029 0.014 3.37310–02
DGKB-TMEM195 rs2191349 7 T/G 0.52 0.030 0.003 0.60 0.013 0.006 3.70310–02
GRB10 rs6943153 7 T/C 0.34 0.015 0.002 0.68 0.012 0.006 4.81310–02
Fasting Insulin-Associated Locig
COBLL1-GRB14 rs7607980 2 T/C 0.87 0.027 0.004 0.84 0.042 0.008 2.85310–07
GCKR rs780094 2 C/T 0.62 0.032 0.004 0.82 0.025 0.008 1.92310–03
SNP transferability is defined as the association p<0.05 in AA and sharing the same trait-raising allele between EA and AA. 13 EA-identified T2D QT SNPs in 12 loci, including 10 fasting glucose loci, 1 fasting insulin locus, and 1 locus associated with both.
aEA Association results refer to the association results using samples of European ancestry in previous publications;8–10AA Association results refer to the association
results using AAGILE samples of African ancestry assembled in this study.
bFor ease of comparison to previous studies, the loci are named based on the historically identified nearest protein-coding gene or genes to the index SNP in
Eu-ropean ancestry.
cIndex SNPs are the most significant SNPs previously reported in MAGIC publications. All of these SNPs reach genome-wide significant level (p<5310–8) in the
original study.
dEA trait-raising allele/other allele. eFrequency of EA trait-raising allele.
previously identified FI and FG loci. We demonstrated that many of the genetic variants associated with FG and FI are predicted to have regulatory function, with few having predicted protein-coding function. The results show that although a substantial portion of the genetic architecture underlying these T2D-associated traits is shared across EA and AA populations, allelic heterogeneity suggests that there are also genetic variants unique to AA populations. Finally, we identified two previously undescribed FI loci, bringing to 56 the number of FG- and FI-associated loci in humans.
Fine mapping combined with regulatory annotation provides a plausible functional explanation for the many T2D-associated GWAS loci that reside in
non-protein-cod-ing regions of the genome.43–45Previous GWAS findings
from MAGIC show complete overlap of loci associated
with HOMA-B (a measure of beta cell function46) and
FG,9 so it would be expected that fine-mapping of FG
loci might identify regulatory function in islets. On the other hand, FI is typically considered a marker of insulin
resistance.47However, insulin resistance does not account
for all of the variability in FI,48,49and fasting
hyperinsuli-nemia itself, due to hypersecretion of insulin by beta cells,
might be causal in the pathogenesis of T2D.50–52 Our
finding that some FI loci had predicted regulatory function in islets is supportive of this evidence. At many loci, for
instance at FOXA2 andPPP1R3B, the narrowed credible
sets from trans-ethnic analysis coupled with genomic annotation focused attention on lncRNA transcripts rather than the nearest protein-coding gene, by convention generally assumed to be the putative causal transcript. At
theFOXA2locus, the trans-ethnic credible set combined
with genomic annotation highlights regulatory function-ality in glycemia-related tissues—enhancer marks and TFBS in pancreas and liver—as well as an lncRNA that
might affectFOXA2expression, raising two possible causal
regulatory mechanisms for altered FG.12,13,41Awareness of
the regulatory nature of some genetic determinants of FG and FI provides insight into novel approaches for the regu-lation of glucose homeostasis. In particular, regulatory tar-gets might be amenable to post-genomic manipulation (e.g., by genome editing, use of antisense oligonucleotides,
or enzyme hijacking) as suggested in other areas.53,54For
instance, by knowing that polymorphisms in aldehyde de-hydrogenase 2 (ALDH2) enzyme are associated with poor alcohol metabolism in some Asian populations, the enzyme hijacking technique has been used to upregulate a related, but naturally unimportant, enzyme (ALDH3A1), thereby improving alcohol metabolism and reducing
can-cer risk in mice.53Such techniques could in the future be
extended to T2D prevention and control if accessible regu-latory pathways are elucidated.
At theGCKRlocus, trans-ethnic fine mapping provided
added information to the prior knowledge of this locus identified from studies in EA populations. The 99% cred-ible set constructed using trans-ethnic analysis results at
GCKR contained only one non-coding SNP, rs780094
(GenBank: NC_000002.12; g.27518370T>C), the most
strongly FG-associated SNP in both EA and AA. However,
prior fine-mapping39in EA and functional studies40have
implicated rs1260326, a nonsynonymous variant
(Gen-Bank: NC_000002.12; g.27508073T>C [p.Leu446Pro]), as
a likely causal SNP at this locus. This missense variant was excluded from the narrowed credible set. This could imply that the lead non-coding SNP rs780094, which has strong evidence as residing in a TFBS, is also a causal variant at the locus (Table S5). On the basis of statistical ev-idence, we were unable to distinguish the association of
these two SNPs in EA samples due to high LD (r2¼0.93).
However, in AA the evidence of association with FG was several orders of magnitude stronger for the non-coding
SNP, rs780094 (p ¼ 2.2 3 10–5), than the coding SNP,
rs1260326 (p¼ 0.03) and their LD is weaker (r2¼ 0.47).
Both SNPs may play a role at the GCKR locus; a causal
variant tagged by rs780094 might be common to both ancestries, resulting in the narrowed trans-ethnic credible set observed here, while the nonsynonymous variant rs1260326 might have greater functional impact in EA than in AA individuals. Alternatively, the actual causal SNP could be in LD with both of these SNPs, and more dense imputation or deep sequencing might reveal addi-tional SNPs carried on haplotypes with these SNPs. Since crystal structural analysis of the GCKR protein has not identified the 446 residue as critical for binding of regulating molecules (fructose 1-phosphate and fructose 6-phosphate), genetic heterogeneity involving both cod-ing and regulatory functional variation at the locus
re-mains a plausible hypothesis.55
Analyses of the relevance of glycemic QT loci in AA suggest that genetic determinants of human glucose regu-lation are more similar than different across human popu-lations. We observed an excess of consistency in direction of effect of FG and FI SNPs comparing AA with EA, regard-less of statistical significance of SNPs in AA, and a substan-tial portion (50% for FG and 56% for FI) of EA index SNP or loci were transferable to AA individuals. As in previous
studies in EA individuals,8,9most of the transferable T2D
EA loci were also associated with T2D or insulin resis-tance-related traits in AA individuals, demonstrating com-mon genetic pathways underlying glycemic QTs and other metabolic traits. We also found that several FG-raising and FI-raising alleles were at least nominally associated with lower odds of T2D or ‘‘better’’ metabolic trait profiles in the AA samples. Many of the loci previously observed to have this discordant pattern of associations across traits
in EA, includingGCKR,9,39,40,56,57MADD(MIM: 603584),9
PDGFC,10 and FOXA2,10 had a similar pattern in our
AA sample, demonstrating that the complexity of the ge-netic architecture of these traits is shared across populations.
By combining AA with EA information, including chro-mosome X variants in AA, we identified two previously
un-described FI SNPs nearFAM133AandPELO, increasing the