The Effect of Extended Direction of Attention on Subsequent Pressure Sensations
Luke A. P. Athans
University of North Carolina at Chapel Hill
Spring 2018
Advisor________________________
Reader________________________
Abstract
Previous literature has shown a style of perceptual amplification in patients suffering
from chronic pain conditions, compared to healthy controls (Hollins et al. 2009; McDermid,
Rollman, & McCain 1996). The underlying mechanism for this sensory amplification is
disagreed upon by researchers within the domain. Some claim that negatively-valenced
emotional response to unpleasant stimuli is the culprit (VanDamme 2017; McDermid, Rollman,
& McCain 1996). Others believe the phenomenon occurs due to habitual direction of attention
toward both unpleasant and neutral stimuli (Hollins et al. 2009). It is unclear whether this
phenomenon occurs only in those with chronic pain conditions, or is generalizable to all people.
The current study used a sample of healthy participants and neutral pressure stimuli to assess the
role of attention in this phenomenon. Results show that direction of attention for an extended
period of time caused perceptual amplification of highly similar sensations to those attended to.
The sensations which were amplified were neutral in nature, indicating that attention is likely the
underlying factor. Dissimilar sensations within the same sensory domain (touch) were not
amplified. The results of this experiment provide an explanation for the development of
generalized hypervigilance, and suggest that a better description for this phenomenon is
Acknowledgements
Thank you to Dr. Wiss, and Dr. Buzinski for taking time out of their busy schedules to review my thesis, and intently sit through my research presentation. I greatly appreciated their questions and input. It was very pleasant to get the opportunity to interact with them again, especially in a context outside of the usual classroom.
I would like to congratulate my lab mate Cassidy Fry on her acceptance to graduate school for psychology at Penn State! I am extremely happy that she and I were able to forge a friendship over the past few years. We were raised only miles apart from each other in Moore County, North Carolina. Without this research experience she and I would have never known each other. I wish her the best of luck in her future research endeavors!
I would also like to extend a huge thank you to Dr. Mark Hollins. He taught me an unfathomable amount about how to design research, and adeptly developed my understanding of topics related to my thesis. I hope I was able to make him proud with my hard work within this domain. I spent many hours on this project and learned more than I ever expected to. Enjoy your retirement, Dr. Hollins!
The Effect of Extended Direction of Attention on Experience of Subsequent Pressure
Sensations
The primary aim of the present study is to clarify the mechanisms responsible for
previously observed perceptual amplification of noxious sensations in patients with chronic pain
conditions, such as fibromyalgia, temporomandibular disorders, and rheumatoid arthritis (Hollins
et al. 2009; McDermid, Rollman, & McCain 1996). According to the Generalized
Hypervigilance Hypothesis (GHH) of McDermid et al., this perceptual amplification is due to
increased levels of body vigilance, often referred to as hypervigilance. Hypervigilance is
thought of as a perceptual style involving habitual direction of attention toward bodily
sensations, especially painful or unpleasant ones. Hollins and Walters (2016) attempted to induce
a mild transient state of hypervigilance in healthy individuals, with limited success. The current
study hopes to expand on Hollins and Walters (2016) by creating a more effective experimental
manipulation, as well as measuring a wider domain of variables that will more effectively assess
the validity of the GHH. Furthermore, the aim of the current study is to test the Attentional Gain
Model of hypervigilance proposed by Hollins and colleagues (Hollins et al. 2009).
Chapman (1978) first observed a tendency for chronic pain patients to have increased
vigilance to somatic distress signals. This concept of hypervigilance was expanded when
McDermid, Rollman, and McCain (1996) compared pain tolerance and threshold of fibromyalgia
(FM) patients, rheumatoid arthritis (RA) patients, and healthy controls. Tolerance and threshold
were measured for pressure and noise stimuli. McDermid and colleagues found that both FM and
RA patients had significantly lower pain threshold and tolerance for pressure sensations than
sensations than healthy controls. This provides support for claims that chronic pain conditions
are associated with an increase in sensitivity to stimuli.
Based on these findings, McDermid, Rollman, and McCain (1996) proposed the
Generalized Hypervigilance Hypothesis, which states that patients with some chronic pain
conditions, such as FM and RA, have a cognitive style of increased attention to noxious
sensations, combined with a preoccupation with pain. They suggested that this cognitive style
results in lower thresholds and tolerances for noxious stimuli Founders of this model define a
sensation as noxious if it is perceived as painful, unpleasant, or aversive. However, Hollins et al.
(2009) investigated what kind of stimuli were affected by this phenomenon and found that some
neutral as well as noxious stimuli were experienced more intensely by chronic pain patients,
compared to healthy controls.
Hollins et al. (2009) proposed that hypervigilance is associated with amplification of a
range of stimuli, not just noxious stimuli. They recorded the subjective ratings of the intensity
and unpleasantness of pressure and noise stimuli of FM patients, TMD patients, and healthy
controls (HC). They used a task in which the end of a weighted rod was placed on to the forearm
of participants, with a variety of weights. Participants were asked to rate the intensity and
unpleasantness of these pressure sensations on a scale from 0-100, as well as to classify the
sensations as “painful,” “unpleasant but not painful,” or “neutral.” Similarly, 24 sounds of
randomly ordered intensity were presented to participants, and they were asked to rate the
intensity and unpleasantness of these stimuli from 0-100. Furthermore, all participants completed
FM and TMD patients reported significantly higher intensity ratings for both pressure and
noise stimuli, compared to healthy controls. Participants’ ratings of unpleasantness showed a
significant difference between FM patients and all other participants. TMD and HC participants
showed no statistically significant differences in unpleasantness ratings (Hollins et al. 2009).
Furthermore, FM and TMD patients had significantly higher PILL scores compared to the
healthy controls, suggesting that their body vigilance is significantly higher than HCs.
Based on these findings, Hollins et al. (2009) proposed the Attentional Gain Model of
hypervigilance (AGM). This model suggests that both noxious stimuli, and potentially noxious
stimuli, get amplified due to habitual direction of attention toward these kinds of stimuli.
Potentially noxious stimuli include stimuli that have become associated with a noxious event, or
are within the same sensory domain. This feature differentiates the AGM from the GHH.
Some hypothesize that hypervigilance, and its resulting increase in sensitivity, occur only
when a person’s fear pathway is activated, or when a person desires to avoid pain (Van Damme
2016). The study on which this hypothesis is based used vibrating skin contactors to compare the
perceptive threshold, and ability to distinguish differences between a series of vibrations. They
compared groups of FM patients and HCs. Contactors were placed on eight body locations: both
upper arms, both forearms, both legs just below the knee, and both legs just above the ankle. The
intensity of contactor vibration was calibrated for each participant. The intensity of vibration was
increased until participants were able to detect the vibration. Then, participants performed a task
in which they judged whether two combinations of vibration stimuli differed from one another.
The investigators of this study attempted to test the role of attention by using two experimental
condition, participants were told that the locations of contactor vibrations would be evenly
distributed. In the predictable condition, participants were told that contactor vibrations would
occur at one specific location. Then trials were administered in six blocks of 88 trials, with
different combinations of valid/invalid, and same/different trials. The results of this study
showed only a significant difference between groups of baseline contactor vibration intensity,
where FM patients required a more intense vibration to reach threshold of perception than HCs.
No difference in ability to detect stimulus differences was found between groups, or conditions.
This contradicts previous findings that FM patients have increased sensitivity to tactile
sensations.
Based on the lack of significant results in this 2016 study, Van Damme suggests that
chronic pain patients must fear bodily threat in order to experience results of hypervigilance.
However, this interpretation of results is not convincing, and only adds to the confusion
surrounding the discussion of hypervigilance. Furthermore, the methods of the study showed no
indication that the experienced frequency of vibration was regulated, and the fact that intensity of
vibrations were tailored to each participant introduces inconsistencies. Lastly, the manner in
which the authors attempted to manipulate attention, using unpredictable/predictable conditions,
and invalid/valid and same/different trials, was apparently unsuccessful.. In order to conclude
that an emotional factor is responsible for the increase in perception, more investigation must be
conducted. Similarly, the role of attention in this process cannot be discounted based on the
findings of this study.
It is interesting to compare the bodily sensitivity of patients with FM and panic disorder.
unpleasant and can even be painful. Panic attacks involve increased heart rate, chest pain,
dizziness, lightheadedness, and other unpleasant symptoms. Previous studies provide evidence of
an association between body vigilance and panic disorder symptoms (Telch et al. 1993; Schmidt,
Lerew & Trakowski 1997). Patients in these studies were adept at detecting changes in bodily
sensations, especially those that traditionally are indicative of a panic attack, such as increased
heart rate and lightheadedness/dizziness. These studies also show that cognitive-behavioral
therapy designed to decrease vigilance to bodily sensations such as increased heart rate and
dizziness produces marked decreases in rates of panic attacks.
Cognitive-behavioral therapy (CBT) utilized by Telch (1993) and Schmidt (1997)
focused on desensitizing patients to bodily sensations that traditionally signal the onset of a panic
attack, foremost increases in heart rate, and dizziness or lightheadedness. Patients were given
caffeine, a substance that naturally increases heart rate. Patients were then trained to recognize
that an increase in heart rate does not always indicate the onset of a panic attack. By training
these patients to regard formerly noxious stimuli as non-threatening, rates of panic disorder
symptoms decreased significantly. These CBT techniques caused patients to direct less attention
to these stimuli. It may be that these stimuli were less strongly perceived after CBT, although the
study does not demonstrate this.
Rost, Van Ryckeghem, Schulz, Crombez, and Vogele (2017) tested FM patients’ ability
to detect bodily sensations, specifically number of heartbeats. This study recorded participants’
Heart Rate Variability (HRV), a physiological measure of body vigilance. Previous studies show
there is an inverse relationship between HRV and body vigilance (Rost et al. 2017). This study
and had participants attempt to count their heartbeats over a variety of time periods. They found
that HRV was significantly lower for FM patients compared to healthy controls. However, they
found no difference in the detectability of heartbeats between FM patients and HCs. Heartbeats
are rarely noxious for FM patients, so these findings are consistent with the GHH, which predicts
perceptual amplification only of noxious sensations. From the perspective of the AGM, the lack
of significant differences in heartbeat detection can be attributed to the absence of a reason to
direct attention toward heart sensations. Heart beats are not associated with the negative
symptoms of FM, so FM patients have little reason to direct attention toward these sensations
more frequently than do HC participants.
We hypothesize that habitual attention is the mechanism for the phenomenon of
hypervigilance. Fear of noxious events, and the habitual experience of noxious events merely act
to direct attention to bodily sensations. Some hypothesize that hypervigilance occurs when a
certain fear pathway is activated, or when a person desires to avoid pain (Van Damme 2016).
However, the design of the study making these claims is questionable. The aim of the current
study is to sift through confusion produced by previous studies to make the origin of this
phenomenon clear.
Purpose of the Present Study
The present study aims to uncover the mechanisms behind perceptual amplification of
chronic pain conditions. We hypothesize that direction of attention is the reason for observed
perceptual amplification. In order to investigate this, we plan to manipulate attention and hold all
other variables constant. In order to achieve this two groups will be used, an experimental group
experimental group will direct attention toward these sensations, while members of the control
group will perform a task that directs their attention away from these sensations. After this
manipulation, all participants will complete an identical series of tasks and questionnaires. These
tasks ask participants to rate sensation intensity of light touch sensations; and to rate intensity,
unpleasantness, and classify stronger pressure sensations. Responses on these subsequent tasks
and questionnaires will be compared between groups to evaluate the effect of attention on
sensory experience. The present experiment utilizes participants free of chronic pain disorders,
this allows the role of attention to be assessed cleanly. Furthermore, this experiment does not
instill a sense of fear, and merely forces participants to direct their attention to the detection of
light tactile stimuli. These two aspects of this experiment are what will distinguish any
significant findings from those of prior research.
This experiment tests four hypotheses. 1.) Participants with higher body vigilance will
have a significantly lower threshold of detection of light pressure. 2.) Participants who direct
attention toward detection of light tactile stimuli will rate subsequent stimuli more intensely than
a group who did not direct attention toward these stimuli. 3.) Participants in the detection
condition will have significantly higher ratings on another pressure-perception task (the weighted
rod task) than participants in the distraction condition. 4.) Participants who direct attention
toward the detection of light touch sensations will experience more rapid increases in ratings of
subsequent sensations than participants who did not direct attention.
Methods
Participants in this study were drawn from a pool of undergraduate introductory
psychology students at The University of North Carolina at Chapel Hill. There were 80
participants, 22 male and 58 female. Participants were granted research credit for their
participation. Recruitment was done using the Psychology Department’s online participant pool
system. Participants were assigned to experimental conditions using alternating assignment, as
part of a yoked-control design.
Materials
This study utilized a variety of questionnaires, a Von Frey Hair detection task, a
distraction task, a line scaling exercise, a Von Frey Hair subjective scaling task, and a weighted
rod task.
Questionnaires
In order to measure participants’ hypervigilance, researchers used the Pennebaker
Inventory of Limbic Languidness (PILL: Pennebaker, 1983), the Body Vigilance Scale (BVS:
Schmidt et al. 1997), and the Pain and Vigilance Awareness Questionnaire (PVAQ: McCracken
1997). Three questionnaires for bodily vigilance were used. Each of these questionnaires
measure different facets of vigilance, providing a well-rounded picture of participants’
perceptive habits. The PILL is an implicit measure of vigilance that measures frequency of
bodily symptoms. The BVS and PVAQ are both explicit measures of vigilance. The BVS
measures vigilance to bodily sensations, and the PVAQ measures vigilance to pain.
The PILL asks participants to rate how frequently they experience 54 bodily symptoms.
These bodily symptoms include items such as “Racing heart,” “Eyes water,” and “Hot flashes.” .
never or almost never experienced the symptom;” “B: Less than 3 or 4 times per year;” “C:
Every month or so;” “D: Every week or so;” “E: More than once every week.” The PILL is
scored by counting every item that was given a response of C, D, or E, indicating high
frequency. Higher scores on the PILL indicate higher vigilance (Pennebaker 1983).
The BVS asks participants to rate their sensitivity to internal bodily sensations, over the
past week. The instructions include heart palpitations and dizziness as examples of bodily
sensations. The first two items ask the participant to rate how apt two description are of himself/
herself. These two descriptions are “I am the kind of person who pays close attention to internal
bodily sensations.” and “I am very sensitive to changes in my internal bodily sensations.” Scales
for these items range from 0 (Not at all like me) to 10 (Extremely like me) The third item asks
them to report the average amount of time they spend daily “scanning” their body for sensations,
such as sweating, heart palpitations, and dizziness. This item uses a scale from 0 (No time) to
100 (All of the time). In the final section, participants are asked to rate how much attention they
pay to a list of 15 sensations, on a scale from 0 (None) to 10 (Extreme). These sensations include
heart palpitations, chest pain/discomfort, numbness, shortness of breath/smothering, dizziness,
hot flash, sweating/clammy hands, among others (Schmidt et al. 1997). The BVS is scored by
summing the responses from the first two items, the third item divided by ten, and the average of
all responses on the 15 items about specific sensations. High scores indicate high levels of body
vigilance.
The PVAQ asks participants to consider their behavior over the past two weeks, and to
indicate how frequently a list of 16 descriptions were true of them. Frequency is indicated on a
a participant is to the presence, location, and intensity of pain (e.g. “I am very sensitive to pain.”
“I know immediately when pain starts or increases.” “I keep track of my pain level.”). This
questionnaire contains two reverse score items “I find it easy to ignore pain.” and “I do not dwell
on pain.” The PVAQ is scored by taking the sum of all items, with reverse scores for the two
items listed previously. High scores indicate high vigilance to pain.
Other questionnaires used include the State Trait Anxiety Inventory (STAI: Spielberger
1983), the Pain Catastrophizing Scale (PCS: Sullivan et al. 1995), and the Positive and Negative
Affect Scale (PANAS: Watson, D., Clark, L. A., & Tellegan, A. 1988). These questionnaires
were used to ensure that these factors were not affecting the results of the current experiment.
Previous studies show that perception can be altered when a person is in a state of high
anxiety (Spielberger 1983). To measure anxiety, the current study utilized the State portion of the
State Trait Anxiety Inventory. This questionnaire was used to ensure that our sample was not
experiencing a significant amount of anxiety, and to ensure that our experimental manipulation
did not cause any group to experience significantly different levels of anxiety. This questionnaire
instructs participants to “indicate how you feel right now, that is, at this moment.” Participants
respond to 20 statements about their current mood and level of arousal, using a visual scale with
four answer choices ranging from “Not at all” to “Very much so.” Examples of statements
include “I feel tense.” “I feel frightened.” I am presently worrying over possible misfortunes.”
and “I feel jittery.” Some of the reverse scored statements include “I feel calm.” “I feel secure”
“I feel self-confident” “I feel pleasant.” A high score indicates high levels of anxiety at the time
The PCS is used to measure pain catastrophizing. Pain catastrophizing can affect
perception, particularly perception of pain stimuli (Sullivan et al. 1995). The PCS reminds
participants about how the experience of pain is universally experienced. The instructions then
read that the current questionnaire is interested in thoughts and feelings people experience when
they are in pain. Participants are asked to think back to memories of pain, and to rate the degree
to which they have experienced the thoughts and feelings described by 13 items. These items
include “I worry all the time about whether the pain will end.” “I feel I can’t stand it anymore.”
“I can’t seem to keep it out of my mind.” Participants rate the degree to which they have these
thoughts on a scale ranging from 0 (not at all) to 4 (all the time). Higher scores indicate higher
levels of catastrophizing.
The PANAS is a scale designed to record feelings and emotions. The current study is
utilizing it to ensure that the mood of experimental groups are not significantly different.
Previous studies have shown that mood can affect perception. The PANAS contains 20 items,
each of which is a single word denoting a mood or emotion. These include “Interested,”
“Distressed,” “Strong,” “Irritable,” “Ashamed,” “Determined,” among others. Participants are
asked to “Indicate to what extent you feel this way TODAY” for each item. Participants make
their indications on a 5-point Likert scale ranging from “Very slightly or not at all” to
“Extremely.” This questionnaire is scored by summing the responses to the Likert scale for all
positive and negative moods/emotions, respectively. This produces two scores, one measuring
positive affect, and one measuring negative affect. The higher one’s score, the more strongly one
Participants also completed a Demographic Information Form, and the Current Pain
Questionnaire, two instruments developed in our lab. The Demographic Information Form asked
participants to denote their age, gender, ethnic category, racial category, and handedness. The
Current Pain Questionnaire requires participants to rate the average intensity, unpleasantness,
and frequency of pain of the last two weeks. Next, participants are asked to rate the intensity and
unpleasantness of any current pain. These first five items are rated on a scale from 0 to 100. The
remaining three items ask about the location of any current pain, existence of chronic pain, and
current use of pain medication.
Von Frey Filaments
Von Frey Filaments are nylon hairs often used to apply light touch stimuli to the skin of
experimental participants. These filaments are constructed such that when applied to a surface,
they will not exceed a certain threshold of downward force. Each filament in a set is constructed
with a certain stiffness such that it buckles when this threshold is reached. This buckling ensures
that once this threshold is reached, no additional force is exerted. Multiple tasks in this study
require application of light touch sensations with exact and consistent force. To accomplish this,
a set of von Frey filaments was used with strengths ranging from .008 g to 60g.
Fishy Game
The distraction condition plays an online video game called “Fishy!”. This game is a free
to play online flash game, and can be found online at http://fishy-flash-game.com/. In this game,
the player controls a small fish using the arrow keys. The objective of the game is to eat fish that
consumes fish, their score and the size of their fish increases. When a user’s fish is eaten, the
game ends and the user is assigned a final score. This game was utilized in the distraction task of
this study. Each game session was considered a trial, and the measured variable was the user’s
final score at the end of each game session. These scores were recorded and summed for each
member of the control group.
Procedure
First, participants gave written informed consent. Next, participants filled out the
Demographic Information Form, and then the Current Pain Questionnaire.
Next, the participant completed the first task. Participants in the experimental condition
performed a detection task, and participants in control condition completed a distraction task.
Detection Task
The experimental condition consisted of a detection task. Detection threshold for the
nylon filaments was measured using two-interval forced-choice tracking.
First, the experimenter explained that he would be applying light touch sensations to the
ventral side of the participant’s forearm, using delicate nylon filaments called von Frey Hairs.
The experimenter showed a filament to the participant, and explained what it was. Then the
experimenter explained the detection task.
Participants placed their right arm, palm up, underneath a cloth barrier. The experimenter
explained that the job of the participant was to detect when a stimulus was presented. On each
test interval lasted one second. Each stimulus was presented for half of a second at some point
during the one-second test interval. Trials were cued using a PowerPoint presentation that shows
a series of lightbulbs. A gray lightbulb signaled that no trial was currently occurring. The bulb
turned yellow for two seconds, indicating that a trial was about to occur. The bulb then turned
green for one second and a large white “A” was displayed on the screen to indicate the first
interval. The bulb then returned to yellow for two seconds to indicate that another interval was
about to occur. Then the bulb turned blue for one second and a large white “B” was displayed to
indicate the second test interval. Then the bulb returned to gray, and the word “RESPOND” was
flashed beneath it in white letters to indicate that the participant is supposed to respond verbally
by uttering which interval they think they stimulus occurred in, “A” or “B”. The experimenter
informed participants if they were correct or incorrect after every trial. This task consisted of 25
trial blocks, each block consisting of four trials. After the fourth trial of every trial block, a ten
second interval occurred to give the experimenter time to prepare for the next trial block.
The participant first started with one trial block of practice trials. The first filament used
was always one that delivered a force of 1.4g. If a subject was correct on all four trials of a trial
block, the next weakest filament was used to deliver the stimulus on the next trial block. If the
participant was correct on three of the trials in a block, the same filament was used for the
following trial block. If a participant was correct on two or fewer trials, the next strongest
filament was used for the next trial block. The strength of the filament used for each trial block
was recorded on the data sheet. After 25 trial blocks the task ended.
Participants were in the same position as the detection task group, with their arm palm up
underneath the cloth barrier. Participants receive the same stimuli as the detection group, except
they were tasked with playing a computer game called Fishy!. Participants were assigned to
groups using alternating assignment. A yoked-control design was used: Participants in the
distraction task received the identical series of stimuli as the participant in the detection task
group immediately prior. Participants were instructed to play the game, and if they lost, were to
announce their final score and then begin a new game.
Line Scaling Exercise
After the initial task, participants were given a short break. After this break, a numerical
scaling exercise was performed in preparation of the numerical scaling task with the nylon
filaments (von Frey hairs). The experimenter did this by drawing several lines on a piece of
paper, one at a time, and asking the participant to assign numbers to the lengths of the lines. The
participant was told to rate the perceived length of the line on whatever number scale seemed
most appropriate. Only zero and positive numbers could be used. The responses could be
integers, fractions, or decimals. The only rule was that numbers should be proportional to the
perceived lengths of the lines. The experimenter drew at least one line short enough to elicit a
rating less than “1”, and at least one line long enough to elicit a rating greater than “10”.
Subjective Scaling of von Frey hairs
Next, the experimenter explained that more filaments would be presented, some differing
in intensity from those previously presented. It was explained that the participant’s job was to
rate the perceived intensity of each filament, on whatever number scale seemed most
fractions, or decimals. The only rule was that the numbers should be proportional to the
sensation caused by the filament. If one filament produced a sensation twice as great as another
filament, it should receive a rating twice as large as the rating assigned to the other filament.
This task began with three practice trials using different von Frey hairs spanning the
range of those to be presented during archival trials. Then each of 11 filaments was presented
once in random order, then this was repeated. Thus, 22 filaments in total were presented.
Intensity responses were recorded after every trial. Filaments ranged in strength from 0.6g to
60g.
Weighted Rod Task
Next, participants completed a weighted-rod task. Participants were informed that this
task involved multiple trials in which pressure was applied to their forearm using a weighted rod.
The participant was asked to extend their right arm, palm up, through an opening in a
foam-board barrier. The weighted rod was positioned about half way between the participant’s wrist
and elbow. For each trial, the weighted rod was lowered on to the participant’s forearm for 15
seconds. The position of the participant’s arm was be adjusted slightly after each trial to avoid
stimulating the same spot repeatedly. Before the start of the weighted rod task, participants were
reminded that if the weight became intolerable they should tell the experimenter, who would
remove the weight immediately. No participant ever requested that the weight be removed
prematurely.
After each trial, participants were instructed to rate the intensity of the sensation on a
scale from zero to 100, where zero means no sensation and 100 means the most intense sensation
rod at all. Next, participants were instructed to classify the sensation as painful, unpleasant but
not painful, or neutral, in which neutral means neither pleasant not unpleasant. Lastly,
participants rated the unpleasantness of the sensation from zero to 100, zero meaning not at all
unpleasant and 100 meaning the most unpleasant sensation imaginable. These three responses
were recorded, and trials were carried out until all eleven trials were complete. Weights ranging
from 77g to 1077g were each presented once in random order.
Final Questionnaires
Participants completed the final six questionnaires in the following order: the PILL, the
BVS, the STAI, the PCS, the PANAS, and then the PVAQ. Then participants were debriefed,
and awarded their research credit.
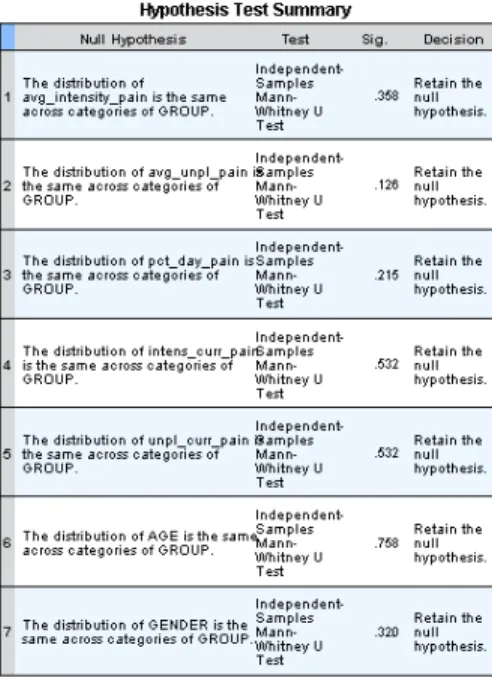
Results Initial Group Comparisons
Initial questionnaires gathered information about participants’ current pain, chronic pain,
and demographics. In order to make comparisons and draw conclusions about collected data, the
groups must be compared to ensure they do not show significant differences prior to the
experimental manipulation. Independent-Samples Mann-Whitney U Tests were used to test
group differences of age, gender, average intensity of recent pain, average unpleasantness of
recent pain, percent of each day spent thinking about pain, intensity of current pain, and
unpleasantness of current pain (Table 1). No significant differences between groups were found
Table 1. Independent Samples Tests of Group Differences on Pre-Manipulation Questionnaire
Items
Manipulation Checks
In order to draw conclusions about group differences, it must be proven that the course of
the testing session did not alter participants’ emotional state in a way that could be attributed as a
reason for observed changes in perception. Questionnaires used to examine this were the PCS,
STAI-Y1, and the PANAS. Furthermore, group differences on measures of body vigilance were
a subject of interest. Scores on the PILL, BVS, and PVAQ were analyzed to examine the effect
of the experimental manipulation on body vigilance.
Independent-samples t-tests were performed to examine mean differences between all
differences at the 95% confidence interval. On the PCS, members of the experimental group
tended to exhibit lower scores than members of the control group. The t-test showed a trend
toward significance for the PCS, t(78) = -1.575, p=.064.
Questionnaire Correlations
A correlation matrix was computed to examine relationships between body vigilance
questionnaires, and the other questionnaires administered post-manipulation. Mean questionnaire
scores for each group can be found in Table 2. The PILL was significantly positively correlated
with the STAI and PANAS-N; STAI: r(78) = .334, p<.01, PANAS-N: r(78) = .446, p<.01. The
BVS was significantly positively correlated with the PVAQ, PCS, and PANAS-P; PVAQ: r(78)
= .700, p<.01, PCS: r(78) = .321, p<.01, PANAS-P: r(78) = .229, p<.05. The PVAQ was
significantly positively correlated with BVS, PCS, and STAI (Appendix: Table 7).
Table 2.
Descriptive Statistics of Post-Manipulation Questionnaires
Questionnaire Group Mean Std. Deviation Std. Error Mean
PILL 1 16.60 8.47 1.34
2 17.38 8.84 1.40
BVS 1 18.50 6.53 1.03
2 19.64 6.80 1.07
STAI 1 31.93 8.97 1.42
2 31.93 8.42 1.33
PCS 1 16.38 9.33 1.47
2 20.10 11.69 1.85
PANAS_P 1 29.93 9.20 1.45
2 29.83 6.88 1.09
PANAS_N 1 13.53 3.12 0.493
2 13.65 4.34 0.686
PVAQ 1 31.48 12.47 1.97
Group 1: Experimental Group (Detection Task) Group 2: Control Group (Distraction Task)
The main effect of stimulus force was highly significant across both the VFH task and
WR task. This shows that as force exerted on a participant’s arm increased, they responded with
higher ratings of sensation intensity. This was to be expected, but is important to test. If the main
effect of force was found to be non-significant, any subsequent results would be of little to no
value.
Von Frey Hair Data
To test the hypothesis that experimental manipulations would have an effect on the slope
with which sensation intensity increased with regard to force, the data were transformed using
logarithms to the base ten (Gescheider 298-306; Hollins et al. 2009). Sensation intensity grows
exponentially as stimulus strength increases, according to the power law of psychophysics.
Therefore, by taking the logarithm of both sensation intensity and stimulus strength, the data will
be transformed such that the slope of transformed data is the same as the exponent with which
sensation intensity increases in the linear data. (Gescheider 298-306; Hollins et al. 2009).
The logarithmically transformed data were analyzed using an 11 (Force) x 2 (Order) x 2
(Group) mixed-model ANOVA. A significant main effect of group on sensation intensity was
found, with the experimental (detection task) group reporting higher sensation intensities than
that of the control (distraction task) group, F(1, 78) = 4.67, p<.05. This shows that the
experimental manipulation had an effect on participants’ sensation intensities. This supports the
hypotheses that direction of attention will cause an increase in sensation intensity of subsequent
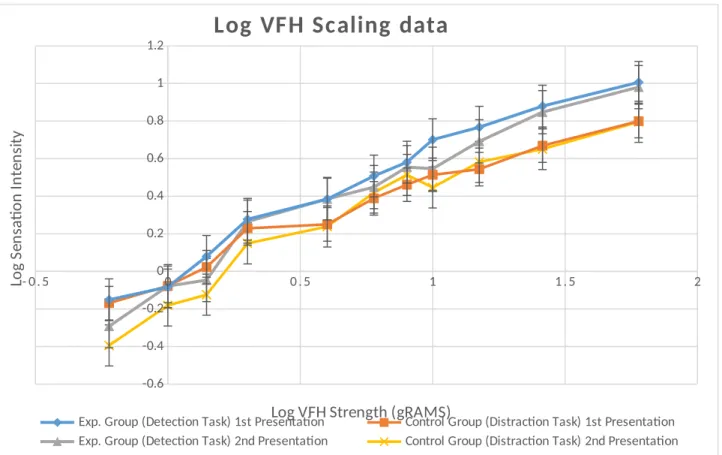
Each sensation intensity was presented twice during the VFH task. Each of the eleven
stimulus strengths was presented once in random order, then this same procedure was repeated to
administer a total of 22 randomly ordered stimuli. There was a significant main effect of this
order of presentation on sensation intensity, with the first presentation being rated significantly
higher for both groups, F(1, 78) = 20.206, p<.001 (See Figure 1).
- 0 . 5 0 0 . 5 1 1 . 5 2
-0.6 -0.4 -0.2 0 0.2 0.4 0.6 0.8 1 1.2
Log VFH Scaling data
Exp. Group (Detection Task) 1st Presentation Control Group (Distraction Task) 1st Presentation
Exp. Group (Detection Task) 2nd Presentation Control Group (Distraction Task) 2nd Presentation
Log VFH Strength (gRAMS)
Lo g Se n sa ti o n In te n si ty
Figure 1. Logarithmic Conversion of Relationship between Sensation Intensity and Von Frey Hair Strength Across Groups and Presentation Order
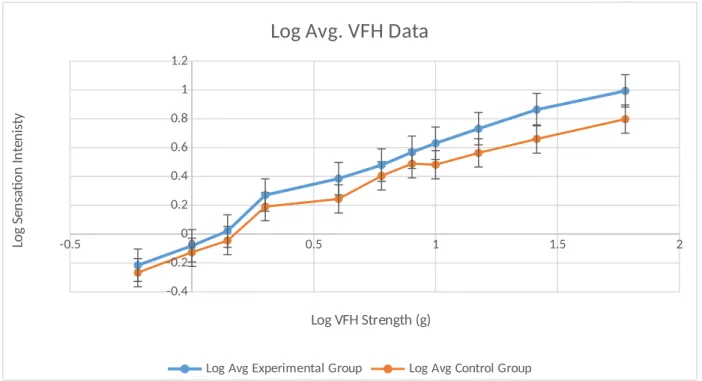
Because this effect was present in both groups, subsequent figures displaying VFH data
use an average sensation intensity rating across presentation order, in order to compare groups
force on sensation intensity. This suggests that order itself had an effect on sensation intensity,
but also that the impact of force depended on the order with which the stimulus was presented.
-0.5 0 0.5 1 1.5 2
-0.4 -0.2 0 0.2 0.4 0.6 0.8 1 1.2
Log Avg. VFH Data
Log Avg Experimental Group Log Avg Control Group
Log VFH Strength (g)
Lo g Se n sa ti o n In te n is ty
Figure 2. Logarithmic Conversion of Relationship between Average Sensation Intensity and Von Frey Hair Strength Across Groups
This effect of order likely occurred because participants encountered a new range of
stimulus strengths, and then habituated to these stimuli (Hollins et al. 2011). Participants
underwent three training trials, which spanned the range of the stimuli to be presented, but this
was not enough to cause complete habituation. A more extensive training routine for this task
would likely account for this effect of stimulus order, as it would cause habituation to occur
before the recorded trials.
The weighted rod task utilized 11 stimuli of varying strengths. In this task each strength
stimulus was presented only once. Participants were asked to rate intensity, unpleasantness, and
describe the sensation as neutral, unpleasant, or painful. These data were logarithmically
transformed for the same reasons as the von Frey hair data, described previously. Then, 11
(Force) x 2 (Group) mixed-model ANOVAs were run to investigate the effect of experimental
manipulations on logarithmic sensation intensity and sensation unpleasantness data.
Log Intensity. There was a significant main effect of force on sensation intensity, F(1, 78) =
183.08, p<.001. No other variables had a significant effect on sensation intensity. A graph of the
logarithmically transformed weighted rod intensity data is shown in Figure 4. This does not
support the hypothesis that subjects who directed attention would experience sensations as
significantly more intense than those who were distracted. This may have occurred because of
the difference in the experience of sensations produced by the von Frey hairs, and the weighted
rod. This suggests that amplification occurs only when sensations are very similar to those which
1.5 1.7 1.9 2.1 2.3 2.5 2.7 2.9 3.1 3.3 0 0.2 0.4 0.6 0.8 1 1.2 1.4 1.6 1.8
Weighted Rod Intensity
Exp. Group (Detection Task) Control Group (Distraction Task)
Log Weight (g)
Lo g Se n sa ti o n In te n si ty
Figure 3. Logarithmic Conversion of Relationship between Sensation Intensity and Weight of Weighted-Rod
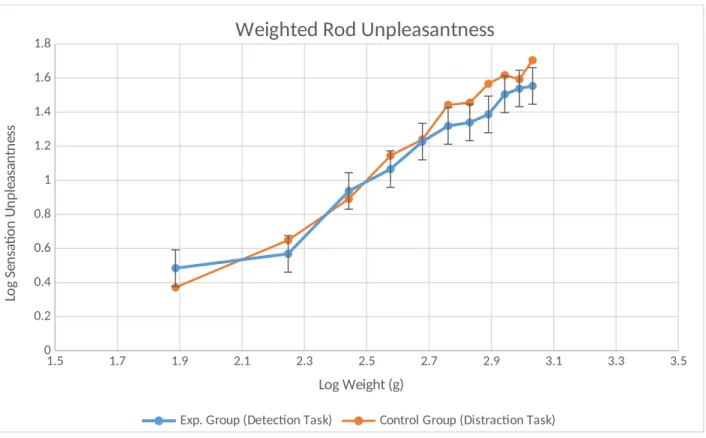
Log Unpleasantness.Descriptive statistics showed a tendency for the control group to rate
sensations as more unpleasant than the experimental group, but this was not significant, F(1, 78)
= 1.318, p = .254. There was a significant interaction of force and group F(10, 780) = 2.231,
p<.05. There was not a significant main effect of group on sensation unpleasantness. However,
there was a significant interaction effect of stimulus force and group on sensation unpleasantness
in the logarithmically transformed data, with the control group having higher levels of sensation
unpleasantness (See Figure 3). This implies that the impact of stimulus force on sensation
unpleasantness was affected by group. This contradicts the hypothesis that sensation
1.5 1.7 1.9 2.1 2.3 2.5 2.7 2.9 3.1 3.3 3.5 0 0.2 0.4 0.6 0.8 1 1.2 1.4 1.6
1.8
Weighted Rod Unpleasantness
Exp. Group (Detection Task) Control Group (Distraction Task)
Log Weight (g)
Lo g Se n sa ti o n U n p le as an tn es s
Figure 4. Logarithmic Conversion of Relationship between Sensation Unpleasantness and Weight of Weighted-Rod.
Correlations
There were no significant correlations between detection threshold during the detection
task, and any vigilance questionnaires. This fails to support the hypothesis that participants with
high body vigilance would be able to detect the more delicate von Frey hairs. In fact, this
measure was not significantly correlated with any questionnaires used (See Table 3).
Table 3. Pearson Correlation of Post-Manipulation Questionnaires and Detection Threshold in
Experimental (Detection Task) Group
PILL BVS STAI PCS
PANAS Pos.
PANAS
Detection Threshold
Pearson Correlation
.101 .023 .107 .049 -.011 -.133 -.109 1 Sig.
(2-tailed)
.537 .886 .512 .763 .947 .415 .504
N 40 40 40 40 40 40 40
*. Correlation is significant at the 0.05 level (2-tailed).
Discussion
The findings of the current study show that the manipulation caused no significant
differences between groups on vigilance questionnaires. Furthermore, there were no significant
between group differences on sensation intensity or unpleasantness on the weighted-rod task.
This indicates that a 100 trial task is not enough to alter overall bodily vigilance. However, the
manipulation was responsible for causing significant between-group differences on the von Frey
hair scaling task. This suggests that vigilance remains specific to the type of sensation being
attended to, and requires other factors to generalize to other types of sensations and modalities.
Perhaps the amplification occurs only within sensations that are highly physically similar,
or induce similar affect. In the present study, after 100 trials of direction of attention toward light
touch sensations, participants experienced subsequent, highly similar, sensations as more intense.
Yet, this same group did not experience amplification in the weighted rod task, which supplied
stronger, blunter stimuli.
Diversified Hypervigilance
It could also be posited that for chronic pain patients, as the perceptual style of
amplification is developing, a patient begins attending to sensations associated with their disease.
manifestation and severity. This could produce a wide variety of sensations, all of which would
be attended to with increasing regularity.
Chronic pain conditions are very complex. Perhaps use of healthy participants in the
current study has helped illustrate how the initial stages of chronic pain affect perception. The
results of the current study suggest that amplification is highly specific to the type of sensation
attended to. Commonly, as chronic pain conditions worsen, symptoms are accompanied by
cognitive decline, often described as a mental fog. This could be due to development of a habit
of attending to a large number of specific sensations. Directing attention in many directions
would reasonably contribute to cognitive overload, and this direction of attention could cause
each of these types of sensations to become amplified over time. As more sensations are attended
to, there is increased possibility that associations between sensations would form, which would
result in a perceptual style which resembles generalization of hypervigilance.
This set of symptoms would resemble something concurrent with the concept of
generalized hypervigilance, but a more fitting explanation based on the findings of the current
study is diversified hypervigilance. The results of this study suggest that perceptual amplification
remains restricted to sensations that are very similar to that which are habitually attended to.
Generalized hypervigilance occurs when a diverse set of sensations is habitually attended to,
which can over time cross to different modalities like light and sound, such as is shown in
Hollins et al. (2009). These results provide support for the Attentional Gain Model of
hypervigilance.
The current study suggests an explanation for the origin of perceptual amplification,
out small and specific, and over time expands its scope and severity. This explanation also posits
that attention is the underlying mechanism. Most real-world cases involve a noxious motivation
to direct attention, such as chronic pain. However, the current study has shown that repeated
direction of attention toward neutral stimuli can also cause perceptual amplification.
Suggestion of Future Research
A future study in this domain might use a similar design as the current study, but rather
than using light tactile stimuli in the experimental manipulation, this proposed study could use
stimuli more similar to the weighted-rod. If this proposed study yielded significant
between-group differences of weighted-rod task sensation intensity, and non-significant between between-group
differences of von Frey hair sensation intensity, it would support the interpretation that the
direction of attention is the mechanism responsible for perceptual amplification, but that
References
Chapman, C. R. (1978). The Hurtful World: Pathological Pain And Its Control. Feeling
and Hurting,263-301.
Gescheider, G. A. (1997). Psychophysics: The Fundamentals. (Third ed.). Mahwah, New
Jersey: Lawrence Erlbaum Associates. Chapters 5, 6, & 11.
Hollins, M., Harper, D., & Maixner, W. (2011). Changes in pain from a repetitive
thermal stimulus: The roles of adaptation and sensitization. Pain,152(7), 1583-1590.
Hollins, M., Harper, D., Gallagher, S., Owings, E. W., Lim, P. F., Miller, V., Siddiqi, M.
Q., & Maixner, W. (2009). Perceived intensity and unpleasantness of cutaneous and
auditory stimuli: An evaluation of the generalized hypervigilance hypothesis. Pain,
141(3), 215-221.
Hollins, M., & Walters, S. (2016). Experimental hypervigilance changes the
intensity/unpleasantness ratio of pressure sensations: evidence for the generalized
hypervigilance hypothesis. Experimental Brain Research, 234(6), 1377-1384.
McCracken, L. M. (1997). “Attention” to pain in persons with chronic pain: A behavioral
approach. Behavior Therapy,28(2), 271-284.
McDermid, A. J., Rollman, G. B., & McCain, G. A. (1996). Generalized hypervigilance
Pennebaker JW (1982) The psychology of physical symptoms. Springer, New York
Schmidt, N. B., Lerew, D. R., & Trakowski, J. H. (1997). Body vigilance in panic
disorder: evaluating attention to bodily perturbations. Journal of Consulting and Clinical
Psychology, 65(2), 214-220.
Spielberger CD (1983) Manual for the state-trait anxiety inventory (STAI). Consulting
Psychologists Press, Palo Alto
Sullivan MJL (2009) PCS: the pain catastrophizing scale, user manual. McGill Univ,
Montreal
Telch, M. J., Lucas, J. A., Schmidt, N. B., Hanna, H. H., Jaimez, T., & Lucas, R. A.
(1993). Group cognitive-behavioral treatment of panic disorder. Behaviour Research and
Therapy,31(3), 279-287.
Rost, S., Van Ryckeghem, D. M., Schulz, A., Crombez, G., & Vogele, C. (2017).
Generalized hypervigilance in fibromyalgia: Normal interoceptive accuracy, but reduced
self-regulatory capacity. Journal of Psychosomatic Research, 93, 48-54.
Van Damme, S., Van Hulle, L., Spence, C., Devulder, J., Brusselmans, G., & Crombez,
G., (2015). Generalized hypervigilance for innocuous tactile stimuli in patients with
fibromyalgia: an experimental approach. European Journal of Pain, 19(5), 706-714.
measures of positive and negative affect: The PANAS scales. Journal of Personality and
Appendix
Table 4.
Correlation Matrix of Post-Manipulation Questionnaires
Group PILL BVS STAI PCS
PANAS_ P
PANAS_
N PVAQ
Group Pearson Correlation 1 .045 .086 .000 .176 -.006 .017 .168
Sig. (2-tailed) .690 .446 1.000 .119 .956 .883 .136
N 80 80 80 80 80 80 80 80
PILL Pearson Correlation .045 1 .210 .334** .123 -.148 .446** .180
Sig. (2-tailed) .690 .061 .002 .278 .190 .000 .111
N 80 80 80 80 80 80 80 80
BVS Pearson Correlation .086 .210 1 .112 .321** .229* .200 .700**
Sig. (2-tailed) .446 .061 .321 .004 .041 .076 .000
N 80 80 80 80 80 80 80 80
STAI Pearson Correlation .000 .334** .112 1 .288** -.361** .597** .250*
Sig. (2-tailed) 1.000 .002 .321 .010 .001 .000 .025
N 80 80 80 80 80 80 80 80
PCS Pearson Correlation .176 .123 .321** .288** 1 -.223* .254* .651**
Sig. (2-tailed) .119 .278 .004 .010 .047 .023 .000
N 80 80 80 80 80 80 80 80
PANAS_P Pearson Correlation -.006 -.148 .229* -.361** -.223* 1 -.052 .063
Sig. (2-tailed) .956 .190 .041 .001 .047 .645 .581
N 80 80 80 80 80 80 80 80
PANAS_ N
Pearson Correlation .017 .446** .200 .597** .254* -.052 1 .207
Sig. (2-tailed) .883 .000 .076 .000 .023 .645 .066
N 80 80 80 80 80 80 80 80
PVAQ Pearson Correlation .168 .180 .700** .250* .651** .063 .207 1
Sig. (2-tailed) .136 .111 .000 .025 .000 .581 .066
N 80 80 80 80 80 80 80 80
**. Correlation is significant at the 0.01 level (2-tailed). *. Correlation is significant at the 0.05 level (2-tailed).
Table 5.
Independent Samples Test of Post-Manipulation Questionnaires by Group Levene's Test
for Equality
of Variances t-test for Equality of Means
F Sig. t df
Sig. (2-tailed
) Mean DifferenceStd. Error Difference
95% Confidence Interval of the Difference
Lower Upper
PILL Equal variances
assumed .012 .914 -.400 78 .690 -.77500 1.93599 -4.62926 3.07926
Equal variances not assumed
-.400 77.86 0
.690 -.77500 1.93599 -4.62937 3.07937
BVS Equal variances
assumed
.201 .655 -.767 78 .446 -1.14292 1.49059 -4.11046 1.82463
Equal variances not assumed
-.767 77.87 6
.446 -1.14292 1.49059 -4.11054 1.82470
STAI Equal variances assumed
.048 .827 .000 78 1.000 .00000 1.94599 -3.87418 3.87418
Equal variances not assumed
.000 77.68 9
1.000 .00000 1.94599 -3.87442 3.87442
PCS Equal variances
assumed
3.524 .064 -1.575 78 .119 -3.72500 2.36467 -8.43269 .98269
Equal variances not assumed
-1.575 74.32 3
.119 -3.72500 2.36467 -8.43636 .98636
PANAS_P Equal variances
assumed 2.451 .121 .055 78 .956 .10000 1.81598 -3.51534 3.71534
Equal variances
not assumed .055 72.208 .956 .10000 1.81598 -3.51991 3.71991
PANAS_N Equal variances
assumed 1.830 .180 -.148 78 .883 -.12500 .84545 -1.80817 1.55817
Equal variances not assumed
-.148 70.81 7
.883 -.12500 .84545 -1.81086 1.56086
PVAQ Equal variances assumed
1.358 .247 -1.505 78 .136 -4.63750 3.08228 -10.77385 1.49885
Equal variances not assumed
-1.505 75.50 7