Abstract—In this paper, we present a model to simulate and evaluate the direct, indirect economic and environmental impacts of the implementation of building energy efficiency standards on Chinese economic system and environment. In contrast to the usual rough estimation, we evaluate the direct economic impact degree by 4 indices, the direct environmental impact degree by 5 indices, the indirect economic impact degree by 1 index of 34 sectors and by 2 indices of the Chinese economic system. This research makes it possible to link developments in the implementation of building energy efficiency standards with environmental and economic structure change. In the model, 12 indices are evaluated in two scenarios. The main findings of this research are that the implementation of building energy efficiency standards can ease China's energy and water shortage pressure, can directly promote the development of construction materials industry and construction industry, and indirectly promote the development of tourism, scientific research, post and telecommunications and other industries except two energy industries. More important, it can also reduce a large amount of pollutants emissions and increase the GDP. At the same time, it enables resident and government sector save considerable energy consumption expenditures and their living and working environments to be solidly improved.
Index Terms—Building energy efficiency standards, Direct economic impact, Direct environmental impact, Indirect economic impact, Input-output analysis.
I. INTRODUCTION
China is facing a major challenge posed by increasing energy requirement. From 2000 to 2020, the national planning targets call for quadrupling the value of China's GDP with a concomitant doubling of energy consumption, implying an energy elasticity coefficient should be 0.5.
Manuscript received August 8, 2008. This work was supported in part by the Ministry of Housing and Urban-Rural Development of the People’s Republic of China project ‘Evaluate Economic Impact of BEES on National Economy, the National Natural Science Fund of China under Grant 70701034, and the Knowledge Innovation Programs of Chinese Academy of Sciences.
Xiuli Liu is with the Academy of Mathematics and Systems Science, Chinese Academy of Sciences, Zhongguancun East Road No.55, Beijing 100190, China ( phone: +1-217-721-0059; +86-10-62553061; fax: +1-217-244-9339; +86-10-62541823; e-mail: [email protected]).
Shouyang Wang is with the Academy of Mathematics and Systems Science, Chinese Academy of Sciences, Zhongguancun East Road No.55, Beijing 100190, China (e-mail: [email protected] ).
Cuihong Yang is with the Academy of Mathematics and Systems Science, Chinese Academy of Sciences, Zhongguancun East Road No.55, Beijing 100190, China (e-mail: [email protected] ).
Geoffrey J. D. Hewings is with Regional Economics Applications Laboratory, University of Illinois, 607 S. Mathews, #318,Urbana, IL 621801, USA (e-mail: [email protected] ).
However, in the last three years, the coefficient was estimated at more than 1.3, suggesting that future energy levels (absent any major conservation efforts or significant improvements in efficiency) will be far higher than those estimated by the current planning’s forecast. From the perspective of development trends, China's development has entered into the heavy industry stage. According to the development experience in the rest of the world, the stage of rapid growth in energy requirement of China seems to be insurmountable [1].
Chinese energy consumption is 3 times of the world's average level, 11 times of that of Japan to produce each dollar value of current output. Debate has centered on the relative merits of expanding capacity (through the building of an enormous number of new power plants) in contrast to improving energy use efficiency [2].
Using the ratio of energy consumption, as to preliminary estimations, over the period from 2001 until 2006 the energy consumed by civil buildings in urban areas accounted for 20-27% of the total energy consumption yearly in China. In 2006, the total energy consumption of civil buildings in urban areas is 539.75 million tce, which accounted for 24.5% of the total energy consumption in China. With the continuous improvement of the living standards, building energy consumption will rise [3].
Building energy consumption of per unit area of walls and roofs in China is 3-5 times of that in developed countries; of windows is 2-3 times in China of that in developed countries. Obviously, improvements of building energy efficiency are urgently needed. As an effective way, the implementation of building energy efficiency standards can achieve the goal.
There are mainly 17 building energy efficiency standards, codes and technical specifications that had been enacted by the MOHURD (Ministry of Housing and Urban-Rural Development of the People’s Republic of China) until 2007 [4]. With the same indoor temperature, humidity and comfort, buildings that are adopted building energy efficiency standards will save 30-85% of the energy consumed by those which are not adopted them. JGJ26-95, JGJ134-2001, JGJ75-2003 and GB50189-2005 are the core of these standards. The other items play support and complementary roles to the above four. We call all 17 items in APPENDIX B as the Building Energy Efficiency Standards (BEES) commonly in the later analysis for their same aim to improve building energy consumption efficiency.
BEES have been implemented slowly and poorly in China. By the end of 2002, there was only 230 million m2
Simulating and Evaluating the Impacts of the
Implementation of Building Energy Efficiency
Standards on Chinese Economic System and
Environment
existing floor space of civil buildings that were adopted the BEES in China, which accounts for 0.86% of the Chinese total existing floor space of civil buildings [5]-[6]. With great efforts of Chinese government to improve the implementation of the BEES, the ratio increased to nearly 5.3% until October, 2007.
China has made more mandates on implementing BEES in the recent years. It was ordained that all the newly built civil buildings must be adopted 50% of BEES strictly, those in large cities and developed districts should adopt 65% of BEES [7]. The civil building energy efficiency task was set to save 110.4 million tce by the end of the 11th -Five-Year-Plan, in which the newly built energy efficient civil buildings should save 75.2 million tce; the existing civil buildings should save 35.2 million tce by energy efficient reconstruction [8].
Implementation of BEES would obviously have many important environmental and economic benefits both regionally and globally [9]-[14]. The aim of this study is to evaluate the direct and indirect economic and environmental impacts of the implementation of BEES, in contrast to the usual rough estimation. The data should pave the road to find solutions to relief energy requirement pressure and to reduce the environmental problems caused by the building energy consumption.
Some studies on the social and economic issues [15]-[18], the objectives and policies [19]-[20] of implementation of BEES have been conducted. These studies were focused on the qualitative analysis and policy suggestions of economic impact of building energy efficiency, quantitative studies were just limited to the roughly direct economic impact estimation. However, there have been no analysis and evaluation for the direct and indirect impacts of the implementation of BEES on Chinese economic system and environment.
II. ASSUMPTIONS
Referred to the national energy efficiency policies ([7]-[8], [21]) and their implementation status until 2008 in China [22], with suggestions from building energy efficiency advisors of the MOHURD, two scenarios are assumed to simulate the implementation of BEES policies.
When k=1, assume that policy [7] was implemented in 2002, the newly built civil buildings in Beijing, Tianjin, Shanghai, Guangzhou and Chongqing were all adopted 65% of BEES; those in other urban districts were all adopted 50% of BEES; while other aspects of the economy maintain the status quo prior to 2002. When k=2, assume that policies ([8], [21]) combined with policy [7] were implemented in 2002. 85 million m2 floor area of the existing urban civil buildings were reconstructed to adopt 50% of BEES; 75% of the newly built civil buildings in Beijing, Tianjin, Shanghai, Guangzhou and Chongqing were adopted 65% of BEES; 75% of the newly built civil buildings in other urban districts adopted 50% of BEES; while other aspects of the economy maintain the status quo prior to 2002.
By the end of 2002, only 0.86% of floor area of the existing civil buildings adopted the BEES in China [23]. Therefore, we can assume in 2002 no BEES were implemented in China. Using the 2002 China input-output
table with 34 sectors (see APPENDIX A) as the compared origin, we can make an analysis and evaluation on the economic and environmental impacts of the implementation of BEES in two scenarios by a static comparison.
III. ANALYSIS OF IMPACTS
Buildings that adopted BEES would have been saving much energy in heating, air conditioning, lighting and other aspects after they were put into use ([4]-[5], [13], [18]), which is reflected by a reduction in the resident and government consumption of sector 17(Coal, oil and natural gas, electricity, heat, water production and supply) (see APPENDIX A). This will be called as the direct economic impact of the implementation of BEES on civil buildings energy consumption, which will be evaluated by indices CEC (the changed degree of energy consumption) and CEE (the changed degree of expenditures on energy consumption) in Section Ⅳ.
At the same time, sulfur dioxide, carbon dioxide, nitrogen oxides, soot emissions and water consumed to produce electricity is reduced because of the reduced building energy consumption ([18], [24]). This will be called as the direct environmental impact of the implementation of BEES, which will be evaluated by 5 indices SDE (sulfur dioxide emission reduced degree), CDE (carbon dioxide emission reduced degree), QSW (the water saved degree due to electricity saved), NOE (nitrogen dioxide emission reduced degree) and SER (soot emission reduced degree) in SectionⅣ.
The costs of energy efficient civil buildings are generally higher than those of non energy efficient ones because of the use of energy efficient technologies and new construction materials which price are mostly higher than the traditional construction materials ([3], [17], [19], [25]), which is reflected mainly by an increase of the intermediate use of sector 18 (Construction) from sector 9 (Construction materials) (see APPENDIX A). Sector 9 is combined by 5 sectors which are non-metallic mineral products, metal smelting and rolling processing, metal products, wood processing and furniture manufacturing, chemical in the 2002 China input-output table with 42 sectors published by the National Bureau of Statistics of China. The combination is to make sector 9 include most of construction materials. Certainly, the intermediate use of sector 18 (Construction) from other sectors such as agriculture may also be increased, the paper could only consider the main impact due to the data restriction. China is divided into three climate zones which are freezing and cold zone, hot summer and cold winter zone, hot summer and warm winter zone. The average increased ratios of the unit floor area cost of the urban energy efficient civil buildings in the three climate zones compared with non energy efficient ones are estimated separately (Table 1). This will be called the direct economic impact of the implementation of BEES on the intermediate use of construction industry, which will be evaluated by index CIU (the changed degree of intermediate use of construction) in Section Ⅳ.
that of comparable non-energy efficient ones [26]; the total profit of energy efficient civil buildings is about 14% higher than that of non-energy efficient ones averagely [27]; the life-span of the energy efficient civil buildings can be extended at least 20 years longer in China [28]. These impacts are reflected by the change of the primary input (net product tax, operating surplus, compensations of employees, fixed assets depreciation) of sector 18 (Construction) (see APPENDIX A). This will be called the direct economic impact of the implementation of BEES on the primary input of construction industry, which will be evaluated by index CII (the changed degree of primary input of construction) in SectionⅣ. Next, these direct impacts will further affect the development of other industries through chain effect. For example, the saved expenditures from the energy efficiency may be used in other production activities such as education investment, food and clothing consumption etc., which will increase investment or consumption of these industries, and further promote or facilitate the development of these industries, and through chain effect, further affect the development of other industries. These will be called the indirect economic impacts of the implementation of BEES, which will be evaluated by indexes CTOE (the changed degree of the total output of each sector), CTO (the changed degree of the total output), CVA (the changed degree of the total value added).
[image:3.595.307.550.160.537.2]This study uses the improved partial closed input-output model to evaluate the indirect economic impacts of the implementation of BEES on total output and value added of each industry in national economic system. The partial closed input-output model [29] initially does not include the indirect impacts of the change of government consumption; it turns out that in China 2002 input-output table the government consumption accounted for 26.7% of the final consumption. The change of government consumption will have distinct impact on national economic system. Hence, government consumption should also be added together to residential consumption as a column vector to the first quadrant of the partial closed input-output model. Correspondingly, the row vector that added to the first quadrant of the partial closed input-output model should also include part of net product tax and operating surplus besides compensations of employees. Then the improved direct consumption coefficient matrix
* *
A can be obtained. (I- **
A )−1
[image:3.595.47.288.645.756.2]will be the improved partial close Leontief inverse, which can also reflect direct and indirect need of each sector’s output that derived from government consumption and revenue changes.
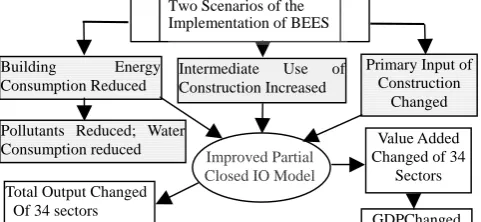
Fig.1 Main economic and environmental respects that are affected by the implementation of BEES
Mainly economic and environmental respects that are affected by the implementation of BEES are described in Fig.1. The rectangles in gray backgrounds in Fig.1 are about direct impacts of the implementation of BEES. Others are about indirect impacts.
IV. MODEL
The model to evaluate the direct and indirect economic and environmental impacts of the implementation of BEES is presented as follows:
1 65 . 0 1 1
1 Q/(A A )*A *s *u Qck = c w+ a a
Δ (1)
1 5 . 0 2 1
1 Q*c/(A A A)*(A A A )*s *u
Qek = e c+ n− w n− a − a
Δ
1 65 . 0 2* * *
)
/(A A A A s u
Qe c+ n− w a
+ (2)
2 5 . 0 1 1
2 Q *0.75 Q/(A A )*p*A *s *u
Qck =Δ ck + c w+ a w
Δ (3)
2 5 . 0 1
2 Q *0.75 Q /(A A)*p*A*s *u
Qek =Δ ek + e c− w c
Δ (4)
2 / ) / /
( ck c ek e
k Q Q Q Q
CEC = Δ +Δ (5)
ek ek k e ck ck
k Q P Q P Y
CEE =(Δ +Δ )/ (6)
s es k e cs ck
k Q Q Q Q Q
SDE = (Δ +Δ )/ (7) h eh k e ch ck
k Q Q Q Q Q
CDE = (Δ +Δ )/ (8)
w ew k e
k Q Q Q
QSW = Δ / (9)
d ed k e
k Q Q Q
NOE =Δ / (10) g
cg k c
k Q Q Q
SER = Δ / (11)
β
α )*
3 1 1 ( sk k BC s s
CIU ∑ ∗
= +
= (12)
) * ( * ) 1 ( ) ( * ) 1
(( t 9 k r 9 k
k r T T r R R
CII = + ∗ β + + β
+
(1 )*( )9 k
p P P
r ∗ β
+ +
9
9 ))/
( * ) 1
( +rd D ∗Dβk I
(13)
Y A I Y A I
Xk k** 1k ** 1
) ( )
( − − − − −
=
∇
(14)
j kj
k X X
CTOE =Δ /
(15)
) /( ) ( 1 1
∑
∑
= = Δ = n j j n j kjk X X
CTO (16)
j j vj
X V
a = (17)
) /( ) * ( 1 1
∑
∑
= = Δ = n j j kj n j vjk a X V
CVA (18)
Where,ΔQck1,ΔQck2;ΔQek1, ΔQek2are the quantity of coal
and electricity saved in scenarios k=1 and k=2,Qcis the quantity of coal consumed by heating of the urban civil buildings,Qeis the quantity of electricity consumed by the
urban civil buildings except heating,Awis the existing floor
area of the urban civil buildings in freezing and cold climate zone,Acis the existing floor area of the urban civil
buildings,Anis the floor area of the national newly built
urban civil buildings,Aa1,Aa2is the floor area of the newly
built civil buildings in Beijing and Tianjin; Shanghai, Chongqing and Guangdong,s0.65,s0.5are the rations of energy efficient when the 65%, 50% BEES are implemented,u1,u2are the rations of the use time of newly
built energy efficient building, reconstructed existing urban civil building in the year they were built or reconstructed to one year, cis the ration of the energy consumption of the urban civil buildings to the total energy consumption of urban buildings, pis the ratio of the reconstructed floor Improved Partial
Closed IO Model Total Output Changed
Of 34 sectors
Value Added Changed of 34
Sectors
GDPChanged Primary Input of
Construction Changed
Pollutants Reduced; Water Consumption reduced Building Energy Consumption Reduced
area of the existing urban civil buildings toAc.
k
CEC is the changed degree of energy consumption in scenario k,CEEkis the changed degree of expenditures on
energy consumption in scenario k,Yeis the resident and
government final demand on energy consumption, ΔQck,
ek Q
Δ are the saved quantity of standard coal, electricity in scenario k,Pck,Pek are the manufacturer's price of standard coal, electricity in scenario k,SDEk,CDEk,NOEk,SERk are
the sulfur dioxide, carbon dioxide, nitrogen dioxide and soot emissions reduced degree in scenario k,Qs,Qh ,
d
Q andQgare the quantity of sulfur dioxide, carbon dioxide,
nitrogen dioxide and soot emissions in research year,Qcs,
ch
Q andQcgare the reduced emissions of sulfur dioxide,
carbon dioxide and soot when one ton of standard coal is saved,Qes,QehandQedare reduced emissions of sulfur dioxide,
carbon dioxide, nitrogen dioxide when one kilowatt-hour electricity is saved,QSWkis the water saved degree due to
electricity saved in scenario k,Qwis the quantity of domestic
water in research year,Qewis the saved quantity of water when one kilowatt-hour electricity is saved.
k
CIU is the change degree of intermediate use of
construction in scenario k,αsis the average increased ratio of the unit floor area cost of the urban energy efficient civil buildings at the s climate zone compared with non energy efficient urban civil buildings (s=1,2,3),BCsk is the floor area of the urban energy efficient civil buildings in the s climate zone in scenario k,β is the ratio of the output of urban civil building construction to the total output of construction industry in the research year.
k
CII is the changed degree of primary input of
construction in scenario k, I9is the primary input of
construction industry in the research year,rt ,rr,rp,rd are
the average increased ratio of net product tax, compensations of employees, operating surplus, fixed assets due to the implementation of BEES,T9,R9,P9,D9
are the net product tax, compensations of employees, operating surplus and fixed assets of construction industry in the input-output table,Tβk,Rβk,Pβk,Dβk are the ratio of the net product tax, compensations of employees, operating surplus and fixed assets that are derived from energy efficiency civil buildings’ sales income to the net product tax, compensations of employees, operating surplus and fixed assets of construction industry in scenario k.
Yis the column vector of final demand,Ykis the column
vector of final demand in scenario k, **
A is the improved direct consumption coefficient matrix, **
k
A is the improved direct consumption coefficient matrix in scenario k,ΔXkis the change of total output of vectorXin scenario k, I is the unit matrix.
k
CTOE is the changed degree of the total output of each
sector in scenario k,ΔXkjis the change of total output of
sector j in scenario k, j
X ,Vj are the total output, value
added of sector j,CTOk,CVAk are the changed degree of the
total output, of the total value added in scenario k,avjis the
value added coefficient of sector j,ΔGDPkis the change of
GDP in scenario k.
In the model (1)-(18), equations (1)-(5) are to evaluate the saved degree of standard coal and electricity for the implementation of BEES in scenario k. Equation (6) is to evaluate the direct economic impact degree for it on the building energy consumption. Equations (7) - (11) are to evaluate the direct environmental impact degree for it. Equations (12) - (13) are to evaluate the direct economic impact degree for it on intermediate use, primary input of construction industry. Equations (14)-(18) are to evaluate the indirect economic impact degree for it on the total output of each sector, total output and total value added in national economic system.
V. DATA SOURCE AND PARAMETERS ESTIMATION
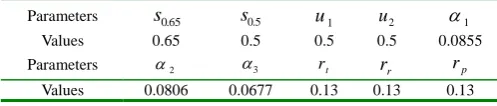
[image:4.595.302.551.472.525.2]The energy consumption data for urban civil building in China is quoted from [30]. Data of floor area of urban civil buildings is from China Statistics Book 2007. Parameters used in the evaluation are deduced from a national questionnaire survey on the economic impacts of BEES, which was conducted by Academy of Mathematics and Systems Science, CAS with the assistance of the MOHURD1in 2008. 2,589 questionnaires were responded. Combined with the data checked from literatures that were refered in SectionⅢ, after data processing and statistical analysis, we estimated the parameters needed in the model (see Table 1).
Table 1 Parameters and their values used in the evaluation
Parameters s0.65 s0.5 u1 u2 α1
Values 0.65 0.5 0.5 0.5 0.0855
Parameters α2 α3 rt rr rp
Values 0.0806 0.0677 0.13 0.13 0.13
VI. RESULTS AND DISCUSSION
The evaluation results of the direct economic and environmental impacts of the implementation of BEES in scenario k can be seen in Fig.2. There have nine indexes, in which CDE, SDE, NOE, SER, QSW are indexes about direct environmental impact, other indexes are about direct economic impact.
Fig.2 shows that seven indexes have negative impact degrees, in which CEE has the biggest absolute direct impact degree. This reveals that the implementation of BEES in scenario k can reduce large amount of expenditure on the buildings energy consumption, which could bring benefits for residents and government directly.
There are two indexes CIU and CII that have positive impact degrees. It shows the implementation of BEES will promote the development of construction industry and construction material industry directly. CII is derived from the increased sales income of newly built urban energy efficient civil buildings. In scenario k=1, the floor area of
the newly built urban energy efficient civil buildings is bigger than that in scenario k=2, so the CII in scenario k=1 is bigger than that in scenario k=2.
-2.57%
-7.96%
5.81%
-3.32%
-11.00%
-4.59%
-0.15% -0.46% -2.46% -1.07%
3.00%
-0.21% -0.73% -3.36% -1.48%
-3.66%
3.21% 4.52%
-12.00% -10.00% -8.00% -6.00% -4.00% -2.00% 0.00% 2.00% 4.00% 6.00% 8.00%
CEC CEE CIU CII CDE SDE NOE SER QSW
D
ir
ect
I
m
p
act
D
eg
ree
k=1 k=2
Fig.2 Direct impact degrees of the implementation of BEES on economic and environmental indexes in scenario k
The figures of CDE, SDE, NOE, SER, QSW in Fig.2 show the implementation of BEES has remarkable effect on main pollutants emissions reduction and water saving for energy saving. The key reasons are as follows. In china about 78% of electricity is thermal power2 that uses coal as primal fuel, which lead to a large amount of pollutant emissions. In 2005 51% sulfur dioxide emission was from thermal power production in China [31]. To produce thermal power is also water consumed. To save 1 kilowatt-hour electricity equals to save 4 liters of water averagely3. The building energy consumption for heating in cold and freezing climate zone accounts for about 34% of the total building energy consumption yearly [30]. Most of fuel used for heating is also coal.
In scenario k=2 more energy is saved, so its environmental effects are more remarkable than those in scenario k=1.
We can see the indirect economic impacts of the implementation of BEES on total output of sector 17 (Coal, oil and natural gas, electricity, heat, water production and supply) and on sector 8 (Petroleum processing, coking and nuclear fuel processing) are negative, while its indirect economic impacts on total output and value added of other sectors are positive (Fig.3). It has been shown by CEE that the implementation of BEES will lead to a significant reduction in building energy consumption directly, sector 17 and sector 8 are energy production and supply sectors, their total output will surely be reduced. On the other hand, through the interaction and mutual influence among various industries in the national economic system, the direct economic impacts will promote the development of other industries and make their total output increased. In Fig.3, the changed degree of total output of sector 27(Tourism) is the largest followed by sector 28 (Scientific research), sector 20 (Post and telecommunications), sector 14 (Instruments, meters, cultural and office machinery) and sector 33 (Culture and arts, sports, entertainment) etc. In scenario k=2, more floor area was adopted BEES than in scenario k=1, so the absolute changed degrees of 34 sectors’ total outputs for the implementation of BEES in scenario k=2 are bigger than those in scenario k=1.
2 http://news.machine365.com/arts/080119/1/244582.html 3 http://www.ccchina.gov.cn/cn/NewsInfo.asp?NewsId=3695
The total economic impacts of the implementation of BEES on total output and total value added are positive (Fig.4). These impacts are likely to continue into the future and increase as a higher proportion of buildings adopted the new energy efficiency standards. Though figures of CTO and CVA are small (Fig.4), considering the implementation of BEES has remarkable effect on pollutants emission reduction, this is an exciting result which points out a practical way to save energy and reduce pollutants emission.
0.0179%
0.0025% 0.0252%
0.0038%
0.000% 0.005% 0.010% 0.015% 0.020% 0.025% 0.030%
CTO CVA
In
di
re
ct
Im
pa
ct
D
eg
re
e
k=1 k=2
Fig.4 Indirect impact degrees of the implementation of BEES on total output and total value added of the whole economic system in scenario k
APPENDIX
A. Sector code and its corresponding name of China 2002 input-output table with 34 sectors
Sector
Code Sector Name
Sector
Code Sector Name
1 Agriculture 18 Construction
2 Metal ore mining 19 Freight transport and warehousing
3 Non-ferrous mineral
mining 20
Post and telecommunications
4 Manufacture of food products and tobacco processing 21
Information transmission, computer services and
software
5 Textiles 22 Wholesale and retail trade
6
Clothing, leather, furs, down and related products, Sawmills
and furniture
23 Accommodation and catering
7
Paper and products, printing and recording medium
production
24 Finance and insurance
8 Petroleum processing, coking
and nuclear fuel processing 25 Real estate
9 Construction materials 26 Rental and business services
10 Machinery and equipment 27 Tourism
11 Transport equipment 28 Scientific research
12 Electric equipment and
machinery 29
General technical services
13
Electronic and telecommunications
equipment
30 Other social services
14 Instruments, meters, cultural
and office machinery 31 Education
15 Other manufacturing products 32
Health services, social security and social
welfare
16 Scrap and waste 33 Culture and arts, sports, entertainment
17
Coal, oil and natural gas, electricity, heat, water production and supply
34
B. Serial number of main standards, codes and technical specification that had been enacted in China until 2007
JGJ26-95 GB50189-2005 GB50176-93 JGJ144-2004 GB50364-2005 GB/T 50378-2006
JGJ134-2001 JGJ129-2000 GB50243-2002 GB50034-2004 GB50365-2005 GB50411-2007 JGJ75-2003 JGJ132-2001 GB50019-2003 JGJ142-2004 GB50366-2005
-0.0147 -0.0126 -0.0105 -0.0084 -0.0063 -0.0042 -0.0021 0 0.0021 0.0042 0.0063 0.0084 0.0105 0.0126 0.0147
0 2 4 6 8 10 12 14 16 18 20 22 24 26 28 30 32 34
C
ha
nge
d de
gr
ee
of
3
4 S
ec
tor
s' T
o
ta
l O
u
tp
ut
k=1 k=2
Fig.3 Changed degreed degrees of 34 sectors’ total outputs for the implementation of BEES in scenario k
ACKNOWLEDGMENT
The authors would like to thank anonymous referees for their careful reviews and constructive comments.
REFERENCES
[1] W. D. Ni (2007, January 25). China's energy status and strategies, [Online]. Available: http://www.stdaily.com/gb/misc/2007-01/30/content_627241.htm [2] Douglas Ogden, translated by W. Yi (2006, February 6). We do not
need more energy, [Online]. Available: http://chanye.finance.sina.com.cn/zy/2006-02-08/276431.shtml
[3] C.Y. Chen, M. M. Zhang, X. Z. Xu, Major economic bills of Promotion of construction energy conservation, News Outlook Weekly, 1-30-2006.
[4] X. L. Liu, S. Y. Wang, C. H. Yang, “Research report on evaluating economic impact of BEES on national economy,” unpublished. [5] F. X. Tu, Q. Y. Wang, “Building energy efficiency - the inevitable
choice of energy efficient strategy (1),” Beijing Prospecting and Design, vol.3, 2005, pp.10-13.
[6] F. X. Tu, Q. Y. Wang, “Building energy efficiency - the inevitable choice of energy efficient strategy (2),” Beijing Prospecting and Design, vol.3, 2005, pp.13-17.
[7] MOHURD (The Ministry of Housing and Urban-Rural Development of the People’s Republic of China) issue, The notice that newly built residential building must be adopted energy efficient design standards strictly, 2005, No.55.
[8] MOHURD (The Ministry of Housing and Urban-Rural Development of the People’s Republic of China) issue, The suggestion to carry out the decision of the State Council on strengthening energy efficient work, 2006, No.231.
[9] J. Loveland, G. Brown (1990) Impacts of climate change on the energy performance of buildings in the United States. OTA/UW/UO, Contract J3-4825.0. U.S. Congress, Office of Technology Assessment, Washington, DC
[10] M. Scott, D. Hadley, L. Wrench, “Effects of climate change on commercial building energy demand,” Energy Sources, vol.16, 1994, pp.339-354.
[11] D. Belzer, M. Scott, R. Sands, “Climate change impacts on U.S. commercial building energy consumption: An analysis using sample survey data,” Energy Sources, vol.18, 1996, pp.177-201.
[12] R. Mendelsohn (ed) (2001) Global warming and the American economy: a regional assessment of climate change impacts, Edward Elgar, Northampton, MA
[13] Y. Jiang, Building energy efficiency, the largest potential energy efficient area, Science Times, 10-24-2007.
[14] F. X. Tu, “Building energy efficiency is a fundamental plan for the national development and people's survival,” Decision-Making, no.1, 2007, pp.4-5.
[15] E. M. Wang, X. J. Liu, “Research on economic problems of energy efficient civil buildings,” Construction Economy, no.12, 2005, pp.77-79.
[16] T. Lin, L. H. Xie and X. P. Liu, “Social economic benefits analysis of
the building and energy-conserving and the counter-measure,”
Construction Economy, no.7, 2005, pp.91-94.
[17] H. L. Sun and X. Y. Fan, “How far away are building energy efficiency from us,” The Group Economic Research, vol.223, 2007, pp.316-317.
[18] Y. B. Kang, “Construction energy efficient measures to achieve The 11th Five-Year-Plan energy efficient target,” China Energy, vol.29, 2007, pp.13-21.
[19] L. Peng, “Simple discussion of economic issues on the construction energy conservation,” Shanxi Construction, vol.33, 2007, pp.233-234.
[20] Y. Wu, “Play the government's public management functions to promote building energy efficient conservation,” Construction, no.12, 2003, pp.12-15.
[21] SCPRC (State Council of the People’s Republic of China) issue, The notice of the State Council to issue comprehensive work plan on energy saving and emission reduction, 2007, No.15.
[22] MOHURD (The Ministry of Housing and Urban-Rural Development of the People’s Republic of China) issue, The notice to issue building energy efficiency inspect report in 2007 National construction field energy saving and emission reduction special supervision and inspect, 2008, No.73.
[23] F. X. Tu, “Building energy efficiency is a fundamental plan for the national development and people's survival,” Decision-Making, no.1, 2007, pp.4-5.
[24] G. C. Sih, “Disproportionate available to dissipated energy density model related to emission of CO2 and evaluation of structural energy efficiency,” Theoretical and Applied Fracture Mechanics, vol.50, 2008, pp.1-8.
[25] Y. C. Gu, “The future way of energy efficiency and land saved residential buildings,” China's Residential Facilities, no.12, 2005, pp.7-18.
[26] W. Wang (2008, March 31) How can buildings be comfort and
energy-efficiency, [Online]. Available:
http://house.people.com.cn/GB/98387/98389/7062260.html
[27] Y. Du (2005, July 18) How much will be the impact of the spread of energy and land saving building on the resident cost? [Online]. Available:
http://news.xinhuanet.com/house/2005-07/18/content_3231934.htm
[28] G. T. Wang, Why put great efforts to develop energy efficiency residence, Economic Daily, 12-15-2004, http://www.ce.cn/new_hgjj/ziliao2/200412/15/t20041215_2629378.s
html
[29] X. K. Chen, China Input-occupation-Output Analysis in Urban and
Rural, Science Press, Beijing, 1992, pp.28-32.
[30] X. L. Xu (2008, April) Policy introduction on heating measure and energy efficiency reconstruction in North of China, [Online]. Aavaible:http://www.chinagb.net/lunwen/nuantongkongtiao/2008041 0/21654.shtml
[31] Z. X. Wang, “Sulphur dioxide's control problems and countermeasures in thermal power plant,” China Power Enterprise