[Non editare]
1
Evaluation of Motorscooter
Frames Structural Integrity by
Drop Test Simulation
F. Frendo, G. Giannoni, E. Rustighi, E. Vitale
Dipartimento di Ingegneria Meccanica, Nucleare e della Produzione
Università degli Studi di Pisa, via Diotisalvi n°2, 56122 Pisa
Abstract
In this work a numerical model for the simulation of motor scooter drop testing was set-up; in this test, the motor scooter is let to fall from a given height, in such a way that the front and rear tires contemporarily impact to the ground. During the test the suspension deflections and the dynamical load acting at ground on the front and rear tires are measured. After the test, the frame’s permanent deformations are gathered, by measuring a series of distances, taken between a series of markers, which are fixed on the scooter frame before starting the test.
distribution and the characteristic curves of the suspensions were accurately reproduced.
The results of the simulation appeared in fairly good agreement with the experimental data, in terms of ground forces and suspension deflections, whereas the frame permanent deformations were found to be overestimated. This difference was attributed to both an incomplete material characterisation and to the absence, in the numerical model, of the external plastic components.
Introduction
In this paper an activity, which was carried out at the Department of Mechanical, Nuclear and Production Engineering (DIMNP) of the University of Pisa for the simulation of motorscooter drop testing, is presented. For this aim the explicit finite element code Ansys/LSDyna was employed. A previous experimental activity was the subject of a research co-operation between DIMNP and PIAGGIO & C.; such activity was focused at developing technical standards for both experimental and numerical tests, with the intent of defining a proper procedure for the evaluation of the structural integrity of motorscooter frames.
The drop test was introduced by the company in place of the elder springboard leap, in order to guarantee the test repeatability and to safeguard the test drivers health. In such a test the vehicle with some added ballast is let to drop from a given height, so that the front and rear tires contemporarily impact at the ground. Different drop height and number of successive tests can be used depending on vehicle typology. After each drop, a series of geometric distances between reference points fixed on the frame is gathered, in order to evaluate the frame permanent deformation.
4 1
2
Air under pressure
[image:3.612.191.437.101.380.2]3
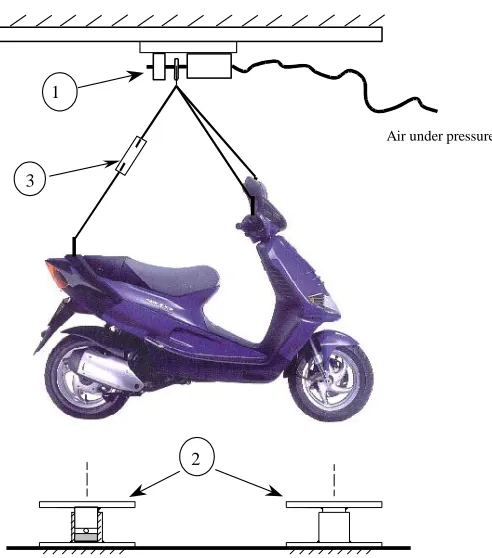
Figure 1. Schematic drawing of the test rig: (1) unfastening system, (2) instrumented impact plates (3) joint to adjust the
vehicle initial position with respect to ground.
Finite element model of the scooter
The numerical model was realized starting from the frame. Shell elements with different thicknesses were used in order to fit properly the different parts of the frame. A material with bilinear constitutive equation and kinematics hardening plasticity was used. The constitutive properties of the frame material were inferred by standard tensile tests.
formulation were used; those elements can only been associated to elastic material.
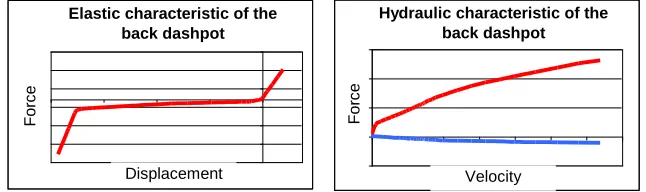
The front suspension was modelled with six beam elements for each stem. Two of these were rigid in order to define a cylindrical joint. As combi elements permit to define spring and damping elements, they were used to absorb the axial forces over the suspension. A non linear elastic behaviour was imposed to the springs and a non linear viscous damping behaviour to the dashpots. The real load curves of suspensions have then set in as material characteristics. Figure 1 shows elastic and damping behaviour of the rear shock absorber. The displacement of a spring could be limited in the code, both in compression and in expansion, in order to define the end stops of suspensions, but some preliminary analyses showed a potential numerical instability. So the beginning and ending parts of the spring load curve were modified increasing progressively the rate, in order to obtain a behaviour similar to the end stops. In such a way the back suspension was modelled too.
A simplified model, that took into account only the first natural frequency, was utilized to model the tires. Parallel beam and combi elements were employed to characterize the stiffness of the tire. Besides the equivalent mass was lumped to the end of the beam element placing there a mass element.
[image:4.612.144.467.376.472.2]Caratteristica elastica ammortizzatore posteriore Spostamento F o rz a Caratteristica idraulica ammortizzatore posteriore Velocità F o rz a
Figure 2 – Elastic and hydraulic curves of the rear dashpot; the third quadrant represent the working part of the curve.
A plate of four shell elements was placed at the lower end of each wheel model, in order to easily define the ground contact. Also for these elements a low density material was used, so that such element couldn’t alter the dynamical characteristics of tires. Moreover, these plates were constrained, by means of the instruction *BOUNDARY_SPC_NODE [3], so to guarantee a proper contact between the tires and the ground.
As the instruction *CONSTRAINED_NODE_SET [3] allows to impose the same displacement components at two or more nodes, it was utilized for all the kinematics pairs, for instance for the constraints of the rear shock absorber, the engine suspension and the wheel hubs. The engine suspension was formed by two connecting rods and a rubber shock absorber. It is noteworthy that the numerical model lacked all the structures added onto the frame; in fact, all the
Elastic characteristic of the back dashpot
Hydraulic characteristic of the back dashpot
F
o
rc
e
Displacement Velocity
For
c
plastics of the vehicle body, all the electrical components and the transmission group haven’t been modelled. Therefore, mass elements were introduced in order to restore the real mass distribution of the vehicle. These elements were placed over the frame and the beam elements of the model to obtain a satisfactory reproduction of the inertial properties of the unsprung mass. Mass elements were also used to reproduce the ballast placed in the front part of the saddle and in the footboard during the experimental tests.
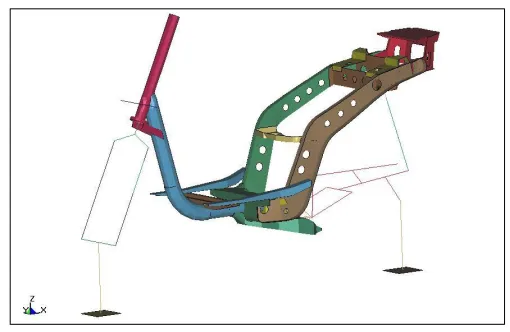
Finally, two bilateral constraints were employed to avoid the lateral drop of the motorscooter after the contact with the ground; one constraint was imposed to a node of the steering bar and the other one to the rigid part of the front tire sub-model. In particular, with this schematisation it was possible to perform several consecutive simulation tests, each time starting from the permanently deformed state of the previous test. Underneath the motorscooter model a rigid infinite plane (*RIGIDWALL [3]) was placed in order to represent the ground. Figure 2 shows a picture of the numerical model.
[image:5.612.178.433.421.587.2]On the whole, the model includes 5899 nodes, 222 beam elements (beam161, Belytschko-Schwer formulation), 133 lumped mass elements (mass166), 16 spring and dashpot elements (combi165) and 5519 shell elements (shell163, Belytschko-Tsay formulation). Moreover, 14 constraints were utilized to schematize the kinetics pairs, 2 cylindrical joint to represent the front suspensions (*CONSTRAINED [3]), 2 constraints to keep the model in the vertical position after each drop (*BOUNDARY [3]) and 10 load curves to characterize springs and dashpots.
Figure 3 – Fully numerical model of the motor-scooter.
Simulation tests
successively, a second impact that ends after some oscillations can be observed till the static load over each tire is reached (Fig.3 and 4).
Looking at the loads time histories, it seems reasonable to infer that the damages to the frame occur only in the first impact. For this reason only one complete simulation was carried out in order to verify the accuracy of the simulation test. Then the simulated drop tests were carried out just for the time necessary to go beyond the first peak load and the full extension of the two suspensions. Then a relaxation analysis was carried out applying a global damping to all the nodes of the model, in order to arrest the simulation and avoid the free oscillations of the elastic parts. In such a way a reduction of about a third of the time necessary for the complete simulation was obtained for each drop. Moreover, in order to save calculation time, each drop was started at a very small height and an initial velocity of the same value of the impact velocity (calculated on the basis of mechanical energy conservation) was imposed to all nodes perpendicularly to the ground. Carichi anteriori 0 100 200 300 400 500 600 700 800
1.3 1.4 1.5 1.6 1.7 1.8 1.9 2 2.1 2.2 2.3 2.4 2.5
[image:6.612.155.458.314.490.2]tempo (sec) fo rza (d a N ) Ant. sper. Ant. num.
Carichi posteriori
0 100 200 300 400 500 600 700 800 900
1.3 1.4 1.5 1.6 1.7 1.8 1.9 2 2.1 2.2 2.3 2.4 2.5
tempo (sec)
fo
rz
a
(
d
a
N
)
[image:7.612.155.456.109.288.2]Post. sper. Post. num.
Figure 5 – Experimental and numerical ground load over the back wheel.
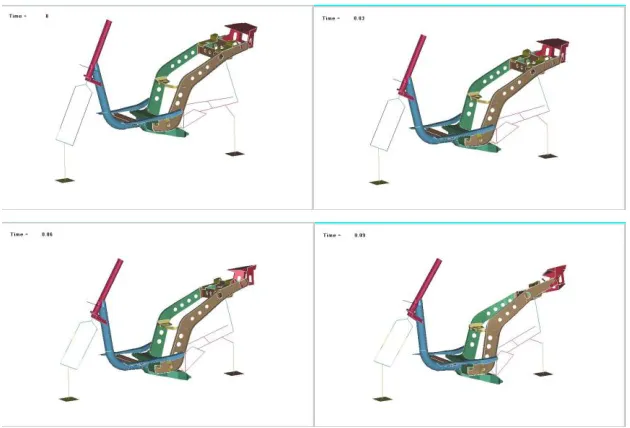
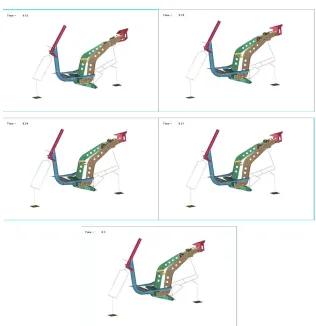
Figure 6 shows a sequence of pictures saved during the first fall. The combined bending and torsional deformation of the rear part of the frame can easily be observed. Such a deformation is due just to the presence of a single rear shock-absorber.
Rear loads
Time (sec)
For
c
e
(
d
a
N
)
[image:7.612.149.464.387.601.2]Figure 6 - Subsequent images recorded at different simulation time, during the first drop simulation.
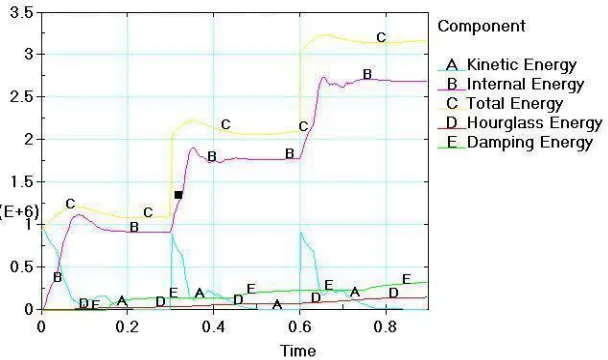
Figure 7 – Energy values during three successive simulations.
Most of this energy is then absorbed by elastic and plastic deformations of the structural material and by the suspension damping. The remaining part goes into hourglassing energy, with ratio less than 10% of internal energy and into structural damping energy. It can be observed in figure 7 that the structural damping energy increase in the time intervals 0.15-0.3, 0.45-0.6 and 0.75-0.9, in which relaxation following each drop occurs and high structural damping is used to stop the oscillation of the model. Accordingly, in the same intervals the kinetic energy goes to zero.
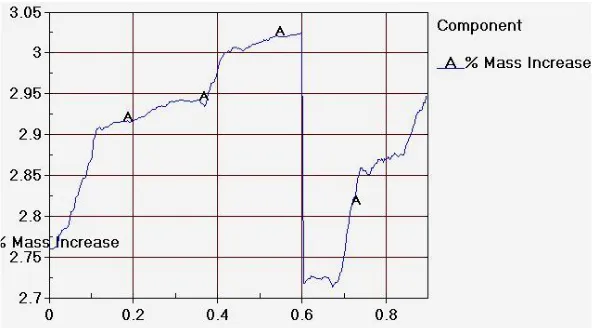
Figure 8 – Percentage of added mass during simulations.
Using a 1,4 GHz CPU, the simulation of about one second required about 16 hours (the code maks a relatively small use of RAM memory, and processing time mainly depends on processor speed). With the previously explained simulation procedure each drop required about 5 hours and 15 minutes.
Analysis of results
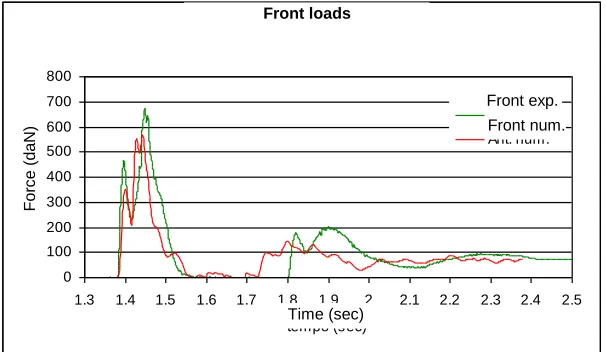
Results of the numerical analysis appeared in reasonable good agreement with the experimental values, as belong to impact forces at the ground (see Fig. 4 and 5) and suspensions deflections. In those figures, it can be observed that, the first impact of both tires with the ground includes two load peaks, connected by one oscillation. Such behavior can easily be interpreted by the dynamic response of a two degrees of freedom system (i.e. sprung and unsprung mass, respectively connected with each other and with the ground by the suspension and the tire). In more details, the first peak corresponds to the initial phase of contact in which both the tires and mainly the suspensions are deformed. Successively, there is an intermediate phase in which, while the suspensions continue compressing, the tires extend, thus permanently reducing the force to the ground. Finally, when the suspensions reach the limit stroke, there is a new and severe compression of the tires, leading to the second and more intense load peaks.
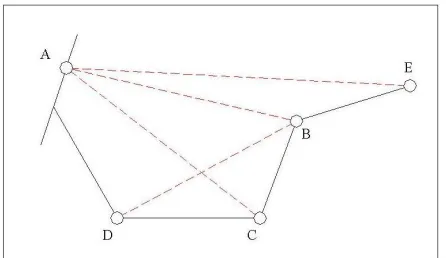
At the end of each drop, a series of distances were gathered on the basis of reference markers positioned on the frame as shown in Fig. 9, in order to evaluate the frame permanent deformation.
Figure 8 – Reference markers for frame’s deformation evaluation.
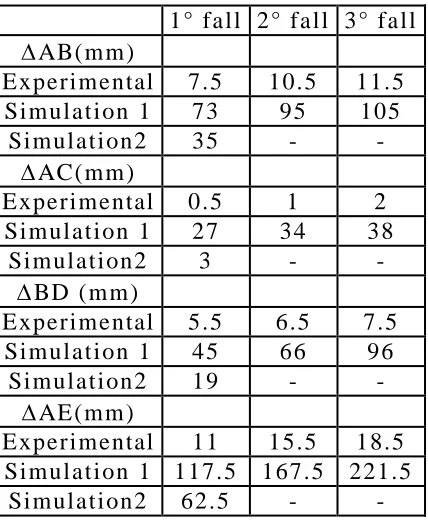
The permanent deformation, obtained as variation of the distances indicated in of Fig.8, are reported in table 1 for three successive drops, founded experimentally and obtained from numerical simulation. The table reports the results for two series of simulation. The first (simulation 1) has been effected using, for steel, the characteristics obtained from a standard traction test; examining the results, it’s possible to observe that deformation obtained from this simulation are very overvalued as for experimental deformations. This has been attributed to two main causes: the first, to have not schematised plastic bodies of motorscooter, so have not considered the energy that this bodies absorb; the second, to have used for steel of the frame, the characteristics obtained from a standard traction test, leaving out for a possible dependence of properties (yield stress, Young’s modulus and tangent modulus) from speed deformation. To schematise the real effect of plastic bodies is very difficult, because they present several contact zones and a series of link to frame.
Table 1 – Variation of distance from reference marker fixed on the frame.
Conclusions
In this work a procedure for the drop testing simulation was described. A numerical model with finite elements has been set-up in the code Ansys/LSDyna; inertial properties of the vehicle and elastic and damping properties of the suspension have been determined experimentally.
The results of simulations are good of agree with experimental results, for the state of force to the ground and suspension closing. Yet, permanent deformations of the frame obtained with numerical simulation are very overvalued respects to experimental values. This difference was given to not have schematised plastic structure effects and to have used, for the frame, mechanical properties determinate in an almost-static traction test, leaving out for a possible effect on the results of deformation speed. The sensibility of the results for material properties was discussed for a simulation with increasing of 50% yield stress, respects to value obtained with standard traction test.
1° fall 2° fall 3° fall
AB(mm)
Experimental
7.5
10.5
11.5
Simulation 1
73
95
105
Simulation2
35
-
-
AC(mm)
Experimental
0.5
1
2
Simulation 1
27
34
38
Simulation2
3
-
-
BD (mm)
Experimental
5.5
6.5
7.5
Simulation 1
45
66
96
Simulation2
19
-
-
AE(mm)
Experimental
11
15.5
18.5
Simulation 1 117.5 167.5 221.5
Bibliography
[1] F. Frendo, E. Vitale, R. Hippoliti, P. Casalini, "Analisi sperimentale e simulazione di "drop test" su motorscooter", XXIX Convegno Nazionale AIAS, Lucca 6-9 Settembre 2000, pp.37-46.
[2] F. Frendo, E. Vitale, R. Hippoliti, P. Casalini, "Simulation of motorscooter drop testing", ISATA 2000, Dublin, Ireland, 25-27 september 2000, pp.119-126