869
MS
Multiple Sclerosis: Comparison of Trace Apparent
Diffusion Coefficients with MR Enhancement
Pattern of Lesions
Sudipta Roychowdhury, Joseph A. Maldjian, and Robert I. Grossman
BACKGROUND AND PURPOSE: Diffusion-weighted MR imaging and the trace apparent
diffusion coefficient (ADC) provide important structural information about tissues. The pur-pose of this study was to investigate the relationship between trace ADC values and the en-hancement pattern of multiple sclerosis (MS) lesions.
METHODS: Ninety-six lesions, identified in 24 patients with MS, were characterized by their
enhancement pattern on contrast-enhanced T1-weighted MR images. There were 57 nonen-hancing lesions (NELs), 28 homogeneously ennonen-hancing lesions (HELs), and 11 ring-ennonen-hancing lesions (RELs). The trace ADC means for each type of lesion and for normal-appearing white matter (NAWM) were calculated and compared using Student’s t-test.
RESULTS: The mean trace ADC values for HELs (mean, 7.7 3 10210 m2s21; SD, 1.4 3 10210m2s21) were less than those for RELs (mean, 1.23 1029m2s21; SD, 3.5310210m2s21) and NELs (mean, 1.331029m2s21; SD, 2.6310210m2s21). There was a significant difference between the mean trace ADC values of HELs and RELs as well as between those for HELs and NELs. There was also a significant difference in the mean trace ADC values between all lesion types and NAWM (mean, 6.93 10210 m2s21; SD, 5.03 10211m2s21).
CONCLUSION: We found a predictable relationship between mean trace ADC and the
pat-tern of enhancement in MS lesions, corresponding to reported histopathologic differences in myelination between lesion types and magnetization transfer ratios.
The histopathologic characteristics of multiple scle-rosis (MS) lesions differ according to the pattern of enhancement on MR images (1, 2). Nonenhanc-ing lesions (NELs) histologically have scarrNonenhanc-ing with minimal inflammation and variable myelin loss, ranging from mild to severe. Homogeneously enhancing lesions (HELs) have prominent inflam-mation but only mild demyelination. Ring-enhanc-ing lesions (RELs) have complete central myelin loss with peripheral inflammation. The magnetiza-tion transfer ratios (MTRs) have been studied for the enhancement pattern of MS lesions (3). HELs had a higher mean MTR than did NELs and RELs. This is probably related to the greater degree of
Received July 30, 1999; accepted after revision December 6. From the Department of Radiology, Hospital of the Univer-sity of Pennsylvania, Philadelphia (S.R., J.A.M., R.I.G.); and the Department of Radiology, University of Medicine and Dentistry of New Jersey, New Brunswick (S.R.).
Supported by grants NS29029, NS29020-09, and 5M01-RR00040-34 from the National Institutes of Health.
Address reprint requests to Joseph A. Maldjian, MD, De-partment of Radiology, Neuroradiology Section, Hospital of the University of Pennsylvania, Ground Floor Founders Build-ing, 3400 Spruce St, Philadelphia, PA 19104.
qAmerican Society of Neuroradiology
myelin preservation in HELs as compared with RELs or NELs. Hypointense lesions on T1-weight-ed spin-echo MR images, which can be seen in NELs as well as RELs, are associated with severe tissue destruction (4).
Diffusion-weighted MR imaging is an important tool in the evaluation of the random molecular mo-tion of water protons (5–7), and there has been great interest in the use of this technique for the study of stroke (6, 8–12). The trace apparent dif-fusion coefficient (ADC) provides a rotationally in-variant measurement of the total diffusion of water within a tissue (7–12). Diffusion-weighted MR im-aging offers an opportunity to evaluate the struc-tural characteristics of tissues. White matter is com-posed of highly organized myelinated axons that create an anisotropic restriction of water diffusion (10, 13–17). Therefore, any process that results in changes in the structural elements of tissue may also affect its diffusion characteristics.
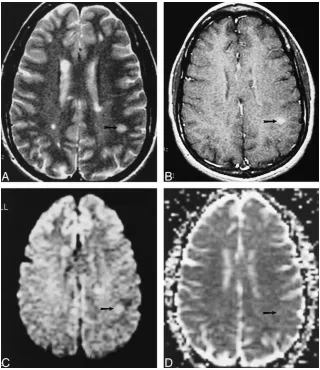
FIG1. Examples of an NEL and an REL in a patient with MS.
A–D, Axial T2-weighted image (4000/ 110/1) (A), contrast-enhanced T1-weight-ed image (500/20/1) (B), isotropic diffu-sion-weighted image (4000/125/1) (C), and trace ADC map (D) show a T1-weighted NEL (arrow) and a T1-weighted REL (ar-rowhead). Both lesions show increased diffusion on the trace ADC map.
in ADC is not known, it is believed to be related to the disruption of myelin, leading to an increased extracellular space (18–21).
In this study, we compared the trace ADC mea-surements of NELs, HELs, RELs, and NAWM in MS patients to determine whether there is a pattern that corresponds to the MR findings and that ac-counts for what is known about the histopathologic characteristics and MTRs of the different lesion types.
Methods
During a period of 2 years (1997–1999), we identified 24 patients with MS in whom enhancing lesions were found on MR images. Most of the patients were in an MS cohort entered in a National Institutes of Health study consisting of serial MR examinations. In all patients, MS was diagnosed by means of the Poser criteria (24). The study group comprised 17 women and seven men with a mean age of 41 years. All lesion char-acterization and analyses were performed by one neuroradiol-ogist who was not blinded to patient data or imaging findings. Lesions analyzed were at least 5 mm in diameter and were detected on long-TR/long-TE sequences. Lesions were said to be enhanced if they were significantly hyperintense relative to white matter on T1-weighted images after intravenous admin-istration of gadopentetate dimeglumine (0.1 mmol/kg, up to maximum of 20 mL). RELs were differentiated from HELs by virtue of having a central nonenhancing region and a peripheral
enhancing rim. Fifty-seven NELs (Fig 1), 28 HELs (Fig 2), and 11 RELs (Fig 1) were evaluated.
MR examinations were performed on a 1.5-T clinical imager equipped with an Echospeed gradient system for echo-planar imaging. Sagittal T1-weighted images were obtained with the following parameters: 500–700/17–30/1 (TR/TE/excitations), 5-mm-thick sections, 2563192 matrix, and a 22-cm field of view (FOV). For axial fast spin-echo (FSE) T2-weighted im-ages, the parameters were as follows: 2500–4000/80–110/1, 5-mm-thick sections, 2563192 matrix, and 22-cm FOV. Ax-ial contrast-enhanced T1-weighted images were acquired with the following parameters: 500–700/20–40/1, 3- or 5-mm-thick sections, 256 3 192 matrix, and 22-cm FOV. Diffusion-weighted imaging was performed prior to contrast administra-tion in all cases and used a spin-echo echo-planar sequence with parameters as follows: 4000/125, 128 3 128 matrix, 24-cm FOV, and b value of 1000 s/mm2. The diffusion
gra-dients were applied sequentially in three orthogonal directions to generate three sets of axial diffusion-weighted images (Sx,
Sy, and Sz) in addition to a baseline image (S0), with no
dif-fusion gradients. The difdif-fusion-weighted images were trans-ferred to a workstation for off-line processing using software developed in IDL (Research Systems Inc, Boulder, CO). Iso-tropic diffusion-weighted images were calculated using the re-lationship
S5cube root (S *S *S ).x y z
FIG 2. Example of an HEL in a patient with MS.
A–D, Axial T2-weighted image (4000/ 110/1) (A), contrast-enhanced T1-weight-ed image (500/20/1) (B), isotropic diffu-sion-weighted image (4000/125/1) (C), and trace ADC map (D) show a T1-weighted HEL (arrow), which shows increased dif-fusion on the trace ADC map.
2(bD)
S5S e0
in which S is the isotropic diffusion-weighted signal, S0is the
baseline signal intensity without diffusion gradients, D is the average trace, and b is the gradient attenuation factor. The trace ADC is a rotationally invariant measurement of the amount of total diffusion within a tissue (7, 12, 13, 16, 25, 26).
Regions of interest (ROIs) were drawn directly on the base-line S0images of the diffusion MR sequence. These were de-termined from careful visual comparison between the T2-weighted, contrast-enhanced T1-T2-weighted, and S0 baseline
images. All enhancing lesions were easily identified on the FSE weighted images, and all lesions seen on the FSE T2-weighted sequences were easily identified on the correspond-ing baseline image. The ROIs placed on the baseline image were applied to the trace maps to obtain the corresponding trace ADC values. Trace ADC measurements were recorded with the ROI placed around the entire lesion in the case of NELs and HELs. For RELs, the ROI was placed within the nonenhancing center of the lesion. The mean of three trace ADC measurements was recorded for each lesion. In every patient, the trace ADC was obtained in the NAWM in two bilateral areas for a total of four measurements. These values were compared with the normal white matter (NWM) ADC values, which we have compiled for healthy volunteers at our institution.
Statistical significance was calculated for the trace ADC of each type of lesion and for NAWM using a two-tailed Stu-dent’s t-test. The mean trace ADC for each lesion type (NEL, HEL, and REL) was compared with the other lesions and with the mean trace ADC of NAWM in the 24 patients. The mean
trace ADC of NAWM was compared with that of NWM in five healthy volunteers.
Results
The mean trace ADC measurements and SDs for NELs, HELs, RELs, and NAWM are shown in the Table. All three types of MS lesions had higher mean trace ADCs than did NAWM. There was a significant difference between the mean trace ADCs of each lesion type compared with NAWM: NELs and NAWM (P,.0001), HELs and NAWM (P , .01), and RELs and NAWM (P , .0001). There was also a significant difference between the mean trace ADCs of HELs and RELs (P,.01) as well as between HELs and NELs (P , .0001). There was no significant difference between the mean trace ADCs of NELs and RELs (P 5 .63). The trace ADC measurements for NWM in a group of five healthy patients (mean, 6.73 10210 m2s21; SD, 9.2310211 m2s21) did not significantly differ from those of NAWM (mean, 6.9 3 10210 m2s21; SD, 5.4 3 10211 m2s21) in the 24 MS patients (P
5 .18).
[image:3.612.59.379.57.427.2]Summary of trace apparent diffusion coefficient (ADC) measurements
Lesion Type No.
Mean Trace ADC (10210m2s21)
SD (%)
Maximum (10210m2s21)
Minimum (10210m2s21)
Nonenhancing
Homogeneously enhancing Ring-enhancing
Normal-appearing white matter
57 28 11 96
12.5 7.7 11.9 6.9
21 19 30 8
20.0 9.9 21.4 8.5
6.5 4.1 9.0 5.8
7.5 3 10210 m2s21) became an NEL (trace ADC, 9.7 310210 m2s21) after a 9-month follow-up pe-riod. In another patient, an REL (trace ADC, 2.1
31029m2s21) became an NEL (trace ADC, 1.83 1029 m2s21) over a period of 11 months.
Discussion
The initial event in the development of an MS lesion may be the disruption of the blood-brain bar-rier (BBB), which is associated with a prominent inflammatory process (1, 29, 30). Antigen-specific T cells enter the CNS and begin a cytokine cascade, which activates endothelial cells and mediates the opening of the BBB (1). The process continues with the recruitment of additional cells with amplification of the inflammatory response (1, 27, 28). Contrast enhancement on MR images reflects this transient disruption of the BBB with extravasation of contrast material into the brain parenchyma, representing a measure of lesion activity (1, 29, 30). Enhancement is reported to occur in almost all new lesions as shown by serial MR imaging of patients with re-lapsing-remitting and secondary-progressive MS and lasts about 4 to 6 weeks in most cases (31–33). Pathologic examination of MS lesions has shown a correlation between the histologic characteristics of lesions and the type of MR contrast enhance-ment (1, 2). HELs have perivascular inflammation with some myelin loss. NELs have scarring from fibrous astroglial response with minimal inflam-mation and almost complete myelin loss. RELs, which have an enhancing rim and a nonenhancing center, have peripheral inflammation and complete central demyelination. MS lesions, which are hy-pointense on T1-weighted images, are associated with severe tissue destruction and axonal loss (4).
Petrella et al (3) evaluated the MTRs of HELs, RELs, and NELs in MS. The MTRs for HELs (mean, 32.2%; SD, 3.4%) were higher than those for NELs (mean, 29.4%; SD, 4.3%) and RELs (mean, 24.5%; SD, 4.0%). A relationship was found between the MTR and the enhancement pat-tern in which there was pathologic evidence of de-creased myelin. HELs, which had the highest MTR, represent lesions with active inflammation and breakdown of the BBB with a greater degree of myelin preservation. In contrast, NELs and the cen-tral portion of RELs, which have lower MTRs, have a greater degree of myelin loss. It was im-portant to evaluate the central nonenhancing por-tion of the REL, as it has been shown that
demy-elination probably occurs centrifugally, with the center of the lesion being the most demyelinated (34). This observation is supported by the fact that the MTR increases from the center to the periphery in an REL (35).
Petrella et al (3) speculated that there may be a pattern of evolution in the enhancement in MS le-sions depending on the degree of inflammation and demyelination. An HEL, which is probably an early active inflammatory lesion, may evolve into an REL or NEL. An REL may become an NEL as the peripheral enhancing portion of the REL deacti-vates. An NEL may become reactivated into an REL but typically not into an HEL, since the center of the lesion is probably the most demyelinated and devascularized. If the NEL becomes completely de-myelinated, it may remain burned out and not re-turn to an enhancing pattern.
Diffusion-weighted MR imaging enables evalu-ation of the random motion of water on a molecular level (5–7). The ADC is a rotationally invariant measurement of the amount of total diffusion with-in a tissue (7, 12, 13, 16, 25, 26). Trace ADC re-flects the structural properties of the cellular com-partments of the tissue studied (7). The in vivo cellular environment contains cell membranes that form a restrictive barrier to water diffusion. Model systems have been studied that suggest that the ax-onal cell membrane is sufficient to account for most of the restriction of water diffusion in white matter (8, 36, 37). Diffusion is much more restricted per-pendicular to the axis of the axon, where there may be interactions with the myelin sheath, than in a direction parallel to the axon (10, 13–17). The ADC of white matter for the different directions reflects this restrictive property of the tissue. It is not surprising that any process that disrupts the my-elination of axons in white matter would also change the diffusion characteristics of water in this tissue.
1029 m2s21) were significantly higher (P , .01) than those for NAWM (mean, 0.7731029m2s21). Two acute MS lesions, which were approximately 14 days old, also had elevated ADC (mean, 1.99
3 1029 m2s21). The ADC of NAWM in MS pa-tients was significantly higher than the ADC of NWM in healthy volunteers (21). Heide et al (38) reported increased ADC in lesions detected in ex-perimental allergic encephalomyelitis, which is an animal model of MS. Horsfield et al (18) found that trace ADC was increased in all MS lesions and that ADC was elevated in NAWM in patients with a benign disease course. There was no relationship between ADC and extent of disability in MS pa-tients (18). It has been hypothesized that the ele-vation in ADC in an MS lesion is related to an increase in the extracellular space within the white matter stemming from the disruption of the axons caused by the demyelinating process and edema (18–21). The cellular environment of the axons probably becomes less restrictive as demyelination evolves. This hypothesis is supported by the sig-nificant reduction in anisotropy seen in chronic MS lesions and in the core of acute MS lesions (23). Gass et al (22) reported decreased ADC at the bor-der of some acute plaques, which they attributed to hypercellularity or cytotoxic edema. This report contains some of the first evidence that there may actually be decreases in ADC associated with an MS lesion. In addition, enhancing lesions were hy-perintense relative to white matter on diffusion-weighted images while chronic lesions were isoin-tense (22). It is known that both diffusion and T2 relaxation (T2 shine-through) contribute to the sig-nal on diffusion-weighted images. Gass et al (22) hypothesized that the increased intensity in en-hancing lesions on diffusion-weighted images re-sults from T2 relaxation that is not matched by an increase in the diffusion coefficient. The latter would tend to reduce the signal on diffusion-weighted images.
The data from our study reveal differences in trace ADC measurements in HELs, RELs, NELs, and NAWM. All MS lesions (NELs, HELs, and RELs) have significantly higher mean trace ADCs relative to NAWM. The mean trace ADC of HELs is significantly less than that of NELs and RELs. There is no significant difference between the mean trace ADC of RELs and NELs. Previously pub-lished data (3) have shown significantly increased MTRs in HELs as compared with RELs, and there was a trend toward increased MTR in HELs rela-tive to NELs. These data support the contention that HELs, which have decreased trace ADC and increased MTR in relation to RELs and NELs, have less parenchymal destruction and less demyelina-tion than do RELs and NELs, as demonstrated in histopathologic studies (1, 2). Although there was a significant difference in the MTR of NELs and RELs, there was no significant difference in the trace ADC between NELs and RELs. This may be due to the fact that the SD in trace ADC and MTR
(3) is higher in RELs and NELs than in HELs, which may reflect the wider variability in tissue heterogeneity associated with RELs and NELs.
The temporal evolution of enhancement in MS lesions was seen in two patients. A HEL became a NEL over a period of 9 months. The trace ADC increased from 7.5 3 10210 m2s21 to 9.7 3 10210m2s21, probably reflecting the subsequent in-crease in extracellular space with increasing de-myelination and decreasing inflammation. A REL became a NEL over a period of 11 months, with trace ADC changing from 2.131029 m2s21in the center of the REL to 1.831029m2s21in the NEL. These two examples support the dynamic evolution of enhancement in MS lesions, as reported by Pe-trella et al (3).
Although the mean trace ADC of HELs is sig-nificantly higher than that of NAWM, four of 28 HELs had trace ADC values that were 2 SD below the mean for NAWM. None of the RELs or NELs had trace ADC values below 2 SD of the mean of the NAWM. This subset of HELs with a low trace ADC may provide insight into the cellular archi-tecture of these lesions. We postulate that the de-crease in ADC of these HELs may be similar to the process in acute ischemia (8, 11) and postan-oxic demyelination (39). There may be shifts in intracellular water protons and changes in mem-brane permeability that lead to decreased ADC. HELs represent active lesions with a predominant inflammatory component (1, 27, 28). The influx of inflammatory cells and associated macromolecules may also lead to restriction of water diffusion and reduction in trace ADC. Perhaps the subset of HELs with a low trace ADC represents the very early enhancing lesion with marked inflammation and no significant demyelination; however, since it is currently not possible to accurately date MS le-sions, we cannot classify HELs as either early or late.
It has been suggested that acute MS lesions may have higher ADC values than chronic lesions (18, 20, 21). Larsson et al (20) found that acute lesions less than 3 months old (by review of serial exam-inations) had higher diffusion coefficient ratios than did chronic lesions. Christiansen et al (21) de-scribed two acute plaques that were approximately 14 days old with higher ADCs than chronic lesions, which were more than 4 months old. It is difficult to directly compare these findings with our study, as we made no attempt to ascertain the age of the MS lesions, and the other studies did not charac-terize the enhancement patterns of the MS lesions. Currently, the trace ADC of a hyperacute MS le-sion (less than 24 hours old) is still unknown.
the statistical noise. The ROIs were selected on the baseline images to eliminate any misregistration er-rors between the anatomic images and the diffu-sion-weighted images. Image distortions between the diffusion directional images, however, may have contributed to some partial volume sampling errors within ADC measurements.
Conclusion
A relationship exists between the trace ADC and the pattern of enhancement in MS lesions. There are significant increases in trace ADC in NELs and RELs, in which there is histopathologic evidence of increased myelin loss relative to HELs, which are predominantly inflammatory with more myelin preservation. Diffusion-weighted MR imaging findings and trace ADC measurements offer anoth-er panoth-erspective on the pathologic hetanoth-erogeneity of MS lesions.
References
1. Katz D, Taubenberger J, Cannella B, McFarlin D, Raine C, McFarland H. Correlation between magnetic resonance
imag-ing findimag-ings and lesion development in chronic, active multiple sclerosis. Ann Neurol 1993;34:661–669
2. Nesbit G, Forbes G, Scheithauer B, Okazaki H, Rodriguez M.
Multiple sclerosis: histopathological and MR and/or CT cor-relation in 37 cases at biopsy and three cases at autopsy.
Ra-diology 1991;180:467–474
3. Petrella J, Grossman R, McGowan J, Campbell G, Cohen J.
Mul-tiple sclerosis lesions: relationship between MR enhancement pattern and magnetization transfer effect. AJNR Am J
Neuro-radiol 1996;17:1041–1049
4. vanWalderveen M, Kamphorst W, Scheltens P, et al.
Histopath-ologic correlate of hypointense lesions on T1-weighted spin-echo MRI in multiple sclerosis. Neurology 1998;50:1282–1288
5. Stejskal E, Tanner J. Spin diffusion measurements: spin echoes
in the presence of a time-dependent field gradient. J Chem Phys
1965;42:288–292
6. LeBihan D, Breton E, Aubin M. MR imaging of intravoxel
in-coherent motions: application to diffusion and perfusion in neurologic disorders. Radiology 1986;161:401–407
7. LeBihan D. Separation of diffusion and perfusion in intravoxel
incoherent motion (IVIM) MR imaging. Radiology 1988;168:
497–505
8. Moseley M, Kucharczyk J. Diffusion in brain ischemia. In: LeBihan D, ed. Diffusion and Perfusion Magnetic Resonance
Im-aging. New York: Raven;1995:159–167
9. Moseley M, deCrespigny A, Roberts T, Kozniewska E, Kuchara-zyk J. Early detection of regional cerebral ischemia using
high-speed MRI. Stroke 1993;24:160–165
10. Moseley M, Kucharczyk J, Mintorovitch J, et al.
Diffusion-weighted MR imaging of acute stroke: correlation with T2-weighted and magnetic susceptibility-enhanced MR imaging in cats. AJNR Am J Neuroradiol 1990;11:423–432
11. Moseley M, Cohen Y, Mintorovitch J, et al. Early detection of
regional cerebral ischemia in cats: comparison of diffusion and T2-weighted MRI and spectroscopy. Magn Reson Med 1990;14:
330–346
12. Warach S, Chien D, Li W, Ronthal M, Edelman R. Fast magnetic
resonance diffusion-weighted imaging of acute human stroke.
Neurology 1992;42:1717–1723
13. Basser P, Pierpaoli C. Microstructural and physiological
fea-tures of tissues elucidated by quantitative-diffusion-tensor MRI. J Magn Reson B 1996;111:209–210
14. Conturo T, McKinstry R, Aronovitz J, Neil J. Diffusion MRI:
precision, accuracy and flow effects. NMR Biomed 1995;8:
307–332
15. LeBihan D. Molecular diffusion, tissue microdynamics and
mi-crostructure. NMR Biomed 1995;8:375–386
16. Pierpaoli C, Jezzard P, Basser P, Barnett A, Dichiro G. Diffusion
tensor imaging of the human brain. Radiology 1996;201:
637–648
17. vanGelderen P, deVleeschouwer M, DesPres D, Pekar J, vanZijl P, Moonen C. Water diffusion and acute stroke. Magn Reson
Med 1994;31:154–163
18. Horsfield M, Lai M, Webb S, et al. Apparent diffusion
coeffi-cients in benign and secondary progressive multiple sclerosis by nuclear magnetic resonance. Magn Reson Med 1996;36:
393–400
19. Horsfield M, Larsson H, Jones D, Gass A. Diffusion magnetic
resonance imaging in multiple sclerosis. J Neurol Neurosurg
Psychiatry 1998;64(Suppl 1):S80–S84
20. Larsson H, Thomsen C, Frederiksen J, Stubgaard M, Henriksen O. In vivo magnetic resonance diffusion measurement in the
brain of patients with multiple sclerosis. Magn Reson Imaging
1992;10:7–12
21. Christiansen P, Gideon P, Thomsen C, Stubgaard M, Henriksen O, Larsson H. Increased water self-diffusion in chronic plaques
and in apparently normal white matter in patients with mul-tiple sclerosis. Acta Neurol Scand 1993;1993:195–199
22. Gass A, Gaa J, Schreiber W, et al. Echo planar diffusion
weight-ed magnetic resonance imaging in patients with active multiple sclerosis. In: Book of Abstracts: International Society of Magnetic
Resonance in Medicine, Vancouver, Canada, 1997. International
Society of Magnetic Resonance in Medicine; 1997:658 23. Tievsky A, Ptak T, Wu O, et al. Evaluation of MS lesions with
full tensor diffusion-weighted imaging and anisotropy map-ping. In: Book of Abstracts: International Society of Magnetic
Resonance in Medicine, Vancouver, Canada, 1997. International
Society of Magnetic Resonance in Medicine; 1997:666 24. Poser C, Paty D, Scheinberg L. New diagnostic criteria for
mul-tiple sclerosis: guidelines for research protocols. Ann Neurol
1983;13:227–231
25. Basser P, Pierpaoli C. A simplified method to measure the
dif-fusion tensor form seven MR images. Magn Reson Med 1998;
39:928–934
26. Rowley H, Grant P, Roberts T. Diffusion MR imaging.
Neuroim-aging Clin North Am 1999;9:343–361
27. McFarland H. The lesion in multiple sclerosis: clinical,
patho-logical, and magnetic resonance imaging considerations. J
Neu-rol Neurosurg Psychiatry 1998;64(Suppl 1):S26–S30
28. McDonald W. Rachelle Fishman-Matthew Moore lecture: the
pathological and clinical dynamics of multiple sclerosis. J
Neu-ropathol Exp Neurol 1994;53:338–343
29. Grossman R, Gonzalez-Scarano F, Atlas S, Galetta S, Silberberg D. Multiple sclerosis: gadolinium enhancement in MR
imag-ing. Radiology 1986;161:721–725
30. McDonald W. The dynamics of multiple sclerosis. J Neurol 1993;240:28–36
31. Miller D, Albert P, Barkof F, et al. Guidelines for the use of
magnetic resonance techniques in monitoring the treatment of multiple sclerosis. Ann Neurol 1996;39:6–16
32. Thompson A, Kermode A, Wicks D, et al. Major differences in
the dynamics of primary and progressive multiple sclerosis.
Ann Neurol 1991;29:53–62
33. Thompson A, Miller D, Youl B, et al. Serial gadolinium
en-hanced MRI in relapsing/remitting multiple sclerosis of vary-ing disease duration. Neurology 1992;42:60–63
34. Dousset V, Grossman R, Ramer K, et al. Experimental allergic
encephalomyelitis and multiple sclerosis: lesion characteriza-tion with magnetizacharacteriza-tion transfer imaging. Radiology 1992;182:
483–491
35. Hiehle J, Grossman R, Kramer K, Gonzalez-Scarano F, Cohen J.
Magnetization transfer effects in MR-detected multiple scle-rosis lesions: comparison of gadolinium-enhanced spin-echo images and non-enhanced T1-weighted images. AJNR Am J
Neuroradiol 1995;16:69–77
36. Beaulieu C, Allen P. Water diffusion in the giant axon of the
squid: implications for diffusion-weighted MRI of the nervous system. Magn Reson Med 1994;32:579–583
37. Beaulieu C, Allen P. Determinants of anisotropic water
diffu-sion in nerves. Magn Reson Med 1994;31:394–400
38. Heide A, Richards T, Alvord E, Peterson J, Rose L. Diffusion
imaging of experimental allergic encephalomyelitis. Magn
Re-son Med 1993;29:478–484
39. Roychowdhury S, Maldjian J, Galetta S, Grossman R. Postanoxic
encephalopathy: diffusion MR findings. J Comput Assist