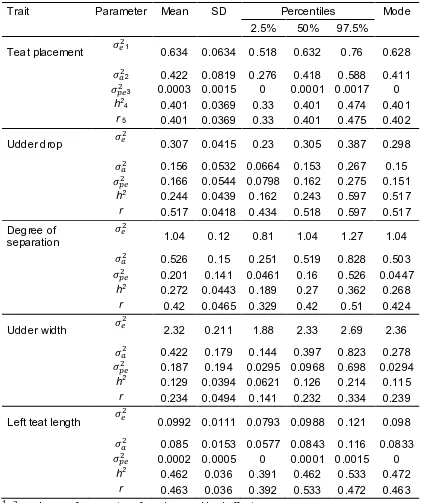
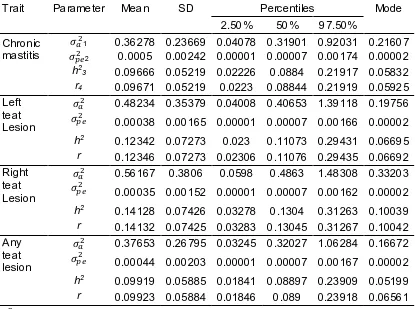
Heritability of phenotypic udder traits to improve resilience to mastitis in Texel ewes
Full text
Figure
Related documents
The reason is that at low nitrogen level, nutrients were available for fruit development in plots where minimum height was maintained so number of opened bolls,
The significant difference between the Bitline PUF and prior SRAM-based PUFs is that the Bitline PUF generates responses based on mismatch across the cells within a column, instead
The temperature sensitive thermoreversible in situ gel formulation was evaluated for inflection point, gelation temperature, pH, viscosity, % drug content, gel strength,
A very high fraction of students with very low grade in middle school still go to the general high school, if the father has a high level of education: if fathers have a
We note, however, that the expressions linking changes in the skill premium to changes in domestic expenditure shares di¤er from those in the Ricardian model developed in the paper,
Including fiscal procyclicality statistics derived from government expenditure incorporating investment into the regression specifications from Section III provides similar
De…nition 3 Given constant values for the world interest rate and price level, an upper bound on the long-run value of debt, a policy mix, de…ned by a surplus rule from equation
North Carolina Testing Program EOC Civics and Economics Sample Items.. Page 1 Published
