DEVELOPMENT AND VALIDATION OF RP-HPLC METHOD FOR
THE SIMULTANEOUS ESTIMATION OF DICLOFENAC AND
TIZANIDINE IN COMBINED TABLET DOSAGE FORM
K.E Pravallika*, D.Lalitha, K.Hemavathi, M.Bhavya, P.Ravi, Department of Pharmacy, Acharya Nagarjuna University, Guntur, India.
ABSTRACT
An isocratic, reversed phase-liquid-chromatographic method was
developed for the quantitative determination of Tizanidine and
Diclofenac sodium combined-tablet dosage form. A Inertsil ODS
column (250*4.6mm, 5µm) with mobile phase containing Potassium
dihydrogen phosphate buffer[ pH 6.9]:ACN(55:45) v/v) was used.
The flow rate was 1.0mL/min, column temperature was 30°C and
effluents were monitored at 228nm.The retention times of Tizanidine
and Diclofenac sodium were 2.517 min and 4.223 min, respectively.
The correlation co-efficient for Tizanidine and Diclofenac sodium was
found to be 0.99 and 0.99, respectively .The proposed method was
validated with respect to linearity, accuracy, precision, specificity and robustness. Recovery of
Tizanidine and Diclofenac sodium formulations was found to be in the range of 97-103% and
97-103% respectively confirms the non-interferences of the excipients in the formulation.
Due to its simplicity, rapidness and high precision. The method was successfully applied to
the estimation of Tizanidine and Diclofenac sodium in combined dosageform.
KEYWORDS: RP-HPLC, Tizanidine and Diclofenac sodium. INTRODUCTION
TIZANIDINE is a widely used Analgesic anti biotic and belongs to α-adrenergic agonist. Its
chemical formula is 5-chloro-N-(2-imidazolin-2yl)-2,1,3-benzothiadiazol-4-yl amine.
Volume 3, Issue 10, 428-436. Research Article ISSN 2277 – 7105
Article Received on 27 Sept 2014,
Revised on 19 Oct 2014, Accepted on 13 Nov 2014
*Correspondence for
Author
K.E Pravallika
Department of Pharmacy,
Acharya Nagarjuna University,
Fig no:1 Tizanidine
Tizanidine reduces spasticity by increasing presynaptic inhibition of motor neurons through
agonist action at α-2 adrenergic receptor sites.
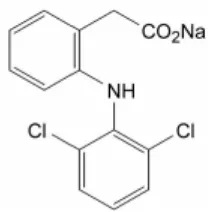
Diclofenac Sodium is widely used analgesic and belongs to Non steroidal Anti-inflammatory
drug (NSAID).Its chemical formula is 2-[(2,6-Dichlorophenyl)-amino] phenyl acetate.
Fig no:2 DICLOFENAC SODIUM
The anti inflammatory effect of diclofenac are believed to be due to inhibition of both
leucocyte migration and the enzyme cyclooxyginase leading to the peripheral inhibiition of
prostaglandil synthesis. As prostaglandin sensitize pain receptors, inhibition of their synthesis
is responsible for the analgesic effect of diclofenac. Antipyrutic effects may be due to action
of the hypothalamus, resulting in peripheral dilation, increased coetaneous blood flow and
subsequent heat dissipation.
MATERIAL AND METHODS Instrumentation
SHIMADZU HPLC instrument with Inertsil ODS column(250×4.6mm, 5µm) and Spinchrom
software were used to develop the method for the quantitative estimation of Diclofenac and
Tizanidine. A 1µL auto sampler injector unit, sonicator, GLOBAL Digital pH
meter(DPH-500), Electronic analytical balance(SHIMADZU AY220 Max d=0.1mg), UV-VIS
Spectrophotometer (ELECTRON CORPORATION, NICOLET evolution 100) were also
[image:2.595.245.349.309.415.2]Chemicals and Reagents
HPLC grade analytical Acetonitrile, HPLC grage Analytical Methanol, Potassium
Dihydrogen Phosphate, Phosphoric acid, TriEthylamine, HPLC grade analytical water were
used.
HPLC Conditions
Acetonitrile (HPLC grade) and mobile phase consisting of Potassium dihydrogen phosphate
buffer[ pH 6.9]and adjust the pH 3.5 with OPA were filtered through 0.45µ membrane
filter prior to use. before pumping from the solvent reservoir they were degassed. in the ratio
of 30:70v/v were pumped into the column at a flow rate of 1.0ml/min and ambient
temperature. The detection was monitored at 228nm and the runtime was 6min. volume of
injection loop was 10µl .prior to injection of the drug solution, the column was equilibrated
for about 15min.with the mobile phase flowing through the system.
Preparation of standard solution of the drug
Diclofenac(10 mg) and Tizanidine(10mg) working standards were accurately weighed and
transfered into separate, thoroughly cleaned and dried volumetric flasks, diluted with
methanol sonicated for 10minutes and then finally made up to the final volume with diluent
to obtain 1000ppm per mL concentrated solution.
Specificity
It is the ability to assess unequivocally the analyte in the presence of components which may
be expected to be present. In general, these might include impurities, matrix, degradants etc.
Accuracy and Precision
The methods accuracy and precision was determined by recovery experiments the percentage
recovery and standard deviation of the percentage recovery were calculated. From the data
obtained. The recovery studies were conducted six times for precision.
Preparation of sample solution
The analysis of drugs, 20 tablets were weighed and triturated in glass mortar and quantity of
powder equivalent to 10mg of Tizanidine was transferred to 10ml volumetric flask and
dissolved in sufficient quantity of methanol. It was sonicated for 10min and volume was
made up to 10ml to obtain a stock solution of 1000µg/ml of tizanidine and 2500µg/ml. This
mobile phase to get the required test concentrations of 4 µg/ml of TIZ and 120µg/ml of
Diclofenac. This solution was injected 6 times in to the column and chromatograms were
recorded and respective peak areas were measured. The contents of TIZ and Diclofenac were
calculated by using the regression equation.
Method Validation
System Suitability Studies: The column efficiency, resolution and peak asymmetry were calculated for the standard solutions (Table1).the suitability of the system for the analysis of
this drug combinations was demonstrated by the values obtained .the system suitability
parameters may fall within ±3% standard deviation range during routine performance of the
method. Standard drugs added recoveries were found to be accurate (Table-3). inter-day and
intra-day variation method was used to demonstrate precision of the studies done .six
repeated injections in intraday studies of standard and sample solutions revealed the
response factor of drug peaks and percentage RSD .In the inter-day variation studies, six
repeated injections of standard and sample solutions were made for three consecutive days
and response factor of drugs peaks and percentage RSD were calculated .chromatograms of
three different levels were shown in Fig3, the data obtained proved the developed Rp-hplc
method to be precise (table -2).
Fig.3 Standard Chromatogram For Diclofenac And Tizanidine Table1: System Suitability Parameters
PARAMETERS DICLOFENAC TIZANIDINE
Correlation Coefficient 0.9965 0.9993
LOD 6.27 0.004
LOQ 18.99 0.012
Table 2: Precision studies of Diclofenac and Tizanidine Amount of std
taken (µg/ml)
Intra-day precision (n=3) Inter-day precision (n=3)
Mean±SD %RSD Mean±SD %RSD
Diclofenac 7809.627±61.288 0.75 7810.529±61.503 0.76 Tizanidine 146.140±2.112 1.45 150.021±2.122 1.45
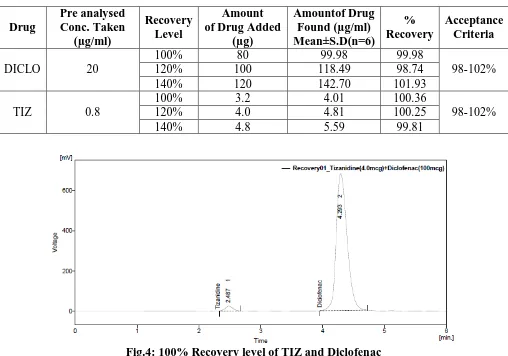
Accuracy
The accuracy of an analytical method is the closeness of that results obtained by that method
to the true value. Accuracy may often be expressed as percent recovery by the assay of
known added amount of analyte. The accuracy of the method was determined by the standard
addition method. A known amount of the standard drug was added to the fixed amount of
pre-analyzed tablet solution. The standard addition method was performed at 100%, 120%
and 140% levels. The solutions were analysed in triplicate at each level as per the proposed
method. The %RSD and recoveries were obtained within the range, results were shown in
table 3.
Table-3: Recovery Report of Diclofenac and Tizanidine Drug Pre analysed Conc. Taken (µg/ml) Recovery Level Amount of Drug Added
(µg) Amountof Drug Found (µg/ml) Mean±S.D(n=6) % Recovery Acceptance Criteria
DICLO 20
100% 80 99.98 99.98
98-102%
120% 100 118.49 98.74
140% 120 142.70 101.93
TIZ 0.8
100% 3.2 4.01 100.36
98-102%
120% 4.0 4.81 100.25
140% 4.8 5.59 99.81
[image:5.595.44.552.379.735.2]
Fig.5:120% Recovery level of TIZ and Diclofenac
Fig.6: 140% Recovery level of Tizanidine and Diclofenac Linearity and Range
Linearity of the method was determined at five concentration levels. The calibration curve
was constructed by plotting response factor against concentration of drugs. The slope and
intercept value for calibration curve was y = 66.632x + 1188.5 (R2=0.99) for Diclofenac and
y = 65.45x - 70.876 for Tizanidine The results show an excellent correlation existed between
areas and concentration of drugs within the concentration range as indicated above .The
overlay chromatograms of Linearity for Diclofenac and Tizanidine were shown inFig6 and
Fig-7: Linearity graph of Tizanidine Hydrochloride.
Fig-8: Linearity graph of Diclofenac sodium. Robustness
Robustness of the current method was investigated by analyzing the standard solution and
established system suitability with the deliberate variation of mobile phase organic variation,
flow rate and column temperature. (Table-4).
Table-4: Robustness study results of Diclofenac and Tizanidine by RP-HPLC.
Parameter Condition Rt (in min) Remark
Diclo TIZ
Optimised 1ml/min, 55:45, PH 3.5 4.223 min 2.517 min Robust
Flow rate 0.8ml/min 6.293 4.110 Robust
1.2ml/min 3.203 2.087 Robust
Wavelength 278 nm 4.257 2.803 Robust
CONCLUSION
As the solvent is economical and the method were simple, accurate and precise, these
methods can be for routine analysis of Tizanidine hydrochloride and Diclofenac sodium in
bulk and formulation. In this proposed HPLC methods the selected drugs showed good
linearity, recovery studies are within the limits(98-102%), sample recoveries were in good
agreement with their true values and the suggested non-interference of excipients in the
estimation, mobile phase and solvents are simple to prepare and economical , reliable and
less time consuming. So it can be decided that the simple, precise, accurate, specific,
economical and short proposed methods were found to be most useful for analysis purpose.
REFERENCES
1. Goodman, L.S and Gilman, A.G., The pharmacological basis of therapeutics, 9th Edn. By
Hardman, J.G., Limbard, L.E., Editors in chief, MCGraw – Hill; 1-2:1996.
2. Wolff, M.E., Burger’s Medicinal chemistry, part IV, 4 th Edn, Wiley interscience, New
York, 2: 1981.
3. Deorge, R.F, Edt, Wilson and Gisvold’s Text book of organic Medicinal and
pharmaceutical chemistry, 8th Edn, Lippincott Company, 2-4: 1982.
4. Korolkovas, A, Essentials of Medicinal chemistry, 2nd Edn, Wiley Interscience, New
York, 1-2: 1988.
5. Topliss, J.G, Edt, Quantitative structure – activity relationships of Drugs, 19, Academic
Press, London, 18-21:1983.
6. William O. Foye, Edt. Principles of Medicinal Chemistry, 3rd Edn, Varghese, Bombay,
1-2:1989.
7. Melentyeva, G, Antonova, L, pharmaceutical chemistry, Mir pulishers, Moscow, 1988.
8. L.M.Atherden, Edr, Bentley and Drivers Text Book of pharmaceutical chemistry, 8th
Edition, oxford Universitry press, 4th Impression, 1-3: 1966.
9. Snyder, Lioyd.R, Kirkiand, Joseph.J, Giajch, Joseph.L, Practical HPLC Method
Development, 2; 686-705: 1997.
10.The Drugs and Cosmetics act and Rules, Government of India Publications, 1984.
11.Shah, V.P, Midha, K.K, Findlay, J.W, Hill, H.M, Hulse, J.D, McGilveray, I.J, McKay, G,
Miller, K.J, Patnaik, R.N, Powell, M.L, Tonelli, A, Viswanathan, C.T, Yacobi, A,
Bioanalytical method validation-a revisit with a decade of progress, Pharm. Res.,
17;1551–1557: 2000.
13.Chatwal GR, Anand SK. Instrumental Methods of Chemical Analysis,
HimalayaPublishing House; 2005: 2.634-2.638.
14.V L Kulakarni and P P Mahulikar,Estimation of Rabeprazole sodium in tablet dosage
form by rapid isocratic reverse phase HPLC using volatile buffer additives, journal of
scientific & industrial research, 2006; 65: 992-994.
15.Basic UV-Vis Theory, Concepts and Applications;lblair,Dept. of chemistry,15-24.
16.Bhavesh H.Patel, Bhanubhai N.Suhagia, Madhabhai M.Patel, and Jignesh R.Patel, High
Performance Liquid Chromatography and Thin-Layer Chromatography for the
Simultaneous Quantitation of Rabeprazole and Mosapride in Pharmaceutical Products,
Journal of Chromatographic Sciences, 2008; 46: 10-14.
17.Gurudeep chatwal and sham anand, Instrumental methods of chemical analysis Analysis.
Himalaya publishers, 7th edition, 1992, Pg. no 2.624-2.639.
18.Skoog et al., Principles of Instrumental Analysis. Barkhanath publishers, 6th edition,
2006; Pg. no. 973-995.
19.Sethi P.D., Quantitative analysis of Drugs & Pharmaceuticals. CBS publishers and
distributors, New Delhi, 3rd edition, 2001 Pg. no 1-120.
20.Matheson A.J., Noble S., Drugs, Volume 59, Number 4, April, 2000: pp. 829-835(7).
21.Lloyd R. Snyder et al., practical HPLC method development. John wiley & son’s
publishers, 2nd edition, 1997: Pg. no 350-400.
22.Knevel A.M. &.Digengl F.E, Jenkins Quantitative Pharmaceutical Chemistry, Mc Graw
Hill Book Co.
23.R. Nageswara Rao, M.V.N. Kumar Talluri, A. Narasa Raju Dhananjay D. Shinde, G.S.
Ramanjaneyulu Development of a validated RP-LC/ESI-MS–MS method for separation,
identification and determination of related substances of tamsulosin in bulk drugs and
formulations, Journal of Pharmaceutical and Biomedical Analysis 46 (2008) 94–103.
24.Suby.T.Baby et al Importance Of Impurity Profiling In Drug Substances, Pharmainfo.net