DEVELOPMENT AND VALIDATION OF ANALYTICAL METHOD
FOR ESTIMATION OF NIMODIPINE CONTENT BY
UV-SPECTROSCOPIC METHOD
Rajesh S. Jadhav, Milind Ubale and Jagdish V. Bharad*
Department of Chemistry, Vasantrao Naik Mahavidyalaya, Aurangabad – 431003
(M.S.) India.
ABSTRACT
A Simple, specific, rapid, precise and accurate UV Spectrophotometric
method have been developed and Validated for determination of
Nimodipine formulation drug. Nimodipine showed the absorption
maxima in at 239.0 nm and was linear for a range of 5 µg/ml–25 µg/ml
with correlation coefficient of 0.9996. The validation of the above
proposed method was done by carrying out precision and accuracy
studies. The analytical method showed good Intra precision
(Repeatability) with relative standard deviation 0.522% and Inter
precision with relative standard deviation is 0.355% which is less than
2. The percentage recovery at three different levels i.e. 50%, 100% and
150% was found to be 49.9%, 99.1% and 149.6% respectively. The
proposed method was validated for the parameter Specificity, Precision, Linearity and range,
Ruggedness, Accuracy and recovery. Hence proposed analytical method for estimation of
Nimodipine formulation drug by UV spectrophotometer in pharmaceutical can be applied for
the routine quality control analysis.
KEYWORDS: Validation, Nimodipine, UV Spectrophotometer.
INTRODUCTION
Nimodipine is cardio selective calcium channel blocker, an Anti-hypertensive drug being
used for cerebrospinal haemorrhgae. Nimodipine is well known for its significant action on
cerebral blood vessels and its potential cytoprotective effects by reducing calcium influx into
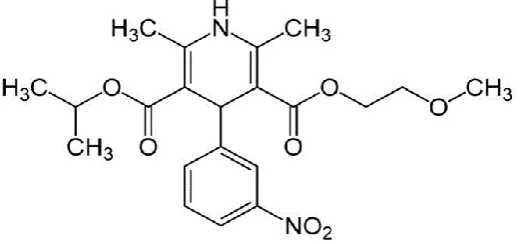
nerve.[1] The IUPAC name is 3, 5-Pyridinedicarboxylic acid, 1, 4-dihydro-2, 6-dimethyl-4-(3-nitrophenyl)-, 2-Methoxyethyl 1-Methylether ester. Nimodipine having molecular formula
Volume 7, Issue 5, 1075-1084. Research Article ISSN 2277– 7105
Article Received on 07 Jan. 2018,
Revised on 27 Jan. 2018, Accepted on 17 Feb. 2018,
DOI: 10.20959/wjpr20185-11273
*Corresponding Author
Dr. Jagdish V. Bharad
Department of Chemistry,
Vasantrao Naik
Mahavidyalaya,
Aurangabad – 431003
C21H26N2O7 and Molecular weight 418.44 g/mol. It is official in European/British
pharmacopoeia[2] and United States pharmacopoeia[3] with Assay method by Potentiometric titration. Literature survey revealed that few analytical methods are available including
Titrimetric[4], UV Spectrophotometry[5-8] and HPLC.[9-17]
In the present work, a simple, accurate and sensitive method for determining Nimodipine
content in drug substance pure form was introduced. No simple and rapid work has been
reported for the estimation of Nimodipine formulation drug. All these reported methods
either took a long time for analysis or employ mobile phases with pH adjustment of Buffer
solutions for sample preparation, which is tedious and anomalous[4-17], especially for routine testing of quality control samples of assay content study. Hence it was felt necessary to build
up a simple, rapid, economical and precise Spectrophotometric method for the direct
estimation of Nimodipine formulation drug.
The current research work deals with the development of UV Spectrophotometric method and
its validation as per International Conference on Harmonization (ICH) guideline.[18-20] The developed method was found to be simple, specific, stable, rapid, accurate, precise, reliable,
[image:2.595.169.433.468.590.2]less expensive and time saving by UV Spectrophotometric method[5-8] for the estimation of Nimodipine content in drug substance.
Figure 1: Chemical structure of Nimodipine.
MATERIALS AND METHODS
Instrumentation and Materials
U.V. visible double beam spectrophotometers SL 210 Elico with Spectra treat software
having path length 1cm U.V. matched quartz cells were used. Nimodipine Sample and
Standard gifted from Omicron Pharmaceuticals, Surat Gujarat. All chemicals, solvents and
reagents i.e. Acetic acid, Ethanol, Water and Methanol used, were analytical grade and
Method Development
Preparation of Diluent Solution
Transferred about 600 ml of water to the 1000 ml volumetric flask, then slowly added about
2.0 mL of Acetic acid with constant stirring and, mixed well, then with constant stirring
slowly added Methanol up to mark to make volume 1000 ml. used this solution as diluent.
Preparation of Standard Solution
Weighed accurately about 120 mg of Nimodipine and transferred to 200 ml amber
volumetric flask. Dissolved in 10 ml ethanol, then added diluent with intermittent shaking
and made up the volume up to 200 ml, further transferred 2 ml of solution to 100 ml amber
volumetric flask. Made volume up to mark to get a concentration of 12µg/ml.
Selection of wavelength for analysis of Nimodipine
The standard solution having concentration 12µg/ml was scanned at 200 nm to 400 nm with
[image:3.595.134.464.385.508.2]diluents as the blank to detect maximum wavelength (Figure-2).
Figure 2: Estimation of Maxima of Nimodipine.
From the above (Figure-2) spectra of Nimodipine wavelength maxima identified for
quantification were 239.0 nm (λmax).
Validation of proposed Analytical Method
The proposed method was validated according to International Conference on Harmonization
(ICH) guidelines for validation of analytical procedures [22-24]. Analysis of variance was
used to ensure the validity and performance effectiveness of the proposed analytical methods.
Specificity
Specificity is the ability to assess unequivocally the analyte in the presence of components
matrix, etc. Specificity was done by scanning of diluent solution and Standard solution of
Nimodipine having concentrations 12 µg/ml in Spectrophotometric range from 200 nm to
400 nm to check specific absorption maxima at predefined wavelength i.e. 239.0 nm and
solution stability study performed to evaluate the solution stability at different time interval
up to 26 hrs.
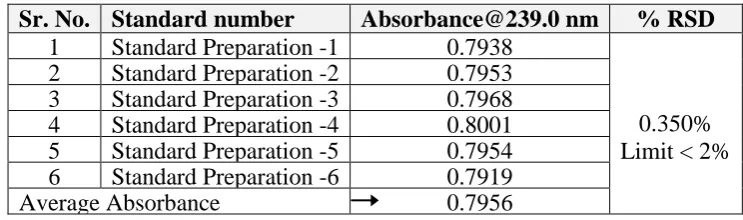
Instrument Precision
Instrument precision was performed to check the suitability of the developed analytical
method with respect to ability of instrument consistency to provide the precise wavelength
maxim when scanned the Standard solution of Nimodipine having concentrations 12 µg/ml in
the UV range from 200 nm to 400 nm. To check specific absorption maxima at predefined
wavelength 239.0 nm with reproducible absorption detection. Six separated standard
preparations were scanned / analyzed according to the proposed method of analysis. The %
RSD due to Nimodipine concentration for the six standards was found 0.350%. The % RSD
due to Nimodipine concentration for the instrument precision meets the requirements. Results
[image:4.595.110.482.429.539.2]are tabulated in the Table 1.
Table 1 Instrument Precision.
Sr. No. Standard number [email protected] nm % RSD 1 Standard Preparation -1 0.7938
0.350% Limit < 2% 2 Standard Preparation -2 0.7953
3 Standard Preparation -3 0.7968 4 Standard Preparation -4 0.8001 5 Standard Preparation -5 0.7954 6 Standard Preparation -6 0.7919
Average Absorbance 0.7956
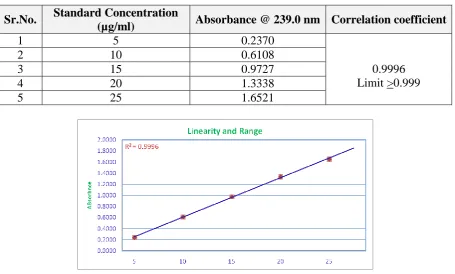
Linearity and Range
The linearity of an assay method is its ability to elicit test results, which are directly
proportional to the concentrations of drug in samples in a given range. Linearity justifies the
use of single-point calibrations. The correlation coefficient of the Regression line for was
found that 0.9996.
Five levels of five different concentrations Standard solution of Nimodipine having
concentrations 5 µg/ml, 10 µg/ml, 15 µg/ml, 20 µg/ml and 25 µg/ml, in the range relative to
the working concentrations, were prepared and read according to the method of analysis. A
calculated. The correlation coefficient (R2) for Nimodipine obtained is 0.9996. The plot is a
[image:5.595.72.528.143.417.2]straight line and the results are tabulated in the Table 2 and Curve is shown in the Figure 3.
Table 2 Linearity and Range.
Sr.No. Standard Concentration
(µg/ml) Absorbance @ 239.0 nm Correlation coefficient
1 5 0.2370
0.9996 Limit >0.999
2 10 0.6108
3 15 0.9727
4 20 1.3338
5 25 1.6521
Figure 3: Linearity and Range of Nimodipine.
Analytical Method Precision
The precision of an analytical procedure expresses the degree of agreement among individual
test results when the method is applied to multiple sampling of a homogenous sample.
Procedure for analysis of Sample
Weighed accurately about 120 mg of Nimodipine and transferred to 200 ml amber volumetric
flask. Dissolved in 10ml ethanol, then added diluent and made up the volume to 200 ml,
further transferred 2 ml of solution to 100 ml amber volumetric flask. Made volume up to
mark to get a concentration 12 µg/ml.
Intra Precision (Repeatability)
This parameter determines the repeatability of Nimodipine assay results under the same
operating conditions over a short period of time. The % RSD due to Nimodipine
concentration for the six samples was found to be 0.522%. Six separated sample preparations
were analyzed according to the proposed method of analysis. The % RSD due to Nimodipine
Table 3 Intra Precision (Repeatability) Results.
Sr. No.
Sample number
Nimodipine % RSD of Six Assay
content % Assay content
1 Sample Preparation -1 99.9
0.522% Limit < 2% 2 Sample Preparation -2 98.5
3 Sample Preparation -3 99.0 4 Sample Preparation -4 99.1 5 Sample Preparation -5 99.5 6 Sample Preparation -6 99.7 Average % Assay 99.3
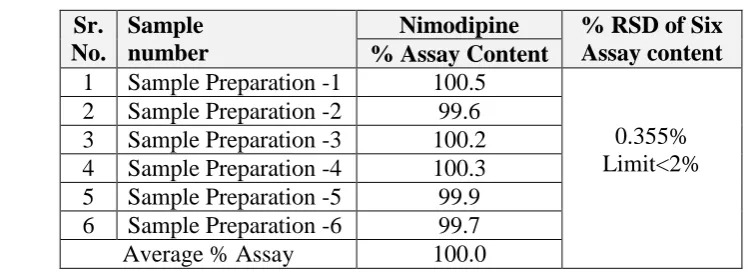
Inter Precision (Repeatability)
This parameter determines the Intermediate repeatability of Nimodipine assay results under
the same operating conditions test performed on a different day, using different makes of
reagents and solvents. The %RSD due to Nimodipine concentration for the six samples was
found to be 0.355%. Six separated sample preparations were analyzed according to the
proposed method of analysis. The % RSD due to Nimodipine concentration for the assay
meets the requirements. Results are tabulated in the Table 4.
Table 4 Inter Precision (Repeatability) Results.
Sr. No.
Sample number
Nimodipine % RSD of Six Assay content % Assay Content
1 Sample Preparation -1 100.5
0.355% Limit<2% 2 Sample Preparation -2 99.6
3 Sample Preparation -3 100.2 4 Sample Preparation -4 100.3 5 Sample Preparation -5 99.9 6 Sample Preparation -6 99.7 Average % Assay 100.0
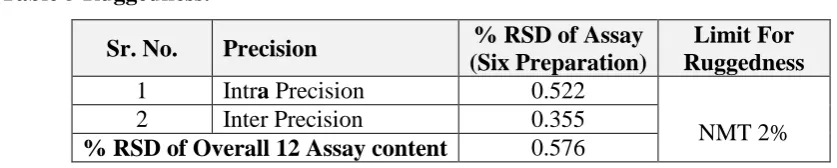
Ruggedness
Ruggedness of the method was determined by carrying out the analysis on different days,
different makes of reagents and solvents. The respective test assay results of Nimodipine
having concentration as 12μg/ml was illustrious. The result is expressed as shown in table-3,
4. The developed method for estimation of Nimodipine was found to be rugged as Shown in
[image:6.595.97.473.428.566.2]Table 5 Ruggedness.
Sr. No. Precision % RSD of Assay (Six Preparation)
Limit For Ruggedness
1 Intra Precision 0.522
NMT 2%
2 Inter Precision 0.355
% RSD of Overall 12 Assay content 0.576
ACCURACY
This parameter determines the accuracy of the assay results under the same operating
conditions test.
A Nimodipine sample was constituted analyzed for the accuracy with known quantity of
samples of Nimodipine at 50%, 100%, 150% concentration levels and assayed as per the
method stated under analytical Methods respectively. Three determinations were performed
under each concentration levels respectively. Results are shown in Tables 6, 7, 8. The % RSD
due to recovery of Nimodipine at 50%, 100%, 150% concentration levels was found to be
49.9%, 99.1% and 149.6% respectively. Nine sample preparations were analyzed according
to the proposed method of analysis. The %RSD due to Nimodipine concentration for the
assay meets the requirement and accuracy of recovery is within 98.0% to 102%. Results are
tabulated in the Table 6, 7, 8.
Table 6 Accuracy and Recovery Results @ 50 % Concentration level.
Sr.
No. Accuracy @ 50% level
Recovery of Nimodipine % Assay
content
% Recovery 98.0% to 102%
% RSD
1 Sample Preparation -1 49.5
99.8 0.923% Limit< 2% 2 Sample Preparation -2 49.8
3 Sample Preparation -3 50.4
Average % Assay 49.9
Table 7 Accuracy and Recovery Results @ 100 % Concentration level.
Sr.
No. Accuracy @ 100% level
Recovery of Nimodipine % Assay
content
% Recovery 98.0% to 102%
% RSD
1 Sample Preparation -1 99.7
99.1
0.748% Limit <
2% 2 Sample Preparation -2 98.3
3 Sample Preparation -3 99.3
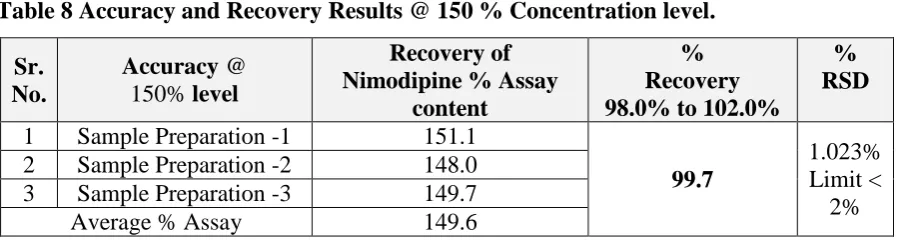
Table 8 Accuracy and Recovery Results @ 150 % Concentration level.
Sr. No.
Accuracy @ 150% level
Recovery of Nimodipine % Assay
content
% Recovery 98.0% to 102.0%
% RSD
1 Sample Preparation -1 151.1
99.7
1.023% Limit <
2% 2 Sample Preparation -2 148.0
3 Sample Preparation -3 149.7
Average % Assay 149.6
Solution Stability
Solution stability of the Nimodipine solution was performed up to 26 hrs with different time
interval and found the solution is stable showing cumulative % RSD of different time interval
is 0.530 which is less than the 2. Hence the Nimodipine solution is found stable up to 26 hrs
at room temperature and recommended 24 hrs solution stability.
RESULTS AND DISCUSSION
The method discussed in the present work provides a simple, stable, rapid, accurate, precise,
reliable, less expensive (Economical), time saving and convenient method for the analysis of
Nimodipine using U.V. Spectrophotometry. λ max selected for quantitation was 239.0 nm. In
the developed analytical method, the linearity was observed 0.9996 in the concentration range
of 5 µg/ml -25 µg/ml.
Method precision for the Nimodipine at concentrations level 12µg/ml was found in the range
of 98.5%-100.5%. Accuracy of the proposed method was ascertained by recovery studies and
the results were expressed as percent recovery and were found in the Range of
98.3%-100.7%.Values of standard deviation and coefficient of variance was satisfactorily indicating
the accuracy of both the methods. Intra-day and Inter-day precision studies were carried out
by analyzing the sample of Nimodipine different time interval on the same day and on
different days respectively. Standard deviation and coefficient of variance for Intra-day and
Inter-day precision studies was found to be less than 2 indicating precision of the proposed
method.
Based on the outcome of analytical method development and analytical validation study test
results, it was found that, the proposed analytical method for estimation of Nimodipine by
UV Spectrophotometry is Accurate, Precise, Reproducible, Stable, Simple, Rapid Time
saving and less expensive (Economical). The analytical method can be employed for routine
ACKNOWLEDGEMENT
The authors are thankful to Principal of Vasantrao Naik Mahavidyalaya, Aurangabad for
providing the laboratory facilities. Authors are thankful to Omicron Pharmaceuticals, Surat
Gujarat for providing Nimodipine gift Standard-Sample.
REFERENCES
1. Nimodipine drug available online drug bank: www.drugbank.ca/ drug /DB000393.
2. European Pharmacopoeia Published by the European Directorate for Quality of
Medicines and Healthcare (EDQM) France, 8.0th Edition., 2016-17.
3. United States Pharmacopoeia Published by the US Pharmacopeial convention US, Vol.
USP29-NF24: 1057 (www.phrmcopeia.cn/v29240/up29nf240s_m56650.html).
4. Vinod K. Gupta and Shilpi Agarwal, Assay of Nimodipine - an Anti-Hypertensive drug,
in Bulk Form and Pharmaceutical Formulations by Cathodic Adsorptive Stripping
Voltammetry, International Journal of Electrochemical Sciences, Jan 2011; 6: 37-51.
5. Sandeep Lahoti and Sanjay Toshniwal, Development and Validation of UV
Spectrophotometric Method of Nimodipine in Bulk and Tablet Formulation, Asian
Journal of Biomedical and Pharmaceutical Sciences, 2012; 2(7): 8-10.
6. Farzaneh Sotoudegan, Development of an RP-HPLC-UV Method for Simultaneous
Detection of Nimodipine and its Metabolite in Cerebrospinal Fluid of Rat, Iranian Journal
of Pharmaceutical Research, Feb 2017; 16(2): 471-477.
7. Rajesh S. Jadhav and Jagdish V. Bharad, Analytical Method Development and Validation
for estimation of Tamsulosin Hydrochloride by UV-Spectroscopic method, International
Journal of Chem Tech Research, 2017; 10(5): 740-747.
8. Manoela K. Riekes, Silvia L. Cuffini and Hellen K. Stulzer, Development and validation
of an intrinsic dissolution method for Nimodipine polymorphs, Central European Journal
of Chemistry, 2014; 12(5): 549-556.
9. Demetrius Fernandez do Nascimento and Maria Elisabete Amaral de Moraes,
Determination of Nimodipine in plasma by HPLC-MS/MS and pharmacokinetic
application, Brazilian Journal of Pharmaceutical Sciences, 2010; 46(4): 665-677.
10. Lubna B. Shaikh and Poonam P. Patil, Development and validation of RP-HPLC method
for estimation of process related impurity in Nimodipine bulk and formulation, Scholars
11. B. Rajani and K. Mukkanti, Optimized and Validated RP-HPLC method for the
estimation of Nimodipine in tablet dosage form, International Journal of Research in
Pharmacy and Chemistry, 2014; 4(1): 105-109.
12. Xiaojun Shang, Suying Ma, and Zheshen Li, Development and Validation of a RP-HPLC
Method for Determination of Nimodipine in Sustained Release Tablets, Hindawi
Publishing Corporation-Journal of Chemistry, Article ID 612082, 2013; 2013; 1-4.
13. M.M.Patel and C. Ghosh, Development and Validation of HPLC method for estimation of
Nimodipine in soft gelatin Capsule, Pharma Science Monitor-An International Journal of
Pharmaceutical Sciences, Apr-Jun 2017; 8(2): 200-209.
14. Gabriela S. Rauber and Simone G. Cardoso, Determination of Nimodipine in the
Presence of its Degradation Products and Overall Kinetics through a Stability-Indicating
LC Method, Journal of Chromatographic Science, 2013; 51: 511–516.
15. Y. Krishnaiah and V. Raju, Development and validation of RP-HPLC method for analysis
of Nimodipine in Pharmaceutical dosage form, Asian Journal of Chemistry, 2003; 15:
(3-4): 1302-1306.
16. Rajesh S. Jadhav and Jagdish V. Bharad, Analytical Method Development and Validation
of Spectroscopic Method for Estimation of Metoprolol Succinate, Scholars Research
Library-Der Pharmacia Lettre, 2017; 9(6): 285-297.
17. Nazareth Celina & Anushka Bodke, Development and Validation of Novel Cleaning
Validation and Assay Methods for Simultaneous Estimation of Rosuvastatin and
Finofibrate by RP-HPLC, World Journal of Pharmaceutical Research, Jan-2018; 7(3):
1454-1465.
18. European Pharmacopoeia General Chapter Analytical Method Validation. Published by
European Directorate for Quality of Medicines and Healthcare (EDQM) France, 9.0th Edition, 2016-17.
19. Analytical Method Validation Methodology by Health Science Authority, Sep 2014;
MQA-012B-004: 1-14.
20. International conference on harmonization of technical requirements for registration of
Pharmaceuticals for Human Use: Q2 (R1) Validation of analytical Procedures Text and