Effect of Group Mobility Models on Routing
Protocols in MANET
Smt. Rekha Shahapurkar1, Dr. Umesh Kumar Singh2, Leena Chowdhary3 1
Researcher , 2Reader
3
ICS Vikram University, Ujjain
Abstract: Mobile Ad hoc Networks (MANETs) represent complex distributed systems that do not rely on any infrastructure or centralized administration. These networks consist of wireless mobile devices which communicate with each other over the wireless channel. Because each mobile node has a limited transmission range, multi-hop communication is necessary to deliver data across the entire network. Such type of communication requires routing protocols which are capable of discovering multi hop routes between the sending and receiving nodes. These models are generally categorized into two types, i.e., (i) entity and (ii) group-based mobility models depending upon their functionalities. In this paper, we assessed the impacts of different networking contexts on the performance of different mobility models. We selected Reference Point group (RPGM) and Column mobility models from the second. We performed extensive simulations using OPNET Modeler. In addition, node density differently impacted the performance of group mobility models. The recommendation of this research will provide better understanding of the different mobility models in MANETs and their uses in real-world environments such as search and rescue operations, battlefield situations, tracking operations, people-centric networking and many more.
Key Words: MANETs, Mobility Models, AODV, OLSR.
I. INTRODUCTION
A mobile ad hoc network is a collection of wireless stations called nodes which are free to move and communicate with each other in the absence of any fixed infrastructure [1, 2]. There is lack of central administration. Any node within the transmission range of other node can directly communicate with it. In this paper we explore group mobility models and compare their effects on an ad hoc network. The final outcome of this study is to provide suggestions to the researchers and illustrate them the importance in carefully selecting and implementing a mobility model when evaluating ad hoc network protocols. A Mobility model is used to describe the movement of a mobile node, its location and speed variation over time while the simulation of a routing protocol. It is one of the key parameters that researchers have to consider before analyzing and simulating the performance of the routing protocols. We have studied how different mobility model scan influence the performance of routing protocols. Thus, it becomes necessary to choose a right mobility model when evaluating a MANET protocol. The goal of this paper is to present a number of group mobility models for the researchers to decide a perfect mobility model for performing simulations.
A. GROUP MOBILITY MODELS
In Group Mobility Models Represent Mobile Nodes whose movements are dependent. Used when Mobile Nodes cooperate with each other to accomplish a common goal. Typical situations do exist in military environments (soldiers move together), i.e. Reference Point Group Model (RPGM), Column Mobility Model (CMM), Pursue Mobility Model (PMM), Nomadic Community Model (NCMM). The location, speed and movement direction of mobile node are not affected by other nodes in the neighborhood in case of Random Waypoint model and other random models. As mentioned, these models do not capture many realistic scenarios of mobility. Moreover, in some targeted MANET applications including disaster relief and battlefield, team collaboration among users exists and the users are likely to follow the team leader. Therefore, the mobility of mobile node could be influenced by other neighboring nodes. Since the velocities of different nodes are 'correlated' in space, thus we call this characteristic as the Spatial Dependency of velocity.
B. Reference Point Group Mobility Model
1) Group movements are based upon the path traveled by a logical center of the group.
2) Individual MNs randomly move about their own pre-defined reference points.
3) The RPGM model uses a group motion vector GM to calculate each MN’s new reference point, RP(t +1), at time t +1.
4) The length of RM is uniformly distributed within a specified radius centered at RP(t +1) and its direction is uniformly
distributed between 0 and 2π.
5) Both the movement of the logical center for each group, and the random motion of each individual MN within the group are
implemented via the Random Waypoint Mobility Model.
6) Individual MNs do not use pause times while the group is moving. Pause times are only used when the group reference point
reaches a destination and all group nodes pause for the same period of time.
Figure: 1 Movement of three nodes using RPGM model
C. Column Mobility Model
The Column Mobility Model represents a set of mobile nodes (e.g., robots) that move in a certain fixed direction. This mobility model can be used in searching and scanning activity, such as destroying mines by military robots.
At time slot t, the mobile node i is to update its reference point by adding an advance vector α to its previous reference point
, Formally,
= +α
where the advance vector is the predefined offset used to move the reference grid of node i at time t. After the reference point is
updated, the new position of mobile node i is to randomly deviate from the updated reference point by a random vector .
Formally,
= + w
When the mobile node is about to travel beyond the boundary of a simulation field, the movement direction is then flipped 180 degree. Thus, the mobile node is able to move towards the center of simulation field in the new direction.
Figure: 2 Node Movement in Column Mobility Model
D. Pathway Mobility Model
One simple way to integrate geographic constraints into the mobility model is to restrict the node movement to the pathways in the map. The map is predefined in the simulation field. Tian, Hahner and Becker et al [3] utilize a random graph to model the map of city. This graph can be either randomly generated or carefully defined based on certain map of a real city. The vertices of the graph represent the buildings of the city, and the edges model the streets and freeways between those buildings. Initially, the nodes are
Reference Reference
placed randomly on the edge. Then for each node a destination is randomly chosen and the node moves towards this destination through the shortest path along the edges.
Upon arrival, the node pauses for T pause time and again chooses a new destination for the next movement. This procedure is repeated until the end of simulation.
Unlike the Random Waypoint model where the nodes can move freely, the mobile nodes in this model are only allowed to travel on the pathways. However, since the destination of each motion phase is randomly chosen, a certain level of randomness still exists for this model. So, in this graph based mobility model, the nodes are traveling in a pseudo-random fashion on the pathways.
Figure: 3 illustrates the maps used for Pathway Models.[4]
E. Obstacle Mobility Model
Another geographic constraint playing an important role in mobility modeling includes the obstacles in the simulation field. To avoid the obstacles on the way, the mobile node is required to change its trajectory. Therefore, obstacles do affect the movement behavior of mobile nodes. Moreover, the obstacles also impact the way radio propagates. For example, for the indoor environment, typically, the radio system could not propagate the signal through obstacles without severe attenuation. For the outdoor environment, the radio is also subject to the radio shadowing effect. When integrating obstacles into mobility model, both its effect on node mobility and on radio propagation should be considered.
Johansson, Larsson and Hedman et al.[5] develop three 'realistic' mobility scenarios to depict the movement of mobile users in real life, including
1) Conference scenario consisted of 50 people attending a conference. Most of them are static and a small number of people are
moving with low mobility.
2) Event Coverage scenario where a group of highly mobile people or vehicles are modeled. Those mobile nodes are frequently
changing their positions.
3) Disaster Relief scenarios where some nodes move very fast and others move very slowly.
In all the above scenarios, obstacles in the form of rectangular boxes are randomly placed on the simulation field. The mobile node is required to choose a proper movement trajectory to avoid running into such obstacles. Moreover, when the radio propagates through an obstacle, the signal is assumed to be fully absorbed by the obstacle. More specifically, if an obstacle is in-between two nodes, the link between these nodes is considered broken until one moves out of the shadowed area of the other. Due to these effects, the three proposed mobility scenarios seem to differ from the commonly used Random Waypoint
Once the pathway graph is defined, the movements of mobile nodes are restricted on the pathways. Thus, the mobile nodes are likely to travel in a semi-definitive (i.e., pseudo random) way. After the mobile node randomly chooses a new destination on the pathway graph, it moves towards it by following the shortest path through the predefined pathway graph. This shortest path is calculated by the Dijikstra's algorithm.
F. Advantages
1) Innovative approach that close to reality.
2) Allowed the MNs to enter inside the obstacle and capture the movement behavior MNs under different obstacles.
G. Disadvantages
1) Without consideration of correlated sequence of user trips.
Figure:4 Node Movement in Obstacles Mobility Model[4]
H. Performance Metrics
Many Group mobility models will be studied and analyzed. Group node movement scenario was generated with network simulator OPNET to illustrate the performance of the ad hoc network under these scenarios. To determine the impact of mobility on performance of routing protocols we evaluate two MANET protocols AODV and OLSR against two group mobility models (RPGM, CMM). Table 1 shows the simulation parameters. For RPGM and CMM, all simulations carry group of 5 nodes. The impact of the mobility models over the mobile ad hoc networks was studied. The comparison is drawn by measuring the following performance parameters: Average Delay, Throughput and Overhead.
These performance matrices are used to evaluate mobility model with AODV and OLSR protocol which are discussed earlier in detail.
Here we use following performance matrices to evaluate mobility model with AODV and OLSR protocol:
1) Delay: It is the time that a packet takes to go across the network. This time is expressed in sec. Hence all the delays in the network are called packet end-to-end delay, like buffer queues and transmission time. Mathematically it can be shown as equation
dend-end = N[dtrans + dprop + dproc ]
Where, dend-end= End to end delay
dtrans = Transmission delay dprop = Propagating delay dproc = Processing delay
2) Throughput: It is the ratio of the total data reaches at the receiver from the sender, the time it takes by the receiver to receive the last message is called as throughput [6]. Throughput is expressed as bytes or bits per sec (byte/sec or bit/sec). A high throughput is absolute choice in every network. Throughput can be represented mathematically as in equation;
Number of delivered packet * Packet size * 8
Total duration of simulation
3) Routing Overhead: Ad hoc networks are designed to be scalable. As the network grows, various routing protocols perform differently. The amount of routing traffic increases as the network grows. An important measure of the scalability of the protocol, and thus the network, is its routing overhead. It is defined as the total number of routing packets transmitted over the network, expressed in bits per second or packets per second. Some sources of routing overhead in a network are cited in [7] as the number of neighbors to the node and the number of hops from the source to the destination. Other causes of routing overhead are network congestion and route error packets. Mobile nodes are faced with power constraints and as such, power saving is a major factor to consider in implementation of MANET. Furthermore, radio power limitations, channel utilization and network size are considered. These factors limit the ability of nodes in a MANET to communicate directly between the source and destination. As the number of nodes increases in the network, communication between the source and destination increasingly relies on intermediate nodes. Most routing protocols rely on their neighbors to route traffic and the increase in the number of neighbors causes even more traffic in the network due to multiplication of broadcast traffic.
I. Simulation Setup
The Simulation was setup to evaluate the effect of mobility model in performance of MANET routing protocols AODV and OLSR. We use OPNET Modeler version 14.5. A college campus network was modeled within an area of 1500m*1500m. The mobile nodes were spread within the area. We take the FTP traffic to analyze the effects on routing protocols. The nodes were wireless LAN mobile nodes. Simulation time of each scenario was 300secs. We collect DES (global discrete event statistics) on each protocol with
Reference Point Group and Column mobility model were used in this simulation. Mobile nodes move at a constant speed of 10 m/s, and when touches the destination, the pause time is 5 sec and after that it choose a new random destination. Every other parameter was fairly kept constant for all the stimulated scenarios.
We examined average statistics of the delay, throughput and Routing Overhead for the MANET. Our key goal of our simulation was to evaluate the effect of Group mobility model in performance of MANET routing protocols.
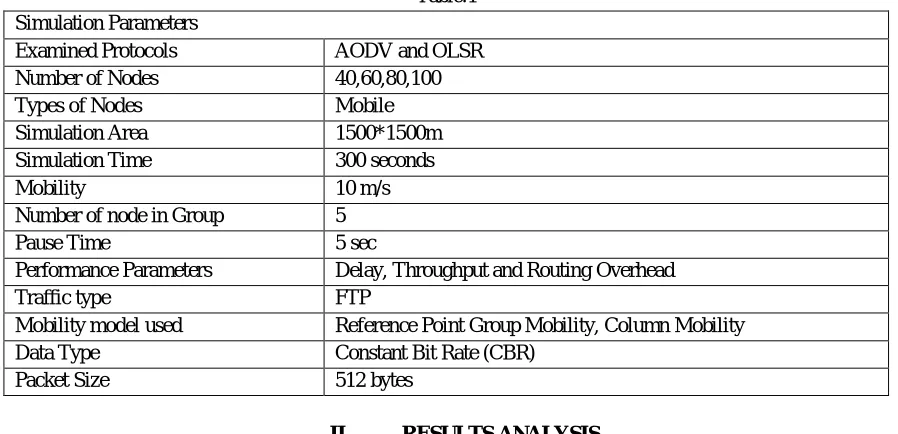
In Table 1 we describe the simulation parameters that are used in this simulation in order to evaluate and compare the performance of mobility model with selected routing protocols (AODV and OLSR) over a MANET network. Each and every scenario there is different numbers of mobile nodes. In the ad hoc network, we have simulated the following scenarios:
[image:5.612.83.532.216.433.2]Different Network density with Reference Point Group and Column mobility model.
Table.1 Simulation Parameters
Examined Protocols AODV and OLSR
Number of Nodes 40,60,80,100
Types of Nodes Mobile
Simulation Area 1500*1500m
Simulation Time 300 seconds
Mobility 10 m/s
Number of node in Group 5
Pause Time 5 sec
Performance Parameters Delay, Throughput and Routing Overhead
Traffic type FTP
Mobility model used Reference Point Group Mobility, Column Mobility
Data Type Constant Bit Rate (CBR)
Packet Size 512 bytes
II. RESULTS ANALYSIS
Simulation Environment: We analyze and discuss the results of simulations we done. We begin the analysis of AODV and OLSR protocols by parameters such as delay, throughput and Routing Overhead. The results obtained in the form of graphs. Here in first scenario we used 40 mobile nodes and one fixed wlan server. The network size is of 1500*1500 meters. After that IPv4 addressing was assigned to all the nodes. All the settings must be done according to the requirement. The scenario is shown in Table 1. The protocols such as AODV OLSR are tested against parameters i.e. delay, throughput, Routing Overhead.
A. Evaluation of Reference Point Group Mobility Model by varying node density
1) Average Delay: The packet end-to-end delay is the time of generation of a packet by the source up to the destination reception. So this is the time that a packet takes to go across the network. This time is expressed in sec. Hence all the delays in the network are called packet end-to-end delay. Sometimes this delay can be called as latency; it has the same meaning as delay.
Figure : 5 Average Delay with respect to nodes density in Reference Point Group Mobility Model
Random Point Group Mobility
0 0.4 0.8 1.2 1.6
40 60 80 100
[image:5.612.210.416.567.717.2]The figure 5 shows the delay of AODV and OLSR protocol with respect to number of nodes. To analyze the delay of AODV and OLSR protocol against varying number of nodes from 40, 60, 80 and 100 nodes in Reference Point Group Mobility model. In 40 Node both protocols have approximate same values (AODV= 0.73 and OLSR=72) sec. It shows that with increase the network density Delay in AODV is increase but at 100 node, it will decrease and OLSR also increase gradually from small size node density to high node density.
Throughput is defined as; the ratio of the total data reaches a receiver from the sender. The time it takes by the receiver to receive the last message is called as throughput. Throughput is expressed as bytes or bits per sec (byte/sec or bit/sec). A high throughput is absolute choice in every network.
Figure: 6 Throughput with respect to nodes density in Reference Point Group Mobility Model
The figure 6 shows the throughput of AODV and OLSR protocol with respect to number of nodes. To analyze the throughput of AODV and OLSR protocol against varying number of nodes from 40, 60, 80 and 100 nodes in Reference point group mobility Model. In this mobility model, AODV and OLSR show almost equal at medium node density and after that throughput in OLSR is increased in comparison of AODV.
2) Routing Overhead: The total number of routing packets transmitted during the simulation. For packets sent over multiple hops, each transmission of the packet (each hop) counts as one transmission. Routing packets are those that are originated by the routing protocol and do not also include user data.
Figure: 7Routing Overhead with respect to nodes density in Random Point Group Mobility Model
The figure7 shows the Routing Overhead of AODV and OLSR protocol with respect to number of nodes. To analyze the Overhead of AODV and OLSR protocol against varying number of nodes from 40, 60, 80 and 100 nodes in Reference Point Group Mobility Model. In this mobility model, we observe that initially AODV have overhead value=5 in 40 node density and consistently presents the lowest routing overhead, Regardless of Network size. OLSR have more overhead, accordingly as the network size is increased in comparison of AODV.
B. Evaluation of Column Mobility Model by varying node density
Figure : 8 Average Delay with respect to nodes density in Column Mobility Model
The figure 8 shows the delay of AODV and OLSR protocol with respect to number of nodes. To analyze the delay of AODV and OLSR protocol against varying number of nodes from 40, 60, 80 and 100 nodes in Column Mobility model. In 40 Node AODV had minimum delay, it shows that with increase in the network density Delay in AODV is increase and OLSR had low delay at 40 nodes and after it also increase gradually from 60 nodes to 100 nodes.
2) Throughput: Throughput is the time the total size of useful packets that received at all the destination nodes. It is the total number of bits (in bits/sec) forwarded from wireless LAN layers to higher layers in all WLAN nodes of the network.
Figure:7 Throughput with respect to nodes density in Column Mobility Model
The figure 7 shows the throughput of AODV and OLSR protocol with respect to number of nodes. To analyze the throughput of AODV and OLSR protocol against varying number of nodes from 40, 60, 80 and 100 nodes in Column mobility Model. In this mobility model, AODV and OLSR show almost equal at medium node density and after that decreased throughput in OLSR in comparison of AODV.
3) Routing Overhead: The total number of routing packets transmitted during the simulation. For packets sent over multiple hops, each transmission of the packet (each hop) counts as one transmission. Routing packets are those that are originated by the routing protocol and do not also include user data.
Figure: 8 Routing Overhead with respect to nodes density in Column Mobility Model
C. Performance of AODV and OLSR using the Group Mobility models over varying node density
The simulation results obtained using AODV and OLSR with Reference Point Group and Column mobility models over varying
node density are shown in figures 9, 10 and 11.
Delay
[image:8.612.153.500.131.238.2](A) (B)
Figure: 9 Average Delay of AODV AND OLSR with respect to nodes density in Mobility Model
Our simulation results, shown in Figs. 9(a) and 9(b), indicate that on the average delay With regard to performance under group mobility models, we find that AODV and OLSR had lower delay in RPGM. However, packet delay for OLSR is higher than AODV for large networks in CM. The higher delay of OLSR can be explained on two basis; (1) TC messages are more frequent in order to maintain the freshness of routes, and (2) MPR re-selection is needed as the network size increases. While OLSR requires routing table updates, AODV is able to establish alternate paths more quickly by broadcasting new route request (RREQ) packets. The route maintenance scheme also plays a vital role in healing the broken routes and reducing the delay involved in route re-discovery. AODV outperforms other protocols in group mobility models for small, medium and large size networks.
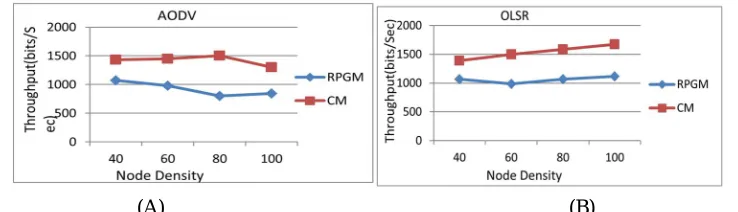
1) Throughput
[image:8.612.123.492.367.473.2](A) (B)
Figure: 10 Throughput of AODV AND OLSR with respect to nodes density in Mobility Model
The simulation results for Throughput ismeasured for the routing protocols under two mobility models are shown in Figs. 10(a) and
10(b). We first compare the group mobility models (RPGM, CMM) for group communications. OLSR achieve good Throughput in large networks in both Mobility Models. This is attributed to the quick route discovery process, which allows the routing algorithm to quickly adapt to route changes in AODV. In OLSR, TC messages play a pivotal role in route provisioning in both inter and intra group communications. Therefore, in RPGM and CMM models, increase in number of nodes does have significant impact on OLSR AODV routing performance.
2) Overhead
[image:8.612.109.509.595.701.2](A) (B)
Here, AODV and OLSR generate the higher routing overhead with increase in node density in CM. In CW mobility model, OLSR generate the higher routing overhead in comparison of AODV. In RPG mobility model, we observe that AODV and OLSR presents average Routing Overhead regardless number of nodes.
From Above results we observed that Reference Point Group Mobility Model is good for working with higher number of nodes because delay is decrease with increase in number of nodes and having higher throughput with increase in node density and lower routing overhead.
III. CONCLUSION
We analyze the performance of two protocols AODV and OLSR by using tow group mobility models (reference point mobility and column mobility ) on the basis of parameters i.e. End to end delay, Throughput, and Routing Overhead. We use OPNET simulator to find out the results of simulation.
Tabl.2 Comparison of Mobility with Matrices
Mobility Protocol Average Delay Throughput Routing Overhead
RPGM AODV Avg. Low Avg.
OLSR Avg. Avg. High
CM AODV High High. High
OLSR High High High
First, number of nodes is varied and maximum speed is fixed, secondly speed of nodes is varied but the maximum number of nodes is fixed and in third number of nodes and speed is fixed and pause time is varied. On the basis of simulation results concluded that, AODV has better throughput in all models, but column mobility performs better in case of throughput than other models, i.e. OLSR is more scalable. Delay to send the packet at the destination is less in group mobility model and when protocol is AODV has lesser delay when column mobility model is used. At last, for throughput has most satisfactory performance among two mobility models. When number of nodes is fixed but speed is varied it concluded that, OLSR have a better throughput than AODV protocol and performance is good when column mobility model is used. Routing overhead is high for OLSR in both column and group mobility model when number of nodes was varied and lower overhead is with AODV when speed of nodes was different.
REFERENCES
[1] Mobile ad hoc networks (MANET). http: //www.ietf.org/html.charters/manet-charter.html, 1997. IETF Working Group Charter
[2] Anuj K. Gupta, Harsh Sadawarti, Anil K. Verma, “Review of various Routing Protocols for MANETs”, International Journal of Information & Electrical Engineering, Article No. 40, 1(3): 251- 259, November 2011
[3] J. Tian, J. Hahner, C. Becker, I. Stepanov and K. Rothermel. Graph-based Mobility Model for Mobile Ad Hoc Network Simulation, in the Proceedings of 35th Annual Simulation Symposium, in cooperation with the IEEE Computer Society and ACM. San Diego, California. April 2002.
[4] G. Lin, G. Noubir, and R. Rajaraman. Mobility models for adhoc network simulation. International Journal of Computer Science and Network Security, 7(6):160–164, 2007.P. Johansson, T. Larsson, N. Hedman, B. Mielczarek, and M. Degermark, Scenariobased performance analysis of routing protocols for mobile ad-hoc networks, in International Conference on Mobile Computing and Networking (MobiCom'99), 1999, pp. 195--206.
[5] Mohammad Naserian, Kemal E. Tepe and Mohammed Tarique, “Routing overhead analysis for reactive routing protocols in wireless ad hoc networks,” IEEE Conference on Wireless And Mobile Computing, Networking And Communications, WiMob, 2005, pp. 87 – 92