ORIGINAL RESEARCH
ADULT BRAIN
Visualization of the Medial and Lateral Geniculate Nucleus on
Phase Difference Enhanced Imaging
M. Kitajima, T. Hirai, T. Yoneda, Y. Iryo, M. Azuma, M. Tateishi, K. Morita, M. Komi, and Y. Yamashita
ABSTRACT
BACKGROUND AND PURPOSE: The precise identification and measurement of the medial geniculate nucleus and lateral geniculate nucleus on MR imaging remain technically challenging because the thalamic nuclei are small structures. We compared the visualization of the medial geniculate nucleus and lateral geniculate nucleus on phase difference enhanced imaging with 3D high-resolution phase imaging, 2D-T2WI, STIR, proton attenuation–weighted imaging, and DTI acquired at 3T. We also measured the volume and height of the medial geniculate nucleus and lateral geniculate nucleus on phase difference enhanced imaging.
MATERIALS AND METHODS: Phase difference enhanced, 2D-T2-weighted, STIR, proton attenuation–weighted, and DTI were acquired on a 3T MR imaging unit in 10 healthy volunteers. Two neuroradiologists recorded the qualitative visualization scores of the medial geniculate nucleus and lateral geniculate nucleus, specifically the identification of their boundaries, for all images. Measurement differ-ences were assessed with the Wilcoxon signed rank test. The volume and height of the medial geniculate nucleus and lateral geniculate nucleus were measured on phase difference enhanced imaging and compared with previously reported values.
RESULTS:The qualitative visualization scores of the lateral geniculate nucleus and medial geniculate nucleus were significantly higher on phase difference enhanced images than on T2-weighted, proton attenuation–weighted, STIR, or DTI (P⬍.05). On phase difference enhanced imaging, the medial geniculate nucleus and lateral geniculate nucleus were bordered by low-intensity structures: the cerebral peduncle, the origin of the optic radiation, and the superior and inferior quadrigeminal brachia. The volume of the medial geniculate nucleus and lateral geniculate nucleus varied from 74.0 to 183.75 mm3(mean, 129.0⫾34.7 mm3) and from 96.5 to 173.75 mm3(mean, 135.2⫾28.0 mm3), respectively.
CONCLUSIONS: For the depiction of the medial geniculate nucleus and lateral geniculate nucleus on 3T MR imaging, phase difference enhanced imaging is superior to conventional MR imaging. The medial geniculate nucleus and lateral geniculate nucleus volumes vary among individuals.
ABBREVIATIONS:LGN⫽lateral geniculate nucleus; MGN⫽medial geniculate nucleus; PADRE⫽phase difference enhanced; PD⫽proton attenuation–weighted imaging
T
he medial geniculate nucleus (MGN) and lateral geniculate nucleus (LGN) are the specific thalamic nuclei that relay the auditory and optic pathways, respectively. The triangular LGN is located in the posterior region of the thalamus. It is borderedanteriorly by the cerebral peduncle and the optic tract and poste-riorly by the origin of the optic radiation. The oval MGN, with its long axis directed forward and laterally just medial to the LGN, is bordered anteriorly by the inferior quadrigeminal brachium and posteriorly by the superior quadrigeminal brachium. There is in-creasing interest in assessing the MGN and LGN in healthy sub-jects and in patients with ophthalmic diseases such as glau-coma.1-6However, current imaging methods for identifying the
MGN and LGN vary, and imaging findings are inconsistent. Technical advances in neuroimaging facilitate the study of sub-cortical structures in vivo. Phase difference enhanced (PADRE) im-aging yields a high tissue contrast that delineates specific white matter tracts and intracortical structures.7-9On
high-spatial-res-olution 3T PADRE images, small structures, including the central tegmental tract, the medial and dorsal longitudinal fascicules, and the stria of Gennari, which are difficult to appreciate on
conven-Received May 16, 2014; accepted after revision February 10, 2015.
From the Department of Diagnostic Radiology, Graduate School of Medical Sci-ences (M.K., T.H., Y.I., M.A., M.T., Y.Y.) and Department of Medical Physics in Ad-vanced Biomedical Sciences, Faculty of Life Sciences (T.Y.), Kumamoto University, Kumamoto, Japan; and Department of Radiology (K.M., M.K.), Kumamoto University Hospital, Kumamoto, Japan.
Paper previously presented at: Annual Meeting of the American Society of Neuro-radiology and the Foundation of the ASNR Symposium, May 18 –23, 2013; San Di-ego, California.
Please address correspondence to Mika Kitajima, MD, Department of Diagnostic Radiology, Graduate School of Medical Sciences, Kumamoto University, 1-1-1, Honjo, Chuo-ku, Kumamoto-shi, Kumamoto, 860-0811, Japan; e-mail: mkitaji@ kumamoto-u.ac.jp
tional MR images, are delineated.7,8Also, the contrast between
specific white matter structure (eg, the optic radiation) is higher on PADRE than on conventional MR images.7
We compared visualization of the MGN and LGN on PADRE, 2D-T2-weighted, STIR, proton attenuation–weighted (PD), and DTI acquired at 3T. We also measured the volume and height of the MGN and LGN on PADRE images.
MATERIALS AND METHODS
Subjects
This study was approved by our institutional review board. In-formed consent was obtained from all healthy volunteers (6 men, 4 women; age range, 28 – 47 years; mean, 36.8⫾6.7 years); none had a history of neurologic, psychiatric, or ophthalmologic dis-eases, including glaucoma.
Imaging Protocol
All measurements were performed on a 3T MR imaging scanner (Achieva; Philips Healthcare, Best, the Netherlands). A set con-sisting of 3D high-resolution T1 fast-field echo images for PADRE, 2D-T2-weighted, STIR, PD, and DTI was obtained in all subjects. The images were acquired in the transverse plane parallel to the anterior/posterior commissure line. The scan parameters of each sequence were the following: 3D-T1 fast-field echo images for PADRE: TR/TE, 32/23 ms; FOV, 200 mm; matrix size, 307⫻ 384; reconstructed matrix size, 400⫻ 400; spatial resolution, 0.5⫻0.5⫻1.0 mm; sensitivity encoding factor, 2; flip angle, 10°; 1 signal acquired; image acquisition time, 3 minutes 36 seconds. We also reconstructed PADRE images with a 3-mm thickness.For 2D-PD and T2-weighted images, the parameters were the follow-ing: TR/TE, 4000/17, 80 ms; FOV, 200 mm; matrix size, 280⫻ 400; spatial resolution, 0.4⫻0.4 mm; turbo factor, 9; sensitivity encoding, 1.5; refocusing angle, 120°; 2 signals acquired; acquisi-tion time, 2 minutes 16 seconds to 3 minutes 20 seconds. For STIR, the parameters were the following: TR/TE, 5000/20 ms; FOV, 200 mm; matrix size, 224⫻320; TI, 120 ms; spatial resolution, 0.4⫻0.4 mm; turbo factor, 9; sensitivity encoding factor, 2.0; refocusing angle, 120°; 2 signals acquired; acquisition time, 3 minutes 10 seconds. The section thickness and gap of the 2D sequences were 3.0 and 1.0 mm, respectively. DTI was obtained with single-shot spin-echo EPI: TE, 49 ms; spatial resolution, 0.8⫻0.8⫻3.0 mm; 6 signals acquired; b-factor, 0/700 s/mm2; EPI factor, 49. We used a tilted/2 pulse and
optimized outer-volume suppression. The image acquisition time was 11 minutes 15 seconds. Gray-scale fractional anisotropy maps were used for evaluation. On the fractional anisotropy map, areas with high degrees of fractional anisotropy (eg, internal capsule) are bright, and areas with low degrees of fractional anisotropy (eg, gray matter) are dark.
Data Processing of PADRE
The PADRE technique was described in previous reports.8,9One
of the major concepts responsible for the power of the PADRE technique is the “phase difference selection,” which enhances the magnetic properties of the target tissue. PADRE imaging classifies and selects various phase differences,⌬, to enhance the different tissues, and enhances all of them on the magnitude image兩兩by
the enhancing function w(⌬). Finally, the PADRE image PADRE is reconstructed asPADRE⫽w(⌬)兩兩.
In this study, the positive phase difference (⌬) was selected to enhance myelin.7,8
All images were calculated off-line with in-house software. All postprocessing of DTI and PADRE images was fully auto-matic without user intervention to eliminate operator bias.
MGN and LGN Localization and Measurement
To evaluate the visibility of the boundaries of the MGN and LGN, 2 experienced neuroradiologists (T.H., Y.I. with 21 and 9 years of neu-roradiology experience, respectively) independently assessed the original PADRE (1-mm thickness), reconstructed PADRE (3-mm thickness), 2D-T2-weighted, STIR, PD, and DTI by referring to the atlas of Schaltenbrand and Wahren10andDuvernoy’s11atlas.
They assigned MGN and LGN visualization scores to each im-aging method, where 0⫽no visible boundary of the nucleus, 1⫽poorly visible with a fuzzy boundary, 2⫽mostly visible with a slightly fuzzy boundary, and 3⫽well-identified nucleus and clearly distinguishable from neighboring structures.
A third neuroradiologist (M.K. with 20 years of neuroradiol-ogy experience) subsequently measured the area of the MGN and LGN by manually outlining their boundaries on each original PADRE image section. The total volume was obtained by sum-ming the areas of all sections. The number of sections on which the nucleus was identified was also recorded as the height of the nucleus. To assess the volume and height of the MGN and LGN, we compared our estimated volume and height based on PADRE with previously reported histologic and MR imaging measurements.5,6,12,13
Statistical Analysis
To assess interobserver agreement for each imaging method, we calculated the percentage of agreement as the number of subjects who received identical scores from both observers divided by the number of subjects (n⫽10). Visualization scores were analyzed with the Wilcoxon signed rank test by using all 10 subjects to determine the difference between PADRE and each of the other imaging methods. APvalue⬍.05 was statistically significant. All statistical analyses were performed with MedCalc, Version 12.7.1.0 (MedCalc for Windows, Mariakerke, Belgium).
RESULTS
surrounding structures, the cerebral peduncle and the origin of the optic radiation (Figs 1 and 2). The MGN was hyperintense compared with surrounding structures, the superior and
infe-rior quadrigeminal brachia, which ex-hibited low signal intensity (Figs 1 and 2).
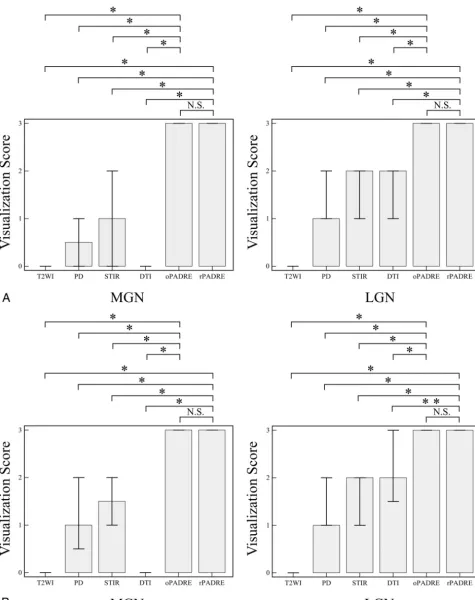
Statistics of the visualization scores assigned by the 2 observers are presented in Fig 3. The average scores assigned to the LGN by the 2 observers for T2-weighted, PD, STIR, DTI, and original and reconstructed PADRE images were 0.0 ⫾ 0.0, 1.33 ⫾ 0.57, 1.56 ⫾ 0.64, 1.78⫾ 0.77, 2.88⫾ 0.33, and 2.82⫾ 0.51, respectively. The average MGN scores for T2-weighted, PD, STIR, DTI, and original and reconstructed PADRE images were 0.10⫾0.30, 0.85⫾0.77, 1.08⫾0.86, 0.0⫾0.0, 2.98⫾0.16, and 2.94 ⫾ 0.23, respectively. For the 20 LGN scores (10 subjects), the percentage of agreement was 100.0%, 70%, 75%, 45%, 85%, and 89.5% for T2-weighted, PD, STIR, DTI, and the original and re-constructed PADRE images, respec-tively. For the MGN scores, the percent-age of agreement was 80%, 45%, 55%, 100%, 100%, and 88.9% for T2-weighted, PD, STIR, DTI, and original and reconstructed PADRE images, re-spectively. The difference in scores be-tween original PADRE and all of the other 2D images for both the LGN and MGN was statistically significant (P⬍ .01). The difference in scores between reconstructed PADRE and all of the other 2D images for both the LGN and MGN was also statistically significant (P⬍.05). In contrast, we found no sta-tistically significant difference between original and reconstructed PADRE for both the LGN and MGN.
The volume of the MGN and LGN measured on original PADRE varied among individuals; for the MGN, it ranged from 74.0 to 183.75 mm3(mean,
129.0⫾34.7 mm3), and for the LGN,
96.5–173.75 mm3(mean, 135.2⫾28.0
mm3). The height of the MGN varied
from 4.0 to 7.0 mm (mean, 5.7⫾0.88 mm); for the LGN, it varied from 4.0 to 7.0 mm (mean, 5.5⫾0.95 mm).
DISCUSSION
Our results indicated that PADRE yielded a superior visibility of the MGN and LGN when directly compared with T2-weighted, DTI, PD, and STIR im-ages. The superior visualization on PADRE compared with T2-weighted, PD, and STIR images may be attributable to different mechanisms of signal generation (ie, the susceptibility-based
[image:3.594.55.373.48.505.2]methods used in PADRE versus the relaxation-based techniques of T2-weighted, PD, and STIR). Phase images acquired with high magnetic fields (7T and above) yield information about biologic structures that are not usually identified by conventional MR im-aging.14-16Blood deoxyhemoglobin, tissue lipid, nonheme iron
content,15and water-protein exchange17have been proposed as
possible origins of the MR imaging signal frequency shift respon-sible for the contrast on phase images. In contrast, the discrepan-cies between structures on relaxation-based methods originate from differences in the decay rates, which are small. Thus, high-resolution phase imaging may be able to delineate small structures that are difficult to evaluate on conventional MR images.
In addition to the comparison between original PADRE and 2D images, we also compared reconstructed PADRE and 2D se-quences with nearly identical thickness. On reconstructed PADRE images, the signal-to-noise ratio becomes higher com-pared with original PADRE images. In contrast, the boundary between the target structures and the surrounding structures on reconstructed PADRE images becomes more obscure because of an increase in the partial volume effect. However, we found no statistically significant difference for the visualization score of LGN and MGN between original and reconstructed PADRE images.
He and Yablonskiy18reported that the optic radiation, a
my-elin-rich structure, exhibited a negative phase value in the left-handed system—that is, a positive phase value in the right-handed system used in our study. In our study, positive phase values appeared as dark signals. The fiber orientation of the optic radiation to the main magnetic field direction and the cerebral blood volume also affect the image contrast of the optic radiation on phase images.18Li et al19demonstrated that the structure of
myelin and its orientation to the static magnetic field affect white matter fiber susceptibility, resulting in a negative susceptibility change. Ide et al7reported that the contrast between the optic
radiation and the surrounding tissue on PADRE was similar to that on myelin-stained specimens. As with the optic radiation, the difference in the myelin content between the thalamic nuclei, the LGN and MGN, and their surrounding structures, specifically the cerebral peduncle, optic radiation, and the superior and infe-rior quadrigeminal brachia, may have affected the contrast on PADRE images. Furthermore, the fiber orientation and cerebral blood volume of those small white matter tracts also may have affected this contrast. We suggest that the high contrast between the thalamic nuclei and neighboring white matter tracts on PADRE facilitates the easy identification of the MGN and LGN.
Horton et al20provided the first PD images of the LGN; they
performed postmortem studies and studies on living human sub-jects. They demonstrated a good correlation between MR images and anatomic sections. For the identification of the LGN, Fujita et al21
documented an excellent correspondence between PD images and images obtained with functional methods by using blood oxygen level– dependent imaging. In our study, the averaged visualization scores of the LGN and MGN were higher for PD than for T2-weighted images and lower than those recorded for PADRE images. Devlin et al22reported a different approach for the identification of
the MGN and LGN by using DTI. They used probabilistic tractogra-phy to automatically segment the 2 nuclei from surrounding struc-tures on the basis of their distinctive patterns of connectivity to the rest of the brain. DTI data for probabilistic tractography were ob-tained by using a doubly refocused spin-echo sequence and cardiac gating with 60 diffusion-weighted images. These resulted in an acqui-sition time of approximately 20 minutes and a spatial resolution of 1.875⫻1.875⫻2.5 mm3. They reported identifying the MGN and
LGN in all of their 5 neurologically healthy volunteers. However, because probabilistic tractography requires thousands of iterations, it is computationally intensive. In contrast, PADRE images can be ac-quired with commonly available imaging sequences within a reason-able image acquisition time. Furthermore, PADRE provides images
[image:4.594.54.284.47.502.2]with high spatial resolution and low image distortion and is less com-putationally intensive than the probabilistic tractography technique. The previously reported LGN volume measured on MR
im-ages in healthy subjects varied from 75.3 to 86.7 mm3.5,6In a
histologic study,12it varied from 66 to 157 mm3; among
individ-uals, the variation was 2- to 3-fold. In our search of the literature,
[image:5.594.56.532.43.643.2]we found only 1 postmortem study on the volume of the MGN13;
this nucleus was reported to be 5-mm wide, 4-mm high, and 4- to 5-mm long. Our volume measurements for LGN were larger than those reported in earlier MR imaging and histologic studies.5,6,12
The height of the LGN was slightly larger than that in earlier MR imaging studies (4.7– 4.8 mm), and the height of the MGN was somewhat larger than the height (4 –5 mm) in the histologic in-vestigation of Winer.13
We attribute the discrepancy between ours and earlier findings on the LGN and MGN to several factors: First, our study popula-tion was small. Second, differences in the identificapopula-tion tech-niques such as the blood oxygen level– dependent and spin-echo techniques used by others and our susceptibility-based technique affect volume measurements. Blooming artifacts may be more prominent on gradient-echo images such as PADRE than on spin-echo images. They depend on the orientation and geometry of the object and on various imaging parameters. Third, the volume of living and postmortem human brains removed from the skull and fixed with formalin may be different.
Measuring the LGN volume on MR imaging may be of clinical importance. According to earlier MR imaging studies, the volume of LGN decreases with age.6In patients with glaucoma, the LGN height
and volume are diminished and the extent of atrophy of the LGN is correlated with the clinical stage.1,5We believe that the PADRE
tech-nique reinforces the clinical utility of MR imaging in the diagnosis of diseases involving the LGN and MGN. Prospective clinical studies are underway in our laboratory to confirm the utility of PADRE.
Our study has some limitations. First, all of our subjects were healthy young Japanese adults. Our findings may not be applicable to other populations or age groups. Because the volume of the LGN varies 2- to 3-fold among individuals, additional qualitative and quantitative studies of the MGN and LGN on PADRE images are required in larger independent series comprising healthy subjects and patients with diseases affecting the MGN and LGN. Second, we did not compare the visualization of the nuclei directly between the original PADRE and other 3D sequences at identical spatial resolu-tions. Further studies of comparison between PADRE and other 3D sequences at identical spatial resolutions are required. In addition to the direct comparison, registration of all the sequences with transpar-ent overlay may be useful to evaluate the differences of the LGN and MGN visualization among the sequences.
CONCLUSIONS
On PADRE images, visualization of the MGN and LGN is signif-icantly better than that on current standard MR imaging se-quences. Therefore, PADRE is useful for the localization of the MGN and LGN.
Disclosures: Tetsuya Yoneda—RELATED:Grant: Philips Healthcare,*Comments: joint research;UNRELATED:Royalties: Philips Healthcare,*Comments: development of SWI with phase enhancement. *Money paid to the institution.
REFERENCES
1. Dai H, Mu KT, Qi JP, et al.Assessment of lateral geniculate nucleus atrophy with 3T MR imaging and correlation with clinical stage of glaucoma.AJNR Am J Neuroradiol2011;32:1347–53
2. O’Connor DH, Fukui MM, Pinsk MA, et al.Attention modulates
responses in the human lateral geniculate nucleus.Nat Neurosci
2002;5:1203– 09
3. Selemon LD, Begovic A.Stereologic analysis of the lateral geniculate nucleus of the thalamus in normal and schizophrenic subjects. Psy-chiatry Res2007;151:1–10
4. Hess RF, Thompson B, Gole G, et al.Deficient responses from the lateral geniculate nucleus in humans with amblyopia.Eur J Neurosci
2009;29:1064 –70
5. Gupta N, Greenberg G, de Tilly LN, et al.Atrophy of the lateral geniculate nucleus in human glaucoma detected by magnetic reso-nance imaging.Br J Ophthalmol2009;93:56 – 60
6. Li M, He HG, Shi W, et al.Quantification of the human lateral geniculate nucleus in vivo using MR imaging based on morphometry: volume loss with age.AJNR Am J Neuroradiol
2012;33:915–21
7. Ide S, Kakeda S, Korogi Y, et al.Delineation of optic radiation and stria of Gennari on high-resolution phase difference enhanced im-aging.Acad Radiol2012;19:1283– 89
8. Kakeda S, Korogi Y, Yoneda T, et al.A novel tract imaging technique of the brainstem using phase difference enhanced imaging: normal anatomy and initial experience in multiple system atrophy.Eur Ra-diol2011;21:2202–10
9. Yoneda T.Triple-layer appearance of human cerebral cortices on phase difference enhanced imaging using 3D principle of echo shifting with a train of observations (PRESTO) sequence.In: Pro-ceedings of the Annual Meeting of the International Society for Magnetic Resonance in Medicine, Honolulu, Hawaii. April 18 –24, 2009 10. Schaltenbrand G, Wahren W.Microscopic series with fixed overlays
for anatomic explanation.In: Schaltenbrand G, Wahren W, eds. At-las for Stereotaxy of the Human Brain. 2nd ed. Stuttgart: Thieme; 2005:51–55
11. Naidich TP, Duvernoy HM, Delman BN, et al.Internal architecture of the brain stem with key axial sections.In: Naidich TP, Duvernoy HM, Delman BN, et al, eds.Duvernoy’s Atlas of the Human Brain Stem and Cerebellum: High-Field MRI, Surface Anatomy, Internal Structure, Vascularization and 3D Section Anatomy. Vienna: Springer-Verlag; 2009:53–94
12. Andrews TJ, Halpern SD, Purves D.Correlated size variations in human visual cortex, lateral geniculate nucleus, and optic tract.
J Neurosci1997;17:2859 – 68
13. Winer JA.The human medial geniculate body. Hear Res1984; 15:225– 47
14. Abduljalil AM, Schmalbrock P, Novak V, et al.Enhanced gray and white matter contrast of phase susceptibility-weighted images in ultra-high-field magnetic resonance imaging.J Magn Reson Imaging
2003;18:284 –90
15. Duyn JH, van Gelderen P, Li TQ, et al.High-field MRI of brain cortical substructure based on signal phase.Proc Natl Acad Sci U S A
2007;104:11796 – 801
16. Marques JP, Maddage R, Mlynarik V, et al.On the origin of the MR image phase contrast: an in vivo MR microscopy study of the rat brain at 14.1 T.Neuroimage2009;46:345–52
17. Zhong K, Leupold J, von Elverfeldt D, et al.The molecular basis for gray and white matter contrast in phase imaging. Neuroimage
2008;40:1561– 66
18. He X, Yablonskiy DA.Biophysical mechanisms of phase contrast in gradient echo MRI.Proc Natl Acad Sci U S A2009;106:13558 – 63 19. Li W, Wu B, Avram AV, et al.Magnetic susceptibility anisotropy of
human brain in vivo and its molecular underpinnings.Neuroimage
2012;59:2088 –97
20. Horton JC, Landau K, Maeder P, et al.Magnetic resonance imaging of the human lateral geniculate body.Arch Neurol1990;47:1201– 06 21. Fujita N, Tanaka H, Takanashi M, et al.Lateral geniculate nucleus: anatomic and functional identification by use of MR imaging.AJNR Am J Neuroradiol2001;22:1719 –26