A COMPARATIVE EVALUATION OF INTRUSION
DETECTION TECHNIQUES IN WIRELESS SENSOR
NETWORK
1
YOUSEF EL MOURABIT*, 1AHMED TOUMANARI, 2ANOUAR BOUIRDEN, 1
NADIA EL MOUSSAID
1
Equipe signaux, systems et informatique (
ESSI) , National School of Applied Sciences, Ibn ZohrUniversity, Agadir Morocco
2 Laboratoire thermodynamique et énergitique, faculty of science Agadir, Ibn Zohr university, Morocco
E-mail: *[email protected]
ABSTRACT
Wireless Sensor Network (WSN) are composed of low cost sensor nodes and usually deploy in open and unprotected area, which make security the major challenge in this kind of network, due to their characteristics WSN is vulnerable to various types of attacks and intrusions, where it require security mechanisms to defend against these attacks. Intrusion detection system (IDS) is one of the principal and efficient defensive methods against intrusion and attacks in WSN. This paper presents a comparative evaluation of the most performant intrusion detection techniques in IDS systems for WSNs and identifying their features. For each technique, the main principal and the related functionality are briefly introduced, discussed, and compared, based on the operational advantages and inconveniences. To implement and measure the performance of these techniques we prepare our dataset, based on KDD'99, after normalizing our dataset, we determined normal class and 4 types of attacks, and used the most relevant attributes for the classification process, by applying CfsSubsetEval with BestFirst approach. Finally a set of principles are concluded, which have to be satisfied in future research of implementing IDS for WSNs, in order to help researchers in the selection of IDS for WSNs, recommendations of promising proposed IDSs are provided with future directions for this research.
Keywords: Wireless sensor network, Intrusion detection system, Classification, KDD’99
1. INTRODUCTION
Wireless sensor network (WSN) consists of sensor nodes, which are small devices equipped with sensors, wireless transceiver, battery and microcontroller, the major function of this nodes is to monitors a physical phenomenon and measure physical factors. WSNs are applied to various fields of science and technology that have applications starting from military surveillance and reconnaissance to civilian application area like traffic controlling, environment monitoring, home automation and healthcare applications[1].Due to restricted characteristics of this kind of network, such as data storage, limited power supply, small memory size, low transmission bandwidth, and according to simplicity of sensor nodes, dynamic network topology, open and unprotected area of deployment, Security is a big concern. Thus, all security mechanisms for WSNs must take into consideration these constraints. Many traditional security mechanisms have been proposed for securing WSN such as data aggregation protocols
techniques using in IDS for WSN. Section 4 present a comparison and evaluation results. Finally, a conclusion is introduced in section 5, a set of recommendations, and principles are suggested to boosting the performance of IDS in WSN for future researches.
2. RELATED WORK
In WSN, any kind of unauthorized or unapproved activities are called intrusions. An IDS is a collection of the resources, methods, and tools, to help identify, and report intrusions [7]. IDSs should satisfy the requirements of WSN restricted characteristics. According to these characteristics and other factors, we can classify IDS relating to: Source of the collected data, intruder type, intrusion type, method of detection, and IDS architecture [8]. Each division is divided itself into several subdivision as shown in the table below.
Source of the collected data
Intruder type
Intrusion type
Method of detection
IDS Architect ure
Network-based
Host-based Hybrid
Internal
External Dos
Maliciou -s use
Leakage
Penetrati on
Masquer ade
Anomaly detection
Misuse detection
Specifica tion based detection
Stand alone
Distribut e and cooperati ve
hierarchi cal
Table 1: IDSs Classification
There are many different and possible configurations for IDSs in WSNs, therefore defining an effective and efficient intrusion detection technique is a very big challenge, and IDS must combine several or one feature from each division.
3. STUDY AND ANALYSIS OD ANOMALY AND INTRUSION DETECTION TECHNIQUES IN WSN
Designing an efficient and effective intrusion detection technique to manage security in WSN is a very big concern. However, Determinate an anomaly detection technique is an essential step to ensure the best performance for IDS in WSN, which is the main motivation of our work. This paper aims to compare the different anomaly intrusion detection techniques, these techniques, had ability to detect unknown attacks compared to
the other techniques (specification, signature) that require complex expression, and memory size which WSNs cannot offer [9]. This part explains briefly the common and newly anomaly detection intrusion proposed for IDS in WSN, show their principals and functionality. The advantages and limitations of the studied techniques are presented in the end of this section. The investigated techniques are: K-means, Naïve Bayesian classifier, Support Vector Machine, and Random Forest.
3.1 Clustering approach by K-means:
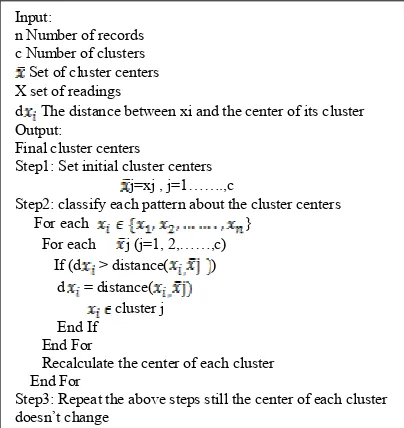
The k-means algorithm is used to recognize data into different classes (known as clusters). This unsupervised learning algorithm is widely used in sensor node clustering problem due to its linear complexity and simple implementation [10].Loo et al. [11], present an intrusion detection scheme for sensor networks based on anomaly detection. They use a fixed width clustering algorithm to allow for the detection of previously unseen attacks. They also came up with 12 general features for detecting sinkholes and periodic route error attacks. Generally -means is used to detect novel intrusions in WSN by dividing or clustering the network connection’s data to collect the majority of the intrusions together in one or several clusters, the figure below present the K-means clustering algorithm:
Figure 1: K-means algorithm
The k-means steps to resolve such node clustering problem are: (i) Randomly choose k nodes to be the initial centroids for different clusters. (ii) Label each node with the closest
Input:
n Number of records c Number of clusters Set of cluster centers X set of readings
d The distance between xi and the center of its cluster
Output:
Final cluster centers
Step1: Set initial cluster centers j=xj , j=1…….,c
Step2: classify each pattern about the cluster centers
For each }
For each j (j=1, 2,……,c) If (d > distance( ) d = distance(
cluster j End If End For
Recalculate the center of each cluster End For
[image:2.595.308.510.452.666.2]centroid using a distance function. (iii) Re-compute the centroids using the current node memberships. (iv) Stop if the convergence condition is valid. However, the main problems, in addition to being sensitive to initialization, the result of the clustering mostly depends on the selection of the initial centers, that k-means is a limiting case of fitting data by a mixture of k Gaussians with identical, isotropic covariance matrices ( = σ2I), when the soft assignments of data points to mixture components are hardened to allocate each data point solely to the most likely component [12].
3.2 Naïve Bayesian classifier:
Naïve Bayes is a simple, fast and accurate classifier based on Bayes’ theorem with independent assumption. It is used in [13] for Mobile ad hoc network, and In [14], a novel approach was proposed to identify the possible faulty sensor node using Naïve Bayes classifier in wireless sensor network. The proposed Naïve Bayes framework was deployed for performing WSN faulty node(s) detection. A new attribute, the end-to-end transmission time of each packet arrived at the sink is analyzed using Naïve Bayesian classifier for determining the network status. This technique doesn’t involve any additional protocol and extra resource consumption of sensor nodes, it suggests a list of suspicious faulty nodes to the user [14]. The figure below presents the principal of naive Bayesian classifier.
m Number of classes C1, C2,….,Cm Dimentional vector for class
t = {dct1,dct1,…….,dctn}
where =1
K total ksenses of network operation
S = { , ,….., }
Is a product of the data that appear in the
scene = (1)
Where is the number of data I
in scene .
[image:3.595.309.508.353.502.2]L= arg [ logP( )+ ] (2)
Figure 2: Naïve Bayesian Classifier algorithm
The probability L provides the most appropriate decision of the classification task with prior distributions of all classes P(DCt). It is presented as the following equation (1), The prior distributions are found during training phase by Maximum Likelihood Estimation (MLE). When the testing attribute values were collected, the classification can be done by equation (2). Usually naïve bayesian classifier as a statistical methods
require too much data processing in order to sift the information that is valuable for statistics. Even below, Naïve Bayes (utilized as a classifier) has been successfully applied to wireless sensor network based intrusion detection by several researchers [15].
3.3 Support Vector Machine:
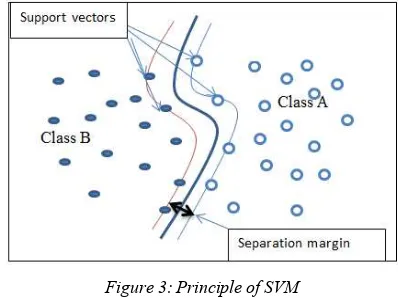
Support vector machines (SVMs): It is a machine learning algorithm that learns to classify data points using labeled training samples [16]. In WSN SVM is used to investigate temporal and spatial correlations of data for detecting malicious behavior of a node. To illustrate, given WSN’s observations as points in the feature space, SVM divides the space into parts. These parts are separated by margins, and new recording will be classified based on which side of the gaps they fall on as presented in figure below:
Figure 3: Principle of SVM
There were currently limited researches using SVM classifier in WSN. In [17] the SVM algorithm, including optimizing a quadratic function with linear constraints provides an alternative method to the multi-layer neural network with non-convex and unconstrained optimization problem. Kaplantzis et al [18] worked on centralized intrusion detection system based on support vector machine to detect selective forwarding and black hole attacks, the IDS is running in the base station using one-class SVM in training collected nodes ‘data. Centralized SVM training method allows a better separation of the classes [19]. However, it requires a high communication overhead, and it is less suitable for resource-constrained sensor networks. For this reason many authors mentioned that the SVM training fit the requirement of sensor nodes in terms of energy cost ([19], [20], [21], [22]).
[image:3.595.87.293.498.618.2]Random forests are based on collection learning method for classification (and regression) that operate by constructing a multitude of decision trees at training time and outputting the class that is the mode of the classes output by individual trees. Random tree, on the other hand, involves construction of multiple decision trees randomly [23]. Each tree is constructed using the following algorithm:
Figure 4: Random Forest algorithm
In [24] Random Forests (RF) is used as a classifier for the proposed intrusion detection framework. RF gives better performance in designing IDS that is efficient and effective for network intrusion detection. Recently, in [25] a novel data mining approach based on random forests was proposed to characterize and classify a similar large scale physical environment. The proposed data mining formulation, allows better performance in terms of tradeoff between energy efficiency and accuracy. Compared to a single decision tree algorithm, RFs runs efficiently on large datasets with a better performance.
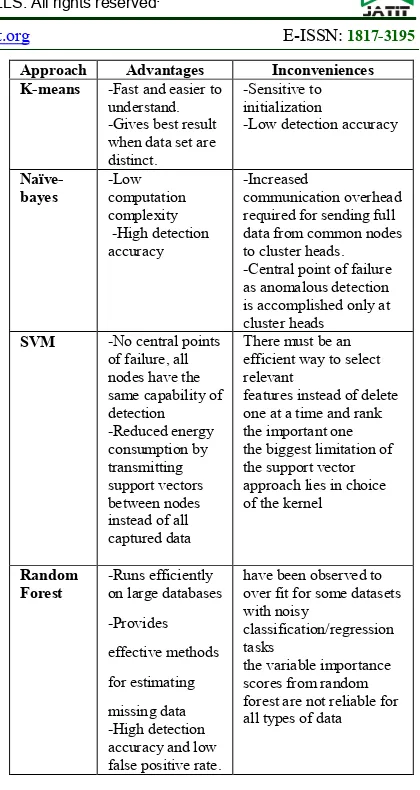
Approach Advantages Inconveniences
K-means -Fast and easier to understand. -Gives best result when data set are distinct.
-Sensitive to initialization
-Low detection accuracy
Naïve-bayes
-Low computation complexity -High detection accuracy
-Increased
communication overhead required for sending full data from common nodes to cluster heads. -Central point of failure as anomalous detection is accomplished only at cluster heads
SVM -No central points
of failure, all nodes have the same capability of detection -Reduced energy consumption by transmitting support vectors between nodes instead of all captured data
There must be an efficient way to select relevant
features instead of delete one at a time and rank the important one the biggest limitation of the support vector approach lies in choice of the kernel
Random Forest
-Runs efficiently on large databases
-Provides
effective methods
for estimating
missing data -High detection accuracy and low false positive rate.
have been observed to over fit for some datasets with noisy
classification/regression tasks
[image:4.595.300.510.97.492.2]the variable importance scores from random forest are not reliable for all types of data
Table 2: Advantages and inconveniences of studied techniques
4. EXPERIMENT RESULTS
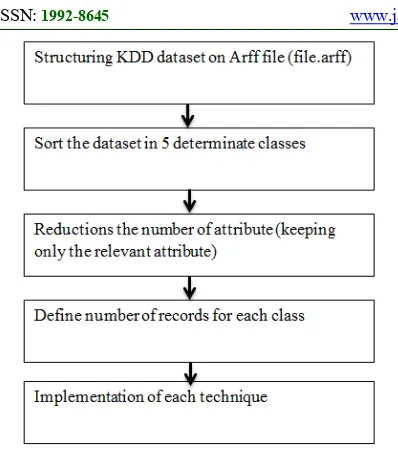
A series of experiments were conducted to evaluate and simulate each technique, we used several critical evaluation metrics to compare these techniques. The algorithms simulations are done in WEKA. We can summarize the treatments performed to prepare our database, based on the standard KDDCup’99 intrusion detection dataset [26], in the following 5 steps:
Step1: Let the number of training cases be N, and the number of variables in the classifier be M. Step2: We are told the number m of input variables
to be used to determine the decision at a node of the tree; m should be much less than M.
Step3: Choose a training set for this tree by choosing n times with replacement from all N
available training cases (i.e. take a bootstrap sample). Use the rest of the cases to estimate the error of the tree, by predicting their classes.
Step4: For each node of the tree, randomly choose m variables on which to base the decision at that node. Calculate the best split based on
these m variables in the training set. Step5: Each tree is fully grown and not pruned (as
Figure 5: Classifier implementation Process
Step1: The main aim of this first step is to structure all records on Attribute-Relation File Format (ARFF), which is an input file format used by the machine learning tool WEKA [27].
Step2: In this step we classed all types of attacks, existing in the dataset, on four principal categories. As shown the table below:
category Attacks type
Probe Ipsweep, mscan, nmap, portsweep, saint, satan
Dos Apache, back, land, mailbomb, neptune, pod, processtable, smurf, teardrop,
udpstorm
U2R Buffer_overflow, loadmodule, perl,rootKit, ps, sqlattack, xterm R2L ftp_write, guess_password, imap,
[image:5.595.316.497.173.242.2]multihop
Table 3: Attacks Category
The four classes above can be used in IDS to classify intrusions, rather than just the distinction between "normal" and "intrusion". This gives more information about the intrusion, which can affect the method of reporting and acting on the alleged detection. We note also that the spoofed attacks altered, Replayed Routing Information, Sinkhole, Sybil, Wormholes attacks must go through the Probe step before they start to attack, so they would be classified as Probe attacks. Selected Forwarding, which uses illegitimate transfer data to an attack, is known as a Dos attack. Hello Floods are caused by internal attacks, and are therefore classified as U2R.
Step3: In this step we choose the number of records treated for each class, we used 70% in training stage and 30% in the test stage for each class.
Class Number of records
Normal 10233
Dos 41748
Probe 441
R2L 96
U2R 92
Table 4: Records Number
Step4: Reduction characteristics are a process of choosing a subset of the original characteristics so that the feature space is reduced optimally at an endpoint. In general, a characteristic is good if it is relevant to the concept of class but not redundant to one of the other functions. In our experiment, Weka tool is used for reduction function. CfsSubsetEval with BestFirst approach is applied to the set of training data to obtain the relevant features for the classification process. Each subset was analyzed using correlation analysis to identify important features for a specific attack. The best known Measuring correlation is the linear correlation coefficient. For a pair of variables (x, y), the linear correlation coefficient r (x, y) is given by the expression below:
The main principle of CfsSubsetEval method is evaluating the value of a subset of attributes by considering the individual predictive ability of each element as well as the degree of redundancy between them. It generates subsets of features that are highly correlated with the class while having a low cross correlation. The results are presented in the table below:
Table 5: Selected Attributes
Search Method CFS Subset Evaluator + Best first Selected
attributes
5,6,9,11,12,14,31,32
Attributes names
[image:5.595.88.290.454.561.2]Step5: Implementation of techniques of intrusion detection: Before this step, we start firstly defining a set of terms, which represent critical evaluation metrics:
True positive (TP): classifying an intrusion as an intrusion. The true positive rate is synonymous with detection rate, sensitivity which are other terms often used in the literature
False positive (FP): incorrectly classifying normal data as an intrusion:
An additional performance metrics are also commonly used referred to as precision:
Recall: The recall is defined by the number of occurrences found relevant in terms of the number of relevant occurrences that owns the database. This means that when a user queries the database you want to appear all occurrences that could meet their need for information. If this balance between the questioning of the user and the number of occurrences is important then presented the recall rate is high. Conversely if the system has many interesting instances but they do not appear in the list of answers, we speak of silence. Silence opposes the recall.
F-measure: The F-measure can be
interpreted as a weighted average of the precision and recall, where an F1 score reaches its best value
at 1 and worst score at 0:
Receiver operating characteristic (ROC): is a graphical plot that illustrates the performance of a classifier system as its discrimination threshold is varied. The curve is created by plotting the true positive rate against the false positive rate at various threshold settings.
The main objective is to compute the accuracy of anomaly detection process for each technique based on this set of evaluation metrics. In the fifth step we implemented each intrusion detection technique on our dataset, using Weka tool .below the result obtained according to the metrics defined above.
K-means Detailed Accuracy By Class TP Rate FP Rate Preci sion Reca ll F-Meas ure ROC
Normal 0.4 0.11
9
0.44 8
0.4 0.64 0.99
9 Dos 0.74
9 0.58 6 0.83 1 0.74 9 0.58 1 0.99 9
U2r 0 0 0 0 0.5 0.99
4
R2L 0 0 0 0 0.5 0.99
8 Probe 0.32
2
0.11 0.02
4 0.32 2 0.60 6 0.98 7 Naïve Bayes Detailed Accuracy By Class
TP Rate FP Rate Preci sion Reca ll F-Meas ure ROC
Normal 0.80 7 0.00 8 0.96 2 0.80 7 0.87 8 0.99 5 Dos 0.93
9 0.01 4 0.99 6 0.93 9 0.96 7 0.97 8 U2r 0.98
9 0.00 1 0.65 7 0.98 9
0.79 1
R2L 0.84 5
0.01 4
0.1 0.84
5
0.17 9
0.98 7 Probe 0.93
4
0.06 4
0.11 0.93
4
0.19 7
0.98 7 SVM Detailed Accuracy By Class TP Rate FP Rate Preci sion Reca ll F-Meas ure ROC
Normal 0.99 7 0.00 1 0.99 5 0.99 7 0.99 6 0.99 9
Dos 1 0.00
1
1 1 1 0.99
9 U2r 0.98
9
0 0.97
2 0.98 9 0.98 4 0.99 4 R2L 0.85
6
0 0.90
2 0.85 6 0.87 8 0.99 8 Probe 0.94
8
0 1 0.94
8
0.97 3
0.98 7 Random Forest Detailed Accuracy By Class
TP Rate FP Rate Preci sion Reca ll F-Meas ure ROC
Normal 1 0 0.99
8
1 0.99
9 1
Dos 1 0 1 1 1 1
U2r °0.98 9
0 1 °0.98
9
0.99 5
0.99 5 R2L 0.91
8
0 0.96
7 0.91 8 0.94 2 1
Probe 0.98 0 0.99
8
0.98 0.98
9 1
Table 6: Accuracy of studied techniques
accurate system (a precision score of 0.99), but inefficient (with a reminder of 0.10, which will mean that found that 10% of possible attacks). In the same vein, a technique whose recall is high (0.99), but low accuracy (0.10) will provide many reply erroneous attacks in addition to those relevant.
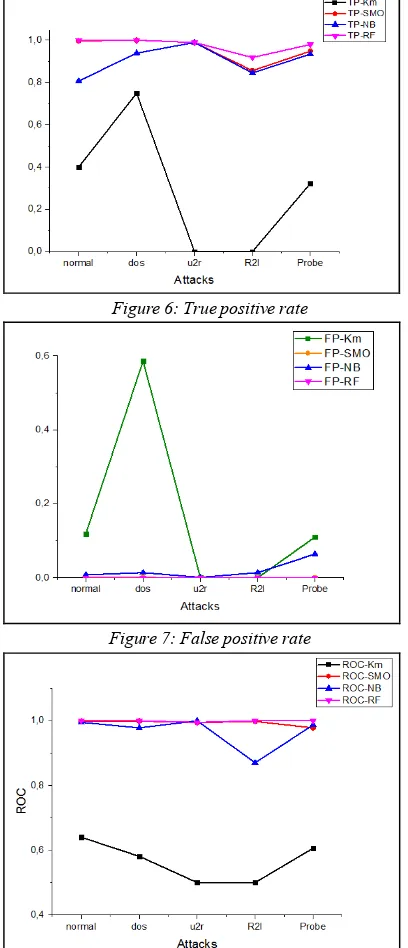
[image:7.595.86.290.246.720.2]In the following figures we evaluate the performance of studied techniques based on: True positive TP, false positive FP and ROC curve:
Figure 6: True positive rate
Figure 7: False positive rate
Figure 8: ROC curve
According to TP results the rate of true positive for the Random Forest method is -1-, which makes it the most efficient technique, however it is less matured even reach zero for some class using K-means, for SMO and Naïve Bayesian classifier they have different value according to the class.
Regarding the curves representing false positive detection rate, we deduce that the most effective method is Random Forest, where the FP rate reach 0 for all classes, while we notice a higher rate for K-means above for DoS attacks class, the rate of Naive Bayesian classifier and SVM varies according to the class (more efficient for some classes than other).
The system is perfectly performed if the ROC curve equal to "1". So it is clear that the efficient method is Random forest, which is the most effective for all classes based on ROC. Naïve Bayes and SMO have different value for each class, while we remark a lower rate for the K-means approach.
Indeed, the superiority of Random Forest intrusion detection technique, SVM, Naïve Bayes and K-means respectively, can be clearly observed, in this order, according to previous metrics we can classify these techniques, from the higher to lower performant technique. Classification based on suitable feature selection is one of the main factors which reach the performance of IDS, especially in WSN.
5. CONCLUSION AND FUTUR WORK
classifier that is trained well with network patterns, selecting and preprocessing an appropriate dataset.
REFRENCES:
[1] Garcı´a-Herna´ ndez CF, Ibargu¨ engoytia-Gonza´ lez PH, Garcı´a-Herna´ ndez J, Pe´rez-Dı´az JA. Wireless sensor networks and applications: a survey. IJCSNS Int J Comput Sci Network Security 2007;7(3):264–73. [2] Sang Y, Shen H, Inoguchi Y, Tan Y, Xiong N.
Secure data aggregation in wireless sensor networks: a survey. In: The proceeding of the 7th international conference on parallel and [3] Al-Karaki JN, Kamal AE. Routing techniques in
wireless sensor networks: a survey. IEEE Wirel Commun 2004;11(6):6–28.
[4] Xiao Y, Rayi VK, Sun B, Du X, Hu F, Galloway M. A survey of key management schemes in wireless sensor networks. Comput Commun 2007;P: 30-23,14–41.
[5] Palpanas T, Papadopoulos D, Kalogeraki V, Gunopulos D. Distributed deviation detection in sensor networks. SIGMOD Rec 2003, 77–82. [6] Su C, Chang K, Kuo Y. The new intrusion
prevention and detection approaches for clustering-based sensor networks. In: The proceeding of IEEE wireless communications and networking conference, vol. 4; 2005. P: 32. [7] M. Ngadi, A.H. Abdullah, and S. Mandala, “A
survey on MANET intrusion detection”, International J.Computer Science and Security, volume 2, number 1, 2008, pages 1-11.
[8] T.S. Sobh, “Wired and wireless intrusion detection system: Classifications, good characteristics and state-of-the-art”, Elsevier J. Computer Standards and Interfaces, volume 28, number 6, 2006, pages 670-694.
[9] Mamun MSI, Kabir AFM. Hierarchical design based intrusion detection system for wireless ad hoc sensor network. Int J Network Security Appl (IJNSA) 2010;2(3):102–17.
[10] T. Kanungo, D. M. Mount, N. S. Netanyahu, C. D. Piatko, R. Silverman, and A. Y. Wu, “An efficient k-means clustering algorithm: Analysis and implementation,” IEEE Transactions on Pattern Analysis and Machine Intelligence, vol. 24, no. 7, 2002, pp. 881–892.
[11] C. E. Loo, M. Y. Ng, C. Leckie, and M. Palaniswami, “Intrusion detection for routing attacks in sensor networks,” International Journal of Distributed Sensor Networks, vol. 2, no. 4, 2006, pp. 313–332.
[12] Banerjee A, Merugu S, Dhillon I, Ghosh J (2005) Clustering with Bregman divergences. J Mach Learn Res 6:1705–1749.
[13] Y.EL Mourabit, A. Toumanari, H.Zougagh, “A Mobile Agent Approach for IDS in Mobile Ad Hoc Network”, International Journal of Computer Science Issues, Vol. 11, Issue 1, No 1, January 2014
. [14] Bill C.P. Lau a, Eden W.M. Maa, Tommy W.S. Chow, “Probabilistic fault detector for Wireless Sensor Network”, Expert Systems with Applications 41 (2014) 3703–3711. [15] Koc, L., Mazzuchi, T. A., & Sarkani, S. (2012).
A network intrusion detection system based on a hidden Naïve Bayes multiclass classifier. Expert Systems with Applications, 39(18), 13492–13500.
[16] I. Steinwart and A. Christmann, “Support vector machines”. Springer, 2008.
[17] T. O. Ayodele, “Types of machine learning algorithms,” in New Advances in Machine Learning. InTech, 2010.
[18] S. Kaplantzis, A. Shilton, N. Mani, and Y. A. Sekercioglu, “Detecting Selective Forwarding Attacks in Wireless Sensor Networks using Support Vector Machines”, In 3rd International Conference on Intelligent Sensors, sensor Networks and Information, IEEE, Melbourne, Australia, pp.335-340, 2007.
[19] K. Flouri, B. B.Lozano, and P. Tsakalides, “Optimal Gossip Algorithm for Distributed Consensus SVM Training in Wireless Sensor Networks”, In Proc.16th International Conference on Digital Signal Processing, IEEE, Santorini, Greece, pp.1-6, 2009.
[20] K. Flouri, B. B.Lozano, and P. Tsakalides, “Training a SVM-based Classifier in Distributed Sensor Networks”, In Proc.14nd European Signal Processing Conference, Florence, Italy, 2006.
[21] S.Rajasegarar, C.Leckie, M.Palaniswami, and J. C Bezdek, “Quarter Sphere Based Distributed Anomaly Detection in Wireless Sensor Networks”, In IEEE International Conference on Communications, Glasgow, Scotland, , 2007, pp.3864-3869.
[22] K. Flouri, B. B. Lozano, and P. Tsakalides, “Distributed Consensus Algorithms for SVM Training in Wireless Sensor Networks”, In Proc.16th European Signal Processing Conference, Lausanne, Switzerland, 2008. [23] Hastie, T., et al., The elements of statistical
The Mathematical Intelligencer, 2005. 27(2): p. 83-85.
[24] Abebe Tesfahun, D. Lalitha Bhaskari, “Intrusion Detection using Random Forests Classifier with SMOTE and Feature Reduction”, 2013 International Conference on Cloud & Ubiquitous Computing & Emerging Technologies
[25] MOHAMMAD ALWADI & GIRIJA CHETTY, “Energy Efficiency Data Mining for Wireless Sensor Networks Based on Random Forests”, International Journal on Data Mining and Intelligent Information Technology applications(IJMIA) Volume4, Number1, June 2014.
[26] http://kdd.ics.uci.edu/databases/kddcup99/ kddcup.