http://dx.doi.org/10.4236/ojsst.2015.52008
The Research of Railway Line State
Detection Signal Processing Method
Based on EMD
Wen-Fa Zhu
1, Hui-Zhen Ma
2, Xiao-Dong Chai
1, Shu-Bin Zhen
11College of Urban Railway Transportation, Shanghai University of Engineering Science, Shanghai, China 2Library, Shanghai University of Engineering Science, Shanghai, China
Email: [email protected]
Received 3 April 2015; accepted 18 June 2015; published 24 June 2015
Copyright © 2015 by authors and Scientific Research Publishing Inc.
This work is licensed under the Creative Commons Attribution International License (CC BY). http://creativecommons.org/licenses/by/4.0/
Abstract
In this paper, an EMD de-noising algorithm is proposed based on the statistical feature of random noise, which can eliminate the noise impaction digital integrator generated by the collected rail-way line state detection signals using strap-down inertial technology. Firstly, the first IMF compo-nent of the noise-dominant modes treated by the process “random sort-sum-average-reconstruc- tion”, the signal-to-noise ratio is improved while the noise power is weakened in this process. Then the signal-to-noise cut-off can be determined according to the characters of noise autocorre-lation function. Finally, the global threshold could be selected by the noise-dominant mode com-ponent, so as to realize the function of filtering. The simulation and validation based on the col-lected railway line acceleration data using the EMD de-noising algorithm show that the noise in railway line state acceleration detection signals can be effectively eliminated using this method.
Keywords
Track Status, EMD, Autocorrelation Function, Statistical Properties, Filtering
1. Introduction
2. Hilbert-Huang Transform
Hilbert Huang transform [2] [3] is a signal processing method proposed by Dr. Hung of the America NASA. it has obvious advantages in dealing with nonlinear and non-stationary signal. HHT mainly contains the following two parts: Empirical Mode Decomposition (EMD) and Hilbert transform, the empirical mode decomposition (EMD) is core of the HHT. According to the fluctuation of real size step by step signal in the signal decomposi-tion (for signal smoothing processing), EMD get a series of different characteristics of the scale of IMF (Intrin-sic Mode Function, the intrin(Intrin-sic mode function). The IMF should meet the following two conditions:
1) the IMF, an number of extreme points and zero points should be equal or the maximum difference of 1; 2) signal locally symmetric on the time axis. the any point of signal, the mean of the envelope curve point de-termined by the signal local maxima and the envelope point determination and local minimum value is 0.
3. The EMD Denoising Algorithm Based on the Statistical Characteristic of Noise
3.1. Characteristics of the Random Noise Statistic
For discrete signal which length is N, the power is calculated as:
( )
2 1 1 N X i iP x n
N =
=
∑
(1)If the original signal amplitude of each element was kept invariant, its position will be ordering up. According to the type 1, signal through random sort, its power remains unchanged. The first random noise of IMF compo-nent by EMD decomposition can still keep the random properties of approximation. However, power is obtained the first IMF component random sort the number which is after “random sort of cumulative average reconstruc-tion” is inversely proportional, namely power decreases with the increase of random sort. as shown in Figure 1. Therefore, the noise energy can be reduced through the signal with noise is decomposed imfi “EMD of random scheduling and cumulative average”.
3.2. The Statistical Properties of the Random Noise from the Autocorrelation Function
The random signal of the autocorrelation function is defined as:
(
1,2)
( ) ( )
1 2 XR t t = E x t x t (1)
Here the use of normalized autocorrelation function to represent the the correlation degree of random signal in different time values. That is:
( )
( )
0 X X R R τ τρ = (3)
In the formula, τ = −t1 t2
Although the normalized autocorrelation function of the random noise and signal get maximum value at zero, but the point of the time difference outside zero have following difference:
The random noise from the autocorrelation function have the maximum value at zero point. at the other point, the autocorrelation function decays rapidly decrease small on the contrary. but the general signal autocorrelation function does not have such a characteristic. According to the difference of random noise and general signal au-tocorrelation function can accurately judge the signal-to-noise cutoff point between the dominant mode of K.
3.3. Denoising Algorithm of Constructing EMD
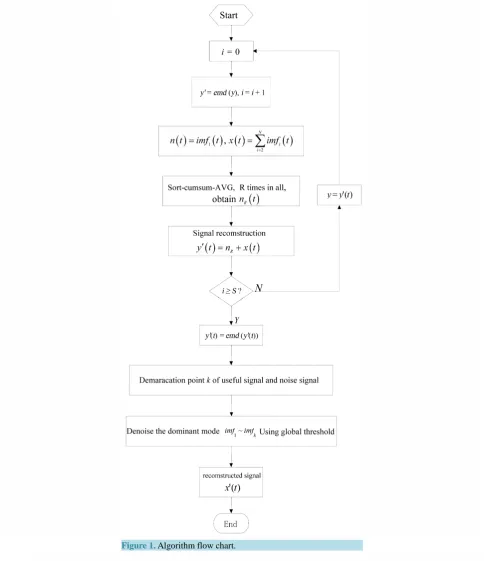
According to the two points of the statistical characteristics to random noise the above, the construction of a new denoising method-EMD denoising method based on the noise statistical characteristics [4]-[6], the specific steps are as follows in Figure 1.
1) After the signal with noise is decomposed by EMD, the N of intrinsic mode components in IMF were got. the decomposed the last trend component is recorded as the first N IMF.
2) Record
( )
1( ) ( )
( )
( )
( )
2
, ,
N
i cumulate i
n t imf t x t imf t n t n t
=
Figure 1. Algorithm flow chart.
3) A new component is obtained after the random ordering, and the cumulative,
( )
( ) 1( )
cumulate cumulate
recordn t =n t +n t
4) Repeat step 3 R times, a new power weakened noise dominant mode was got after calculated accumulation
average. record
( )
( )
1 cumulate Rn t
n t R =
5) Get a new SNR signal with noise is improved from the reconstruction. Record y t′
( )
=nR( ) ( )
t +x t6) Received signal after inhibition will be regarded as the noise repeated S times steps after 1 - 5.
7) The EMD decomposition, calculate the autocorrelation function of N imf component, according to the characteristics of the autocorrelation function obtained signal-to-noise leading the dividing point between modes K
(8) Global threshold processing method selection to the dominant modal components of noise record
( )
(
( )
)
(
( )
)
( )
( )
sgn ,
0,
i i i i i
t i
i i
imf j imf j T imf j T
imf
imf j T
⋅ − >
′ =
≤
In the formula, Ti =σi 2 lnL as the components of the threshold, L is the length of the signal, σi is the standard deviation.
9) Obtain the signal after denoising, get the obtained and reconstructed.
3.4. Simulation Analysis
Signal denoising by using the statistical characteristic of noise in EMD based de-noising method respectively, which is obtained by the superposition of signal after Gauss white noise after the EMD decomposition, take the first IMF component is “random scheduling and cumulative average” R times, then with the other IMF compo-nent reconstruction, continue to repeat S times (), the noise power is weakened, improved SNR signal were got, as shown in Figure 2.
[image:4.595.194.402.369.447.2]On the EMD decomposition of IMF, calculation of the various components of the autocorrelation function x corr (imf), in Figure 3. According to the random noise of the autocorrelation function to the statistical proper-
Figure 2. Signal to noise ratio improvement after SNR.
Figure 3. Each component of the normalized
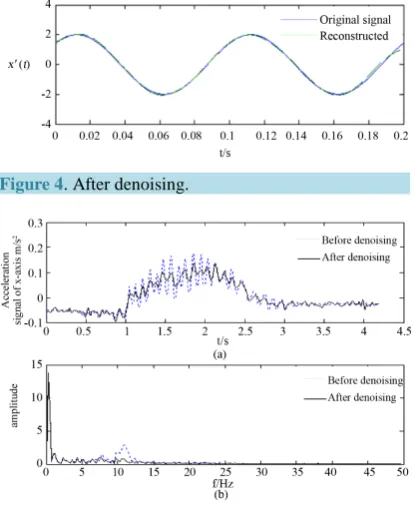
[image:4.595.198.400.473.698.2]ties, the signal-to-noise cutoff point can be determined. Therefore the global threshold selection method for de-noising is obtained, after reconstruction, the signal after dede-noising was got, as shown in Figure 4.
4. Experimental Verification
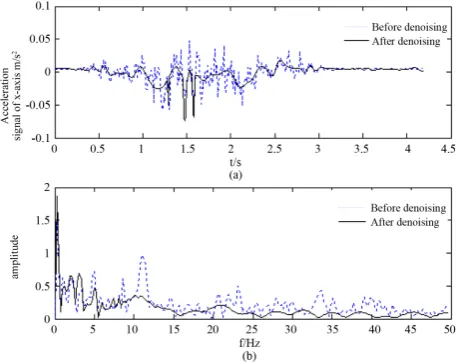
[image:5.595.195.403.236.491.2]In the experiment to test the car loaded with inertial measurement unit through a simulation of line section, col-lecting sensitive acceleration signal to trolley moving along X, Y, Z axis. First of all, using the method of mean filter DC quantity contained in the micro accelerometer signal. Using EMD de-noising method based on the sta-tistical characteristic of noise, the acceleration signal is on denoising processing after eliminating direct flow. And the waveform and frequency spectrum of signals before and after respectively were got as shown in Fig-ures 5-7. Above, denoising method based on noise statistical characteristics can remove random noise effec-tively from the acceleration signal.
[image:5.595.196.403.523.694.2]Figure 4. After denoising.
Figure 5. Waveform and frequency spectrum of X axis
acceleration signal before and after denoising.
Figure 6. Waveform and frequency spectrum of Y axis
Figure 7. Waveform and frequency spectrum of Z axis
accele-ration signal before and after denoising.
5. Conclusion
This article is on the correlation function of studying the statistical properties of random noise. EMD filtering method is proposed based on the statistical characteristics. Using this method the acceleration signal exported an inertial measurement unit to deal with denoising. The acceleration signal denoised is integral operated. Through the attitude matrix the motion of the information is converted from the carrier coordinates system to the geo-graphic coordinate system. The car trajectory can be got [7] [8]. Experiments show: EMD filtering method based on the statistical characteristics of the noise can remove the noise signal effectively. The requirements of detection accuracy can be met better.
Acknowledgements
The project is jointly supported by the Shanghai Tertiary Education Specialized Fund for Planning to Support Young Teacher’s Trainings (ZZGJD13072), National Natural Science Foundation of China (51478258), and the Shanghai Graduate Education Innovation Project in Layout and Construction Project (13sc002).
References
[1] Zheng, S.B., Lin, J.H. and Lin, G.B. (2007) Implementation of Detecting Maglev Track Long Wave Irregularity Based
on Inertial Measurement Principle. Journal of Electronic Measurement and Instrument, 21, 61-65.
[2] Huang, N.E., Shen, Z., Long, S.R.,Wu, M.C., Shih, H.H., Zheng, Q., et al. (1998) The Empirical Mode Decomposition and the Hilbert Spectrum for Nonlinear and Non-Stationary Time Series Analysis. Proceedings of the Royal Society of London A, 454, 56-78.
[3] Rilling, G. and Flandfin, P. (2008) One or Two Frequencies? The Empirical Mode Decomposition Answers. IEEE
Transactions on Signal Processing, 56, 85-96.http://dx.doi.org/10.1109/TSP.2007.906771
[4] Boudraa, A.-O. and Cexus, J.-C. (2007) EMD-Based Signal Filtering. IEEE Transactions on Instrumentation and
Measurement, 56, 2196-2202.http://dx.doi.org/10.1109/TIM.2007.907967
[5] Sun, J.-B., Zhu, Y.-L., Liu, L.-Q. and Huang, J.-C. (2010) Study on De-Noising Method Based on EMD Used in
Insu-lator Leakage Current. Journal of North China Electric Power University, 37, 1-5, 22.
[6] Wang, Z. (2010) Research on EMD Algorithm and Its Application in Signal Denoising. Harbin Engineering University,
34-36.
[7] Zhu, W.F., Chai, X.D., Zheng, S.B., Li, L.M. and Luo, Y.J. (2012) Developing IMU SignaI Acquisition and Processing
System Based on LabVIEW. Computer Measurement & Control, 20, 1697-1698, 1706.
[8] Liu, X.-C., Chai, X.D., Zheng, S.-B., Zhu, W.-F. and Jiang, Q.-Z. (2013) De-noising Method for Acceleration Signal