The University of San Francisco
USF Scholarship: a digital repository @ Gleeson Library |
Geschke Center
Master's Theses Theses, Dissertations, Capstones and Projects
Spring 5-9-2014
Impact of Natural Disaster Exposure on Prosocial
Preferences and Public Goods Provision: Evidence
from the Solomon Islands
Heather Belfor
[email protected]Follow this and additional works at:https://repository.usfca.edu/thes
Part of theBehavioral Economics Commons,Growth and Development Commons, and the Other Economics Commons
This Thesis is brought to you for free and open access by the Theses, Dissertations, Capstones and Projects at USF Scholarship: a digital repository @ Gleeson Library | Geschke Center. It has been accepted for inclusion in Master's Theses by an authorized administrator of USF Scholarship: a digital
repository @ Gleeson Library | Geschke Center. For more information, please [email protected].
Recommended Citation
Belfor, Heather, "Impact of Natural Disaster Exposure on Prosocial Preferences and Public Goods Provision: Evidence from the Solomon Islands" (2014).Master's Theses. 83.
Impact of Natural Disaster Exposure on Prosocial
Preferences and Public Goods Provision: Evidence from
the Solomon Islands
Key Words: Natural Disaster Exposure, Provision of Public Goods, Prosocial Preferences
! !
JEL Classifications: D7, H41, O12, Q54
Heather Belfor
Department of Economics University of San Francisco
2130 Fulton St. San Francisco, CA 94117
e-mail: [email protected]
May 2014
Abstract: Natural disaster exposure can impact prosocial preferences, which indicate the level of social capital, as well as create a shift in investments from public to private goods. Both are important mechanisms to study in order to create optimal climate change adaptation policies. This study evaluates the impact of natural disaster exposure on prosocial preferences and public goods provision in the evaluated communities. The data used in this research comes from a process evaluation that was carried out in the Solomon Islands on the Rural Development Program (RDP) and a Structured Community Activity (SCA) experiment, which took place in 80 villages where 20 people in each village were given money and had to decide how much to keep or contribute towards a community good. There is no significant relationship between disaster exposure and prosocial preferences, yet exposure to a natural disaster in the past year is found to significantly decrease contribution amounts towards public goods in the SCA. A theoretical model of public goods provision is used to explain how experiencing a shock increases the private return from keeping the money, and thereby, decreases the amount contributed towards public goods.
1. Introduction
Natural disasters have cost the global economy $2.5 trillion since 2000 (United Nations Office for Disaster Risk Reduction, 2013). The Intergovernmental Panel on Climate Change (IPCC) in their fourth assessment report state that “warming of the climate is unequivocal” and illustrates the increased likelihood of more severe and frequent natural disasters in the future (2007). Developing countries are arguably the most affected by natural disasters. In addition to suffering from higher national death counts, there are also systematic trade and development implications (Kahn, 2005). This has been associated with the importance of strong economic and political institutions in mitigating destruction and providing assistance for recovery (Noy, 2009). The Solomon Islands is a country lacking such strong institutions but which experiences frequent climatic and geologic disasters. 81 percent of the people in the Solomon Islands live in rural areas with weak infrastructure and rely on traditional knowledge about the environment (World Bank Report, 2010). As a result, it is important to understand the implications of disaster exposure on their society, as climate change is a
contemporary threat. Understanding the impact of exposure on micro-level factors, such as individual preferences and behaviors, is necessary in order to create optimal climate adaptation policies for developing communities.
Current studies demonstrate that natural disaster exposure alters trust and cooperation (Cassar et al., 2011) and changes the provision of public goods dynamics (Gangadharan and Nemes, 2009). The motivation for my research comes from a case study I conducted in the Solomon Islands that corroborates these findings, as I found preferences and behaviors shift due to perceived
changes in the environment. My research questions examine this by investigating to what extent natural disaster exposure impacts prosocial preferences and private provision of public goods. In this analysis prosocial preferences refer to trust, altruism, and reciprocity and are used to interpret the level of social capital in the communities. Social capital refers to the nature of connections and networks available to individuals in a society (Bourdeiu, 1986). Contribution amounts towards public goods from an experiment are used to evaluate collective-action and public goods provision
dynamics in the studied communities. To my knowledge, this is the first examination of the direct impact of self-reported disaster exposure indicators on actual contribution amounts given to real community projects.
the Rural Development Program (RDP). This CDD program emphasizes community control over planning decisions and resource investments. A Structured Community Activity (SCA) experiment was done to see how a CDD approach (control group) versus a voucher-enhanced system
(treatment group) influences community interaction and contributions towards community projects. The prosocial preference indicators, as well as the natural disaster exposure information, comes from surveys done at the individual and community level at each of these 80 villages.
This research indicates there is no economic or statistically significant relationship between natural disaster exposure and prosocial preferences except with two of the natural disaster exposure indicators and altruism. These findings challenge the behavioral economics and sociological
literature supporting evidence of natural disaster exposure shifting prosocial preferences after exposure. In addition, natural disaster exposure results in an economically and statistically significant 8 to 12 percentage point decrease in contribution amounts for four of the eight natural disaster indicators. These findings support the public goods literature finding a decreased rate of cooperation and public goods provision after natural disasters. I interpret these results in the context of a public goods provision model. I show that the provision of public goods decreases in response to natural disaster exposure because the private return from donating to the public good is less than the return from keeping the money, thereby increasing individual utility when money is kept for private use.
The following section presents a review of the relevant literature. In Section 3, I briefly discuss natural disasters in the Solomon Islands and some findings from my case study. Section 4 describes the methodology behind the design of the SCA, explains the data collection instruments, interprets the summary statistics, and discusses the model used to analyze the data. Next, Section 5 interprets the results and robustness checks. Lastly, the discussion in Section 6 ties my results to the literature, explains the public goods provision model created to explain the results and reveals limitations in my research.
2. Literature Review
2.1 Social Capital and Trust in the Context of Natural Disasters
that is highly correlated with other measures of social capital is the degree of societal trust. Social capital is a necessary element of economic transactions and has been linked to economic growth because increased levels of trust leads to the establishment of better public institutions (Gambetta, 1990). The ability to adapt to changes in the environment also relies on networks and social capital of groups, making trust important to future development after natural disasters strike (Geigler et al., 1996 and Adger, 2003). A spillover effect from disasters may be an increase in trust if the society has a decent amount of social capital to begin with. Toya and Skidmore (2012) found storm
frequency is correlated with larger amounts of trust in a high social capital society. Social capital and trust seem to play an important role in how well a society manages natural disasters.
Research regarding natural disasters and their impact on social capital is growing, yet there is still a lack of economic research relating natural disaster exposure to trust and other prosocial preferences, such as altruism and reciprocity. Current research supports the idea of natural disasters influencing individual perceptions and trust (Cameron and Shah, 2010). Cassar et al. (2011) found in their experimental study higher levels of trust in Thai villages affected by the 2004 tsunami, relative to villages not affected by the tsunami. There is also evidence suggesting disasters can increase cooperation (Solnit, 2009). My research contributes to this literature as it investigates the impact of disaster exposure on trust, reciprocity, and altruism.
2.2 Provision of Public Goods after Exposure to Natural Disasters
Public goods have been shown to be an indicator of strong institutions, and therefore, it is important to study the provision of public goods in order to learn how to establish such institutions that will lead to a good quality of life and environmental stability (United Nations Industrial
contributions at the individual level are perceived by community members to no longer help in sustaining a strong social alliance, a collapse of public goods provision may occur. If natural disaster exposure threatens the social alliance in the Solomon Island communities and community members are hesitant to contribute towards the provision of public goods, they may prefer to save their money for private investments.
Being exposed to a natural disaster may create fear, change perceptions of future disaster events, and even damage wealth, which all can potentially alter individual perceptions regarding risk and uncertainty. If this were to happen, then people may be more or less inclined to contribute towards a public good. Gustafsson et al. (2000) investigated this by comparing the voluntary contributions to public goods with the same expected provision threshold but with different variances in environmental uncertainty levels. Provision threshold in this literature refers to the proportion of endowments from a community that need to be made towards a public good in order for it to be established/ maintained. Overall, he found that the average contribution was smaller in the high variance group (more environmental uncertainty). Wit and Wilke (1998) investigated the impacts of environmental uncertainty and strategic uncertainty on contributions to public goods. Strategic uncertainty refers to unknown information about the decisions of others in a public goods setting causing coordination problems. These authors found lower contributions under high environmental uncertainty, with the most dramatic drop in contribution levels when high environmental uncertainty was coupled with high strategic uncertainty.
A study by Gangadharan and Nemes (2009) makes several contributions to this literature by examining risk, uncertainty and variability in public versus private goods in a public goods setting. They use an experimental setting to isolate strategic uncertainty from several forms of
2.3 Internal Motivations Behind Contributions
It is important to understand the internal motivations behind donating towards public goods in order to get a complete picture regarding public goods provision. The seminal work by Adreoni (1990) explains the psychological motivations behind contributing to charities and public goods. Adreoni (1988) demonstrates that the existence of organizations like the Red Cross and the Salvation Army are inconsistent with standard consumer theory, where the motivation to give is to receive something in return. His solution to this is the idea of ‘warm glow of giving,’ which is where people gain utility just from the act of giving and nothing else. He calls this model the impure altruism model and warns the conventional view of charitable giving is inaccurate and it is important to develop models accounting for this impure altruism. If the motivation to contribute towards the community goods in the SCA came from an internal motivation, then the level of altruism in the communities could be used as an explanation for the contribution results.
The model by Brekke et al. (2003) called the model of moral motivation, assumes people want to think of themselves as socially responsible. Individuals first determine their morally ideal effort by asking themselves what the consequences of social welfare would be if everyone in society acted as they did. Next, individuals want to maximize their utility by trading the benefits of maintaining a self-image as a socially responsible person against costs. Basically, a better self-image can only be obtained if one truly does what they believe is morally right. From this model, it predicts monetary incentives decrease morally motivated contributions, which is shared in Frey’s (1997) crowding theory. Frey’s theory argues that although external incentives such as fees increase economic incentives to contribute, they can reduce an individual’s intrinsic motivation. This can be used to explain why individuals may not have donated more towards the community projects in the SCA. The participants may have high levels of prosocial preferences that would normally increase their motivation to contribute. However, monetary incentives may have decreased their morally
3. Setting: Natural Disasters in the Solomon Islands
There are a total of nine provinces in the Solomon Islands containing about 500,000 people. Choiseul, Malaita, Temotu and Western provinces were involved in the process evaluation and experiment used in this research. These provinces have about 26,000, 120,000, 21,000, and 62,000 people respectively. 81% of the population in the Solomon Islands lives in rural areas, especially in those provinces (World Bank Report, 2010). Most of these people provide for their families through subsistence farming and fishing, with a small amount of trade. However, in Western Province there is a small, thriving tourist economy. Most of the technology, such as Internet, electricity, and phone, is in the provincial capital of each province, however, even that is minimal. Their main source of transportation are small motor powered fishing boats, except in Malaita and Western where there are some roads and vehicles potentially because these two provinces are larger and have more
inhabitants. As a result of the infrastructure and lifestyle, daily life is heavily influenced by weather. In the Solomon Islands the typical weather pattern consists of heavy and frequent rains from mid-December through mid-May because of monsoon winds from the west and northwest causing the wet season, consisting of higher temperatures, humidity, and rainfall. The rest of the year they experience southeasterly winds producing mild weather with lighter and less frequent rainfall.
A case study I conducted in Choiseul province in the summer of 2013 found strong evidence of people relying on traditional knowledge about weather, agriculture, and fishing (see Appendix C). A change in their environment that cannot be explained by this knowledge hurts their ability to survive and may impact long-term development. As part of my fieldwork I conducted interviews with members of each community I visited to discuss their perceptions of climate change. Most of these interviews revealed that they have been noticing changes in their environment over the past few decades, especially within the last 10 years. The most reported change was more frequent rain showers that are heavier in nature. These weather changes, as well as increased deforestation, have resulted in topsoil depletion and smaller-sized crops. Increased humidity from heavier rains throughout the year has caused an escalation in crop diseases and mold. In Choiseul and Malaita they also self-reported experiencing floods and landslides in the past year, possibly due to these heavier rains.
The people of Choiseul also expressed experiencing periods of drought with high
regions of Western, Choiseul, and Temotu are also very weary of earthquakes and tsunamis. Choiseul and Western experienced a massive tsunami in 2007 and Temotu in 2013. They also experienced earthquakes in 2010. There was evident concern over what to do if another incident were to occur.
From my interviews with the community members in the villages of Choiseul it seems as though they are cautious of environmental change, but have little understanding of what it means and how to adapt to the changes. Many community members are worried about the decisions made by the community. They have become wary of investment, in particular RDP funded infrastructure projects, because of the risk associated with it being destroyed by a climatic or geologic related event. Yet they feel as though they do not have the right tools to make the least risky decisions.
Understanding how these disasters impact their behaviors and preferences is key in order to create effective climate adaptation policies that will better equip them to withstand the future impacts of climate change.
4. Methodology
During the summer of 2013, a group of researchers from multiple universities traveled to the Solomon Islands to conduct a process evaluation of the Rural Development Program (RDP).
Communities were selected at random for the evaluation from a set of communities that participated in the RDP pilot program. These communities were involved in the first three cycles of the
program, which took place in four of the nine provinces in the Solomon Islands. As part of this evaluation, a Structured Community Activity (SCA) and three different types of surveys were conducted in 80 communities.
4.1 Empirical Design
The community driven development (CDD) process is a fundamental part of the RDP, which involves giving an allotted amount of money for a community project, where as a community they decide the project, implement it, and maintain it. One of the main goals of the RDP was to increase involvement by marginalized groups and women in the decision-making and
implementation process as a way of encouraging empowerment. Another goal was to bring public goods to the communities that were truly needed. The SCA conducted in each of the 80
collective-action and participation by marginalized groups. The SCA is designed to measure how communities respond to real-world situations in areas where the CDD project had sought to change behavior.
Before entering the field, communities were chosen at random to be in either the control or treatment group, with 40 communities in each group and a total of 1,555 individuals taking part in the SCA experiments. Upon arrival into each community, a meeting was called where we read a script aloud describing who we were and why we were there. During this time, we asked those attending to write their names on a piece of paper. Female and male names were put into two separate bags and a younger volunteer from the community picked out 9 from each to take part in the SCA. 18 individuals were chosen at random to take part in the experiment, along with one male and one female leader, resulting in 20 subjects per experiment.
The control subjects, groups of 20 experimental participants, were given a block grant of SI (Solomon Island dollars) $2,000, which is about USD $275. Just like in the RDP projects, the control group had an allotted block grant and the subjects had power over planning decisions and resource investments. In the treatment group, every subject was instead given 10 vouchers worth SI $5 each for a total of SI $50 (about USD $7). The treatment groups were informed that they could use this to help fund a community project of their choice or to be redeemed individually for cash. They were also told that any individual contribution towards the community project would be doubled. From a game theoretic approach, it is in the best interest for everyone in the treatment group to donate towards the community project, as this will result in a community contribution of SI $2000. However, if everyone keeps at least some of his or her vouchers, the overall total amount will always be lower. The purpose of this activity is twofold. One is to see how they make decisions, and two, to assess the dynamics within the communities through this voucher-enhanced approach.
project decisions were made. This information helps in deciphering the dynamics of the community. At the end of their discussion a verdict on the project needed to be made, including who would pick up the materials at the hardware store, which hardware store they wanted to use, and other details about their decision. They were made aware that in around three months time, researchers were going to come back to check on the progress of their projects.
This exercise captures the degree to which experience of project management under RDP and being involved in the process has enhanced the capacity of villagers to act collectively and take up a development project outside of the sphere of the RDP project.
4.2 Data Sources
There are three key data sources:
(i) Individual survey: The individual surveys were given to the 20 participants in each
community that took part in the SCA. The resulting sample, after accounting for people leaving the experiment or not showing up, consists of 1,520 individuals (772 males, 748 women). This survey was conducted as an exit questionnaire after the experiment was completed and contained 40 questions. Most of the control variables used in this research come from this survey, along with the prosocial preference indicators on trust, reciprocity, and altruism. These prosocial preferences were elicited from situational questions asking the participants to rank from 0 to 10 what they would do in each given situation.
(ii) Community survey: There was a community leader survey that was implemented through a focus group after the SCA was conducted in each of the 80 communities to answer questions about issues affecting the community as a whole. Typically, the one male and female community leader from the experiment, as well as the community chief, members of the RDP’s sub-project
implementation committee (SIC), and a couple other leaders were present. The aim of this survey was to analyze the RDP process. This questionnaire included 134 questions in which the subjects had to respond yes/no or give a specific answer as a group. This is the source of the disaster indicator variables. These questions asked the leaders to indicate if their village had experienced any one of the following natural disasters in the past year: drought, earthquake, flood, typhoon,
landslide, tsunami, high rains, or a volcanic eruption.
survey is 765. This survey may provide some interesting results, however, data from this survey will not be used in this analysis.
4.3 Data Description
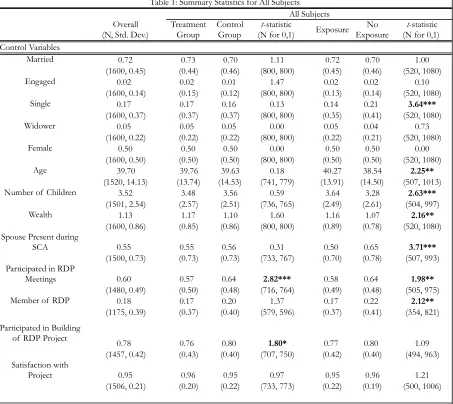
Table 1 presents the summary statistics on key variables used in this research. The overall sample mean for the control variables show on average the most frequent marital status is married, average age is about 40 years old, and average number of children is between 3 and 4. The average overall wealth is close to 1, meaning most people own at least one of the three indicators in the wealth index (motor, mobile, and radio). The RDP indicators are included in the regression analysis of contribution amounts, as involvement in the RDP may influence contributions towards other community projects. On average, most people participated in the building of the RDP project, around half participated in the RDP meetings, and a small amount of the subjects were actually members in the RDP. Satisfaction of project variable is included as a control because satisfaction with the SCA project chosen may influence the contribution amounts in the activity. The mean shows SCA project satisfaction was generally high.
Table 1 also describes the difference in means between the treatment and control groups for all of the subjects. There are only two control variables, participating in RDP meetings and participating in the building of RDP projects, which are significantly different between the groups. The variables with significant differences in means between these groups reflect the random heterogeneity in this sample that could not be controlled for through the study design. There would be no way to control for these differences without intervening in the selection of the participants, which ideally are as random as possible. To control for the potential bias between the groups, I made sure to include the variables exhibiting significant difference in means in my analysis.
differences may be a consequence of exposure to natural disasters, which will be dissected further in the results section.
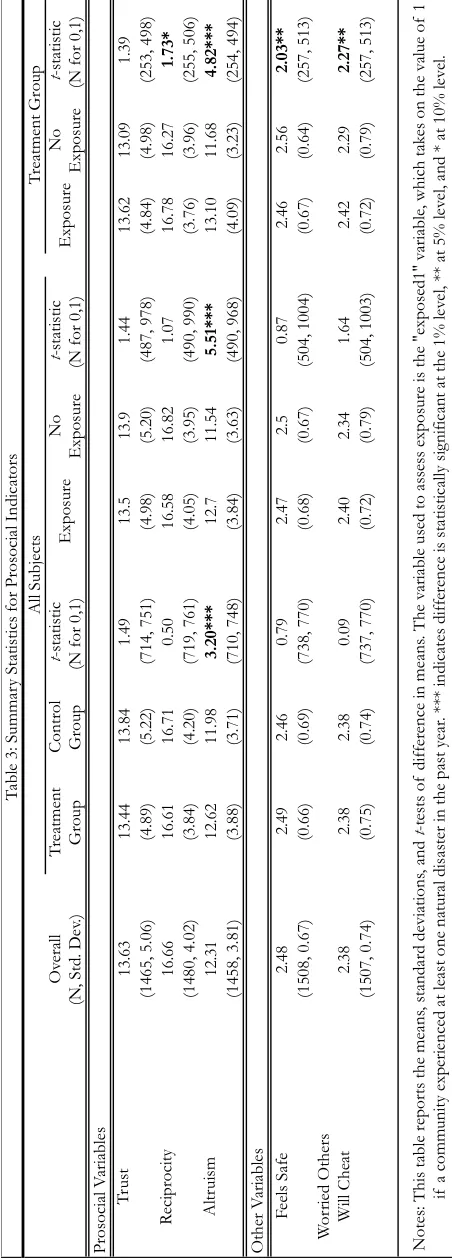
Outcomes of interest are displayed in Table 3 (see Appendix A). When looking at the means in the table for the prosocial preferences separated by exposure for all subjects, it would seem as though subjects who were not exposed to a natural disaster exhibit higher levels of trust, reciprocity, and altruism. However, within the treatment group this is not the case, as this relationship is
reversed for trust and reciprocity. It is interesting to note that on average the subjects displayed mid
Overall (N, Std. Dev.)
Treatment Group
Control Group
t-statistic
(N for 0,1) Exposure
No Exposure
t-statistic
(N for 0,1) Control Variables
Married 0.72 0.73 0.70 1.11 0.72 0.70 1.00
(1600, 0.45) (0.44) (0.46) (800, 800) (0.45) (0.46) (520, 1080)
Engaged 0.02 0.02 0.01 1.47 0.02 0.02 0.10
(1600, 0.14) (0.15) (0.12) (800, 800) (0.13) (0.14) (520, 1080)
Single 0.17 0.17 0.16 0.13 0.14 0.21 3.64***
(1600, 0.37) (0.37) (0.37) (800, 800) (0.35) (0.41) (520, 1080)
Widower 0.05 0.05 0.05 0.00 0.05 0.04 0.73
(1600, 0.22) (0.22) (0.22) (800, 800) (0.22) (0.21) (520, 1080)
Female 0.50 0.50 0.50 0.00 0.50 0.50 0.00
(1600, 0.50) (0.50) (0.50) (800, 800) (0.50) (0.50) (520, 1080)
Age 39.70 39.76 39.63 0.18 40.27 38.54 2.25**
(1520, 14.13) (13.74) (14.53) (741, 779) (13.91) (14.50) (507, 1013)
Number of Children 3.52 3.48 3.56 0.59 3.64 3.28 2.63***
(1501, 2.54) (2.57) (2.51) (736, 765) (2.49) (2.61) (504, 997)
Wealth 1.13 1.17 1.10 1.60 1.16 1.07 2.16**
(1600, 0.86) (0.85) (0.86) (800, 800) (0.89) (0.78) (520, 1080)
Spouse Present during
SCA 0.55 0.55 0.56 0.31 0.50 0.65 3.71***
(1500, 0.73) (0.73) (0.73) (733, 767) (0.70) (0.78) (507, 993)
Participated in RDP
Meetings 0.60 0.57 0.64 2.82*** 0.58 0.64 1.98**
(1480, 0.49) (0.50) (0.48) (716, 764) (0.49) (0.48) (505, 975)
Member of RDP 0.18 0.17 0.20 1.37 0.17 0.22 2.12**
(1175, 0.39) (0.37) (0.40) (579, 596) (0.37) (0.41) (354, 821)
Participated in Building
of RDP Project 0.78 0.76 0.80 1.80* 0.77 0.80 1.09
(1457, 0.42) (0.43) (0.40) (707, 750) (0.42) (0.40) (494, 963)
Satisfaction with
Project 0.95 0.96 0.95 0.97 0.95 0.96 1.21
(1506, 0.21) (0.20) (0.22) (733, 773) (0.22) (0.19) (500, 1006)
All Subjects
Notes: This table reports the means, standard deviations, and t-tests of difference in means. The variable used to assess exposure is
the "exposed1" variable, which takes on the value of 1 if a community experienced at least one natural disaster in the past year. *** indicates difference is statistically significant at the 1% level, ** at 5% level, and * at 10% level.
to upper-levels of trust, reciprocity and altruism, despite being concerned about safety in their village and worried others will cheat or steal.
4.4 Identification Strategy and Model
The Solomon Islands are located in the Pacific Ocean in an area frequently hit by typhoons and heavy rains from mid-December through mid-May, occasionally causing floods and landslides. They also experience droughts, especially more frequently due to the change in weather patterns they have been experiencing. Since the Solomon Islands are composed of islands, earthquakes and tsunamis are also fairly frequent, along with occasional volcanic eruptions. No typhoons or
volcanoes were reported, and therefore, will not be included in the following analysis. These natural disasters hit the Solomon Islands every year, each different in size and intensity and impacting different regions of the islands. Table 4 and Graph 1 illustrate the types and frequencies of natural disasters, and reflect the strong variance across provinces. This variation is necessary in order to compare outcomes across groups.
Province Drought Earthquake Flood Typhoon Landslide Tsunami High Rains Volcano Exposed1 Exposed2
Choiseul 8 6 8 0 2 4 3 0 15 9
Malaita 1 0 1 0 3 2 7 0 12 1
Temotu 0 1 0 0 0 1 11 0 11 1
Western 3 3 0 0 0 0 14 0 16 6
Total 12 10 9 0 5 7 35 0 54 17
Table 4: Frequency of Disasters by Province
Note: This table reports the frequency of natural disasters by Province. This data is at the village level. The exposed1 variable indicates if a village experienced at least one natural disaster in the past year, and the exposed2 variable indicates if a village experienced at least two natural disasters in the
past year.
0" 2" 4" 6" 8" 10" 12" 14" 16"
Drought" Earthquake" Flood" Landslide" Tsunami" High"Rains"
Graph 1: Natural Disaster Types and Frequency
To estimate the impact of exposure to these events on prosocial preferences and contribution amounts in the SCA, I use a standard Ordinary Least Squares (OLS) model and estimate the following model:
!! =!!+!!!!+!!!!+!! +!!
Where !! are the dependent variables, either prosocial preference (trust, reciprocity, or
altruism) or contribution amount in the SCA for individual i; !! is the disaster indicator (drought,
earthquake, flood, landslide, tsunami, highrain, exposed1, or exposed2) used individually in separate regressions to analyze the distinct impacts of each indicator. The exposure variables indicate if these individuals were exposed to at least one or two of the six natural disasters in the past year. !! is the
vector of control variables, !!!is province-level fixed effects used to account for time-invariant
province level characteristics and !! is an individual-specific error term. Standard errors are clustered
at the community level to account for similarities within communities, creating 80 clusters. The natural disaster indicators only refer to the past year of exposure, so conclusions regarding impacts of shocks on social capital and donations to public goods are measuring short-term responses.
Though some would consider natural disasters to be exogenous, there is reason to believe that observed and unobserved characteristics of households may affect exposure to such disasters, thereby raising the concern for endogeneity. Characteristics that cannot be controlled for may influence the level of exposure to natural disasters. For example, observable factors, such as wealth, occupation or family, may push some people to live in certain areas and types of dwellings versus others, possibly making the populations exposed more to natural disasters systematically different from those who are exposed less. However, in this case it is of less concern because these people all live in fairly homogeneous dwellings, tend to live close to kin making migration uncommon, and 92% of the sample lives in coastal villages. In addition, I am including province level fixed effects to soak up all such unobservable differences across provinces.
In order for this model to be identified the conditional independence assumption must hold. This would be violated, for example, if actual exposure and response to the disaster variable
5. Results
5.1 Natural Disaster Exposure and Prosocial Preferences
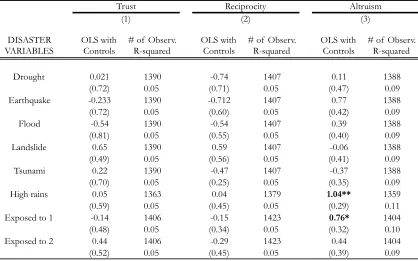
First I test whether exposure influences prosocial preferences. Also, Table 7 in this analysis shows OLS regressions with controls, province level fixed effects, clustered standard errors at the village level, and reports significance using the Holm-Bonferroni correction. Since I am regressing each natural disaster indicator separately to see the individual impacts of each, this correction controls for a possible familywise error rate, which is the probability of making one or more type 1 errors among all the hypotheses. All three prosocial preferences, trust, reciprocity and altruism, cannot be included in the same regression because of endogeneity concerns, and hence, the hypotheses and analytical tests must be separated. The outcomes used in this analysis are an
aggregate of the two indicators gathered for each prosocial preference, and therefore, are on a scale of 0 to 20.
(i) Trust: Table 7 shows no economic or statistical significance of disaster exposure on trust for all of the indicators. When looking at Table 3 it seems as though trust is slightly higher when not exposed to natural disasters, yet this difference is not significant (see Appendix A). Given this evidence, I cannot reject the null hypothesis and must conclude natural disaster exposure has no significant effect on trust amongst the community members in the SCA.
(ii) Reciprocity: Table 7 illustrates no significance of exposure on reciprocity. Table 3 shows reciprocity is slightly higher on average for individuals not exposed, but again, this difference is not significant. Therefore, I cannot reject the null hypothesis and infer disaster exposure has no
significant effect on reciprocity.
(iii) Altruism: Table 7 portrays a different story about altruism compared to the other prosocial indicators. There are two disaster indicators, high rains and exposed1, which show significant effects at the 5% and 10% significance levels respectively. These two indicators positively impact altruism by about 1 percentage point. When looking at Table 3 the average level of altruism is significantly higher in the group not exposed to a disaster compared to those who were. To see what may be driving these results, I run a regression after removing high rains as a disaster for the exposed1
hypothesis of no effect of exposure on altruism at the 5% significance level except with the high rains
indicator.
However, it is hard to establish inference from the altruism indicator because it lacks credibility regarding how this related question was asked in the survey. Each prosocial indicator involved two questions that were asked sequentially. The altruism2 indicator was elicited on the opposite scale as all of the other prosocial questions and when it is re-scaled it reveals a different distribution compared to altruism1 and the other prosocial indicators as seen in Graphs 6 through 11 (see Appendix B). Therefore, this indicates a poorly worded question or confusion among the respondents.
There are an additional two indicators from the individual survey reporting if the participants from the SCA feel safe in their community and if they are worried others may cheat or steal from them. The perception of safety in a society can be used as a proxy for the level of social capital.
DISASTER
VARIABLES OLS with Controls # of Observ. R-squared OLS with Controls # of Observ. R-squared OLS with Controls # of Observ. R-squared
Drought 0.021 1390 -0.74 1407 0.11 1388
(0.72) 0.05 (0.71) 0.05 (0.47) 0.09
Earthquake -0.233 1390 -0.712 1407 0.77 1388
(0.72) 0.05 (0.60) 0.05 (0.42) 0.09
Flood -0.54 1390 -0.54 1407 0.39 1388
(0.81) 0.05 (0.55) 0.05 (0.40) 0.09
Landslide 0.65 1390 0.59 1407 -0.06 1388
(0.49) 0.05 (0.56) 0.05 (0.41) 0.09
Tsunami 0.22 1390 -0.47 1407 -0.37 1388
(0.70) 0.05 (0.25) 0.05 (0.35) 0.09
High rains 0.05 1363 0.04 1379 1.04** 1359
(0.59) 0.05 (0.45) 0.05 (0.29) 0.11
Exposed to 1 -0.14 1406 -0.15 1423 0.76* 1404
(0.48) 0.05 (0.34) 0.05 (0.32) 0.10
Exposed to 2 0.44 1406 -0.29 1423 0.44 1404
(0.52) 0.05 (0.45) 0.05 (0.39) 0.09
Table 7: Weather Indicator Regression Results for Prosocial Preference Outcome Variables (OLS Estimations)
Trust Reciprocity Altruism
Note: Each of these indicators were run separately in a regression with the prosocial preferences as the outcome. Individual controls are not included in this table. These controls are: Marital Status dummies, Female dummy,
Age, Number of Children, and Wealth. Age shows significance in all of the regressions listed in column 1. Number of children shows significance in all of the regressions in column 2. None of the control variables show
significance in any of the regressions in column 3. Fixed effects are used along with clustered standard errors at the village level. Robust standard errors are in parentheses. *** indicates statistical significance at 1% level, ** at
5% level, and * at 10% level and are adjusted with the Holm-Bonferroni correction.
Social capital is thought to be deeply rooted in a society and is formed as a response to the environment (Toya and Skidmore, 2012). Since disaster exposure does not influence the prosocial preferences tested above, possibly because they have formed in response to frequent exposure, then disasters should not have an effect on other indicators of social capital. As shown in Table 8, I run OLS estimations as a robustness check and find no significant effect of any of the disaster indicators on feeling safe or worried others will cheat or steal (see Appendix A). Disaster exposure appears to not be influencing indicators relating to social capital. Therefore, respondents’ decision to donate less towards a public good when exposed to a natural disaster is more likely motivated by dynamics involving public goods provision and not because the level of social capital has shifted.
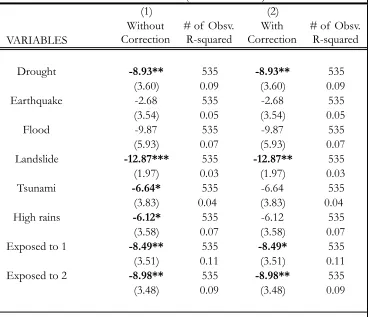
5.2 Natural Disaster Exposure and Contribution Amounts
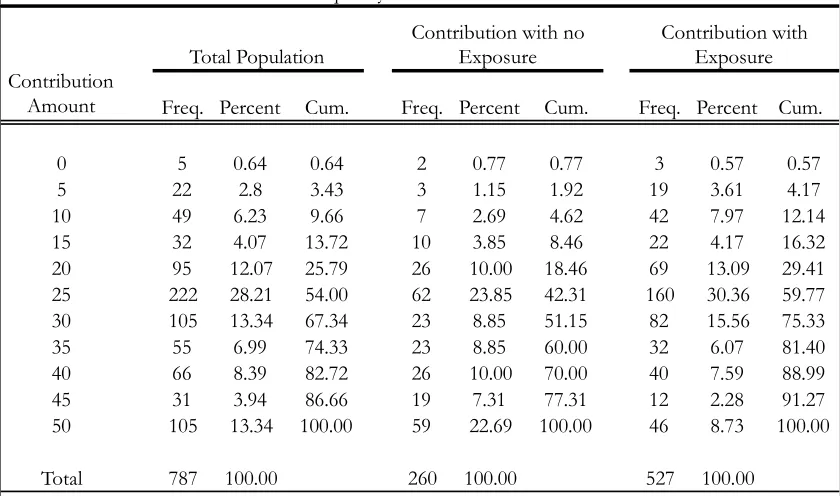
These findings indicate disaster exposure significantly influences public goods provision in the SCA in these communities. Table 6 indicates about 75% of all individuals gave half or more of their voucher money towards the community good (see Appendix A). This table also shows the contribution amounts of individuals exposed to natural disasters compared to those who were not. About 82% of the individuals who were not exposed to a natural disaster donated half or more of their vouchers towards the community good, where about 70% donated half or more when exposed.
(1) (2)
VARIABLES
Without Correction
# of Obsv. R-squared
With Correction
# of Obsv. R-squared
Drought -8.93** 535 -8.93** 535
(3.60) 0.09 (3.60) 0.09
Earthquake -2.68 535 -2.68 535
(3.54) 0.05 (3.54) 0.05
Flood -9.87 535 -9.87 535
(5.93) 0.07 (5.93) 0.07
Landslide -12.87*** 535 -12.87** 535
(1.97) 0.03 (1.97) 0.03
Tsunami -6.64* 535 -6.64 535
(3.83) 0.04 (3.83) 0.04
High rains -6.12* 535 -6.12 535
(3.58) 0.07 (3.58) 0.07
Exposed to 1 -8.49** 535 -8.49* 535
(3.51) 0.11 (3.51) 0.11
Exposed to 2 -8.98** 535 -8.98** 535
(3.48) 0.09 (3.48) 0.09
Table 5: Disaster Indicator Regression Results for Contribution Amount Outcome Variable (OLS Estimation)
Note: Each of these indicators were run separately in a regression with Contribution Amount as the outcome. Individual controls are not included in
this table. These controls are: Marital Status dummies, Female dummy, Age, Number of Children, Wealth, Satisfaction with SCA project, Spouse Present during SCA, Member of RDP, Participated in RDP meetings and Participated in
RDP building process. None of these controls show significance in any of the regressions. Standard errors are clustered at the village level and are in parentheses. *** indicates statistical significance at 1% level, ** at 5% level, and
40% of those not exposed donated 40 or more, compared to 19% of those exposed. These results demonstrate that exposure to natural disasters reduces the amount individuals contribute to public goods.
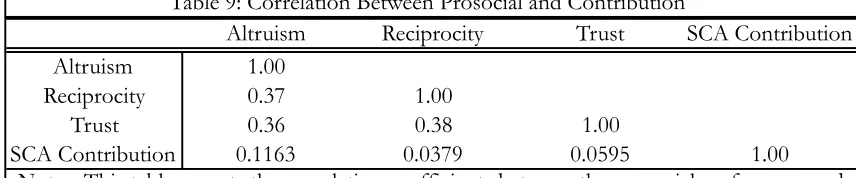
5.3 Relationship between Prosocial Preferences and Contribution Amounts
To assess what is driving the results behind natural disaster exposure impacting contribution amounts, I cannot run a regression including both contribution amounts and prosocial preferences because of endogeneity concerns. Both prosocial preferences and contribution amounts in the SCA could be correlated with omitted variables. For example, education could influence both and is not an observed variable that can be controlled for in the regressions. Instead I run a basic correlation between the two outcomes, although there still may be endogeneity coming from uncontrolled confounding variables. Table 9 has the results, and from this it is clear the correlation between contribution amounts and prosocial preferences are not strong. As a result, this further illustrates why a social capital framework should not be used to explain the results of a significant and negative impact of natural disaster exposure on contribution amounts.
5.4 Robustness Checks with Alternative Models
While OLS is my preferred estimation procedure, I explore alternative approaches as a robustness check. An ordered logit uses the same assumptions as the OLS model yet the dependent variable is ranked ordinally. Both the prosocial preference indicators and the SCA contributions variable are categorical and arranged in a meaningful way. In both cases an incremental increase in value means each individual either donates more or has higher levels of trust, reciprocity, and altruism. When I use an ordered logit I find similar results for all three prosocial preference
indicators as with the OLS where high rains is the only disaster indicator showing significance with
Altruism Reciprocity Trust SCA Contribution
Altruism 1.00
Reciprocity 0.37 1.00
Trust 0.36 0.38 1.00
SCA Contribution 0.1163 0.0379 0.0595 1.00
Notes: This table reports the correlation coefficients between the prosocial preferences and SCA contribution amount.
altruism at the 5% significance level. Also, this model shows similar results where there is a significant and negative effect of disaster exposure on SCA contribution amounts for four of the disaster indicators at the 5% or 10% significance levels. Results for both are in Tables 10 and 11 (see Appendix A). However, an ordered logit only applies to data that meet the proportional odds assumption. This assumption means that the coefficients describing the relationship between any two pairs of outcome groups are statistically the same. In my case, when the proportional odds assumption is tested, it does not hold for any of the regressions; the practical implications of violating this assumption are minimal (Williams, 2013 and Long and Freese, 2006). Other models may be used to correct for this issue, such as a multinomial logit, dichotomizing the outcome for use in a binary logit, or using a generalized ordered logit. However, these cannot be performed because they either violate key assumptions related to the data or may alter conclusions in a substantive way.
A tobit model can be used as an alternative method when analyzing the prosocial preferences. Looking at the histograms for all three prosocial preference indicators, as seen in Graphs 2, 3, and 4, there are far more people exhibiting high levels of each indicator than one would expect by looking at the distribution (see Appendix B). Thus, this indicates a possible censoring issue. This is not the case with the SCA contribution amounts, which can be seen in Graph 5 (see Appendix B), and therefore, this model will not be used for analyzing this dependent variable. This model is represented in Table 12 and resulted in similar results as the OLS estimations for the prosocial preferences (see Appendix A). The only significant difference between this model and the OLS is the tsunami indicator, which now shows a significant and negative result on reciprocity at the 5% significance level. Also, the high rains indicator now shows significance at the 1% level.
However, despite these differences, the results from both the ordered logit and tobit models suggest my findings are robust.
6. Discussion
6.1 Findings in Relationship to the Literature
The intention of collecting data on prosocial preferences was to gather evidence on the level of social capital in these communities. This information contributes to the understanding of
exposure, these results tell us the level of social capital overall is not being influenced by exogenous shocks from the environment. This evidence refutes current research supporting the idea of natural disasters influencing prosocial preferences (Cameron and Shah, 2010). Most of the research
investigating the relationship between prosocial preferences and natural disasters observe higher levels of prosocial preferences in areas affected by natural disasters compared to those not exposed (Cassar et al., 2011). It is important to keep in mind that I may find no significance in my data as a result of having an indicator that only picks up on natural disaster exposure within the past year.
One of the main purposes of conducting the SCA experiment was to assess collective action and contribution towards community projects. The results show a significant and negative effect of natural disaster exposure on contribution amounts. From these results, it can be inferred that if there was less exposure to natural disasters in the Solomon Islands there may be higher contribution amounts towards community goods. These findings contradict some of the behavioral literature, which suggests natural disaster exposure increases collective action, and therefore, should increase contributions to public goods (Solnit, 2009). However, these results also strengthen the conclusions in the public goods provision literature that have linked natural disasters with reduced rates of intensity in cooperative behavior tested through donations towards public versus private goods (Au, 2004).
6.2 Explaining Contributions with a Public Goods Provision Model
To interpret these results I use a public goods provision model based on Gangadharan and Nemes (2009) to explain the significant decrease in contributions as a response to disaster exposure. As described in the literature review, they use an experimental setting to isolate several forms of environmental risk and uncertainty using known (risk), unknown (uncertainty), and endogenous (incentives treatments) probabilities. Subjects always face some type of strategic uncertainty (group size, communication, incentives to contribute) with public goods, and when environmental
Uncertainty is something people try to avoid at all costs. Subjects in experiments have been willing to pay to avoid uncertainty in favor of risk (Rapport and Suleiman, 1988 and 1992).
Distinct from this literature, I propose a different mechanism to explain smaller contribution amounts to public goods post disaster. Similar to Gangadharan and Nemes (2009), I highlight individual utility and return between keeping money and contributing towards public goods after disaster exposure. However, instead of relating individual utility and return to uncertainty and risk it is explained by the importance of recovering from private losses first before contributing to public goods.
My model is specified in the following manner:
!! ! !!(!)!(1−!!) +!! !!(!)!! =Individual!Utility!Function
!=Individual!Return!to!Keeping!Money!from!SCA
!!=Individual!Contribution!to!Public!Good!in!SCA!
!=Exogenous!Disaster!Shocks!
!=Individual!Return!from!Giving!to!Public!Good
!=2 (!") !
!!!
=Total!Contribution!to!Public!Good
!∈ !!!,!!! :Contributions!are!low!or!high!amounts
!!∈ !!!,!!! :!Disaster!shocks!are!low!or!high!
The utility function above is representing the total individual utility for every individual when establishing contributions towards a public good. The !! is an additively separable function of f and
g, which represents the utility from giving to the private versus public good. S represents exogenous shocks from natural disasters. G represents the total amount of contributions to the public good in the SCA, which is equal to double of the total amount of contributions from all individuals. Each individual also receives a private return or benefit from keeping the money, as described by !, as well as a return from giving to the public good, represented as !.
By assumption !′!is larger than !′!. This is because people exposed to natural disasters
suffer private losses, so it is more important for them to recover from their private losses first before contributing to public goods. Thus, the utility from keeping the money when exposed to high environmental shocks is larger than when exposed to low environmental shocks, as described by:
!! ! !!(1−!! ,!! > !! ! !!(1−!! ,!! . Therefore, experiencing a shock !! would lead to !! as
As seen in my data, disaster exposure significantly decreases the amount individuals give to the public good in the SCA by about eight percentage points. There are no other indicators that show significance in relationship to contribution amounts. Therefore, given the available data, the model I have created illustrates that individuals in communities exposed to a natural disaster in the past year donate less in the SCA because the exogenous shocks from the environment decrease the private return to donating towards a public good.
There could be many different reasons why this is the case. One possible explanation is uncertainty levels and risks are increased when there is exposure to natural disasters, thereby
decreasing confidence in making contributions towards public goods investments. Another possible explanation is that households have formed beliefs about future shocks in response to their past exposure and are donating less when exposed because of these beliefs. However, both of these explanations are beyond the scope of my study.
6.3 Limitations of Research
There is some concern regarding the accuracy of the findings related to natural disaster exposure and prosocial indicators. The prosocial questions may have been hard to interpret for some of the individuals taking the survey because these indicators were elicited using fairly
complicated situational questions. There is also some doubt regarding if the disaster indicators pick up the true impact of exposure on prosocial preferences since these indicators are only based on the past year of exposure. These indicators were based on questions asked to a group of individuals and were not based on actual weather data, therefore, recalling disaster exposure for more than a year ago would lead to biased results. In the literature prosocial preferences have been found to be stable over time in a society as they are deeply routed in culture (Bjørnskov, 2006). Social capital is also a reflection of the environment subjects are in (Toya and Skidmore, 2012). If these individuals have experienced natural disasters fairly frequently over the years, their prosocial preferences may have developed in response to this frequency. Therefore, this analysis may not show the true impact of natural disaster exposure on prosocial preferences within a year time frame.
Other potential areas of weakness come from the natural disaster indicators and how they were elicited in the study. Since the natural disaster questions were asked in the community survey this could cause potential bias because these self-reported measures were gathered from about five people in each community. It would have been better to collect the disaster indicators in the
village level would be desirable in order to absorb the unobserved differences across villages, but this was infeasible due to disaster variables varying only at the village level.
While my results suggest that individual utility related to contributing in the SCA is
negatively impacted when exposed to natural disasters, more data would have allowed investigation of different mechanisms to explain these results. Additional questions asking explicitly why they decided to donate more or less to the community projects in the SCA would have provided further explanation regarding their motivations behind contributing. Measurements on education would have added information that potentially could have influenced both contribution amounts and prosocial preferences. Including indicators in the study assessing uncertainty or risk from the environment also would have benefited the analysis of why exposure influences contribution amounts.
7. Conclusion
In this study, I have sought to understand the impact of natural disaster exposure on prosocial preferences and the provision of public goods. The motivation of this study is to investigate if social capital and public goods provision are influenced by exogenous shocks in the environment, and if they are, why this may happen. I find there are no economic or statistically significant relationships at the 5% and 10% significance levels between natural disaster exposure and prosocial preferences, except for two indicators with altruism. Robustness checks involving
alternative outcome variables as well as a couple different models yielded similar results. I also find there is an economically and statistically significant impact of natural disaster exposure on
contribution amounts for four of the disaster indicators at the 5% and 10% significance levels; these findings are robust to different model specifications.
appropriately explain the contribution results. Instead, I utilize a theoretical model on public goods provision to explain why exposure to natural disasters decreases public goods donations and increases the amount of money kept privately. From this model it can be inferred that individuals contribute less to public goods when exposed to natural disasters because they experience greater utility when keeping the money due to higher private returns. This is because when exposed to a natural disaster private losses are incurred that must be recovered from first before contributing to a public good. Although other mechanisms could be used to explain this relationship, they are outside the capacity of my research.
These are important findings for designing climate change adaptation policies. In the long run, if policy makers can increase contributions towards public goods, it may result in stronger institutions, and in return, they may endure natural disasters more successfully. However, further research is required to understand how people in the Solomon Islands recover from their losses over time. These people may be in a fairly regular state of recovery as a result of enduring frequent natural disasters from year to year. If this is the case, it is not surprising that they are not as willing to contribute to a public goods project when they need to make private investments in order to recoup from these disasters.
Additional research should explore how repeated exposure to bad shocks can impact
References
Acemoglu, Daron, and James A. Robinson. (2012). Why Nations Fail: The Origins of Power, Prosperity, and Poverty. New York: Crown Publishers.
Adger et al. (2005). “Social- Ecological Resilience to Coastal Disasters” Science, 309, pp. 1036-39.
Adger, Neil W. (2003). “Social Capital, Collective Action, and Adaptation to Climate Change”
Economic Geography, 79 (4), pp. 387-404.
Adreoni, James. (1990). "Impure Altruism and Donations to Public Goods: A Theory of Warm-Glow Giving" The Economic Journal, 100, pp. 464-477.
Au, W. (2004). ‘‘Criticality and Environmental Uncertainty in Step-Level Public Goods Dilemmas’’
Group Dynamics: Theory, Research, and Practice, 8, pp. 40–61.
Banerjee, Abhijit, et al. (2006). "Public Action for Public Goods."
Barro, Robert. "Are Government Bonds Net Wealth?" Journal of Political Economy, 88 (6).
Barro, Robert. (1990). "Government Spending in a Simple Model of Endogenous Growth" Journal of Political Economy, 98 (5), pp. 103-125.
Bjørnskov, C. (2006). "The Multiple Facets of Social Capital" European Journal of Political Economy, 22 (1), pp. 22-40.
Bourdeiu, P. (1986). Handbook of theory and research for the sociology of education. New York: Greenwood Press.
Brekke, K, S Kverndokk, and K Nyborg. (2003). "An Economic Model of Moral Motivation" Journal of Public Economics, 87 (9-10), pp. 1967-1983.
Cameron, Lisa, and Manisha Shah. (2010). "Do Natural Disasters Shape Risk Attitudes?" Working Paper.
Carter, Michael, et al. (2007). "Poverty Traps and Natural Disasters in Ethiopia and Honduras"
World Development, 35 (5), pp. 835-856.
Cassar, Alessandra, et al. (2011). "Trust, Risk, and Time Preferences After a Natural Disaster: Experimental Evidence from Thailand" Working Paper.
"Disaster Statistics." UNISDR. N.p., n.d. Web. 2 Dec. 2013. <http://www.unisdr.org/we/inform/disaster-statistics>.
Eckel, Catherine C., et al. (2009). "Rick Loving After the storm: a Bayesian- Network study of Hurricane Katrina Evacuees" Journal of Economic Behavior & Organization, 69, pp. 110-124.
589-611.
Fuchs, S., K. Heiss, and J. Huebl. (2007). "Towards an Empirical Vulnerability Function for Use in Debris Flow Risk Assessment" Natural Hazards Earth System Science, 7, pp. 495-506.
Gambetta, Diego. “Can We Trust?” Ch. 13 in Trust, Gambetta, Diego (ed). Blackwell.
Gangadharan, L, and V Nemes. (2009). "Experimental Analysis of Risk and Uncertainty in Provisioning Private and Public Goods" Economic Inquiry, 47 (1), pp. 146-164.
Gomanee, K, et al. (2003). "Aid, Pro-poor Government Spending and Welfare" 3 (3).
Gustafsson, M., A. Biel, and T. Garling. (2000). “Egoism Bias in Social Dilemmas with Resource Uncertainty” Group Processes and Intergroup Relations, 3, pp. 351–65.
Hirshleifer, Jack. (1983). "From Weakest-link to Best-shot: The Voluntary Provision of Public Goods" Public Choice, 41, pp. 371-386.
Isaac, Mark, and James Walker. (1988). "Group Size Effects in Public Goods Provision: The Voluntary Contributions Mechanism" The Quarterly Journal of Economics, pp. 179-199.
Kahn, Matthew E. (2005). “The Death Toll from Natural Disasters: The Role of Income Geography and Institutions” The Review of Economics and Statistics,87 (2), pp. 271–284.
Knack, S, and P. Keefer. (1997). "Does Social Capital Have an Economic Payoff?" Quarterly Journal of Economics, 112 (4), pp. 1251-1288.
Long, J. Scott and Jeremy Freese. (2006). Regression Models for Categorical Dependent Variables Using Stata. College Station, TX: Stata Press.
Messick, D. M., S. T. Allison, and C. D. Samuelson. (1988). ‘‘Framing and Communication Effects
on Group Members’ Responses to Environmental and Social Uncertainty’’ Applied Behavioral
Economics, 2, pp. 677–700.
Monteiro, Joana. (2009). "Resource Booms and Politics: The Effects of Oil Shocks on Public Goods and Elections."
Mosley, Paul. (2004). "Aid, Poverty Reduction and the 'New Conditionality'" The Economic Journal, 114 (496), pp. 217-243.
Nelson, Richard. (1956). "A Theory of the Low-level Equilibrium Trap in Underdeveloped Economies" American Economic Review, 46 (5), pp. 894-908.
Noy, Ilan. (2009)."The Macroeconomic Consequences of Disasters" Journal of Development Economics,
88, pp. 221-231.
Pachauri, R.K., and A Reisinger. (2007). "Fourth Assessment Report of the Intergovernmental Panel on Climate Change" Intergovernmental Panel on Climate Change.
"Public Goods for Economic Development." (2008). United Nations Industrial Development Organization.
Rapoport, A., D. V. Budescu, R. Suleiman, and E. Weg. (1992). ‘‘Social Dilemmas with Uniformly Distributed Resources’’ Social Dilemmas: Theoretical Issues and Research Findings, pp. 43–57.
Rapoport, A., and R. Suleiman. (1992). ‘‘Equilibrium Solutions for Resource Dilemma’’ Group Decision and Negotiation, 1, pp. 169–294.
Raschky, P A. (2008). "Institutions and the Losses from Natural Disasters" Natural Hazards and Earth System Sciences, 8, pp. 627-634.
"Rural population (% of total population) in Solomon Islands." Rural population (% of total population) in Solomon Islands. N.p., n.d. Web. 12 Apr. 2014.
<http://www.tradingeconomics.com/solomon-islands/rural-population-percent-of-total-population-wb-data.html>.
Sachs, Jeffrey. (2004). "Ending Africa's Poverty Trap" Brookings Papers on Economic Activity, 1, pp. 117-240.
Sachs, Jeffrey. (2005). The End of Poverty: Economic Possibilities for Our Time. New York: Penguin Press.
Skidmore, M, and H. Toya. (2007). "Economic Development and the Impacts of Natural Disasters"
Economics Letters, 94, pp. 20-25.
Solnit, R. (2009). A Paradise Built in Hell: The Extraordinary Communities that Arise in Disaster. Viking Books.
Townsend, Robert M. “Risk and Insurance in Village India” Econometrica, 62 (3), pp. 539-91.
Toya, Hideki and Skidmore, Mark. (2007). "Economic Development and the Impacts of Natural Disasters" Economics Letters, 94 (1), pp. 20-25.
Toya, Hideki, and Mark Skidmore. (2012). "Do Natural Disasters Enhance Societal Trust?"
Working Paper.
Williams, Richard. (2013). "Generalized Ordered Logit/ Partial Proportional Odds Models" pp. 1 31.
Overall (N, Std.
Dev.) Exposure
No
Exposure t-statistic (N for 0,1)
Control Variables
Married 0.72 0.74 0.71 0.76 (1600, 0.45) (0.44) (0.45) (260, 540) Engaged 0.02 0.02 0.03 0.41
(1600, 0.14) (0.15) (0.16) (260, 540) Single 0.17 0.14 0.22 2.60***
(1600, 0.37) (0.35) (0.41) (260, 540) Widower 0.05 0.05 0.05 0.35
(1600, 0.22) (0.22) (0.21) (260, 540) Female 0.50 0.50 0.50 0.00
(1600, 0.50) (0.50) (0.50) (260, 540) Age 39.70 40.42 38.43 1.91*
(1520, 14.13) (13.48) (14.18) (259, 520) Number of
Children 3.52 3.54 3.36 0.90 (1501, 2.54) (2.46) (2.78) (257, 508) Wealth 1.13 1.16 1.19 0.51
(1600, 0.86) (0.89) (0.77) (260, 540) Spouse
Present
during SCA 0.55 0.46 0.71 4.55***
(1500, 0.73) (0.68) (0.80) (259, 508) Participated
in RDP
Meetings 0.60 0.56 0.59 0.99 (1480, 0.49) (0.50) (0.49) (258, 506) Member of
RDP 0.18 0.16 0.19 1.04
(1175, 0.39) (0.36) (0.39) (167, 429) Participated
in Building of RDP
Project 0.78 0.75 0.79 1.27 (1457, 0.42) (0.44) (0.41) (250, 500) Satisfaction
with Project 0.95 0.95 0.98 1.68*
(1506, 0.21) (0.21) (0.15) (257, 516) Table 2: Summary Statistics for Treatment Group
Treatment Group
Notes: This table reports the means, standard deviations, and t-tests of difference in means. The variable used to assess exposure is the "exposed1" variable, which takes on the value of 1 if a community experienced at least one natural disaster in the past
Contribution
Amount Freq. Percent Cum. Freq. Percent Cum. Freq. Percent Cum.
0 5 0.64 0.64 2 0.77 0.77 3 0.57 0.57 5 22 2.8 3.43 3 1.15 1.92 19 3.61 4.17 10 49 6.23 9.66 7 2.69 4.62 42 7.97 12.14 15 32 4.07 13.72 10 3.85 8.46 22 4.17 16.32 20 95 12.07 25.79 26 10.00 18.46 69 13.09 29.41 25 222 28.21 54.00 62 23.85 42.31 160 30.36 59.77 30 105 13.34 67.34 23 8.85 51.15 82 15.56 75.33 35 55 6.99 74.33 23 8.85 60.00 32 6.07 81.40 40 66 8.39 82.72 26 10.00 70.00 40 7.59 88.99 45 31 3.94 86.66 19 7.31 77.31 12 2.28 91.27 50 105 13.34 100.00 59 22.69 100.00 46 8.73 100.00
Total 787 100.00 260 100.00 527 100.00 Total Population
Contribution with no Exposure
Contribution with Exposure Table 6: Frequency of Contribution Amounts
VARIABLES
OLS with Controls
# of Obsv. R-squared
OLS with Controls
# of Obsv. R-squared
Drought -0.03 1,433 0.07 1,431
(0.07) 0.01 (0.10) 0.04
Earthquake 0.07 1,433 -0.12 1,431
(0.07) 0.01 (0.08) 0.04
Flood 0.03 1,433 0.03 1,431
(0.08) 0.01 (0.12) 0.04
Landslide 0.05 1,433 0.23 1,431
(0.11) 0.01 (0.08) 0.05
Tsunami -0.07 1,433 0.03 1,431
(0.08) 0.01 (0.09) 0.04
High rains -0.06 1,402 0.10 1,402
(0.05) 0.01 (0.08) 0.05
Exposed to 1 -0.07 1,450 0.08 1,448
(0.05) 0.01 (0.06) 0.04
Exposed to 2 -0.07 1,450 0.04 1,448
(0.06) 0.01 (0.08) 0.04
Table 8: Disaster Indicator Regression Results for Feeling Safe and Worried Others Will Cheat or Steal
Note: Each of these indicators were run separately in a regression with feeling safe and worried others will cheat or steal as the outcome. Individual
controls are not included in this table. These controls are: Marital Status dummies, Female dummy, Age, Number of Children, and Wealth. Number of
children and female show significance in the worried others will cheat regressions. Fixed effects at the province level and clustered standard errors
at the village level are used in all regressions. Standard errors are in parentheses. *** indicates statistical significance at 1% level, ** at 5% level,
and * at 10% level.
Feels Safe in Community Cheat or Steal from YouWorried Others Will
VARIABLES
OLS with Controls
Drought -1.29*
(0.55) Earthquake -0.30
(0.48) Flood -1.47
(0.95) Landslide -1.85**
(0.28) Tsunami -0.81
(0.53) High rains -0.84
(0.54)
Exposed to 1 -1.19*
(0.52)
Exposed to 2 -1.25*
(0.51)
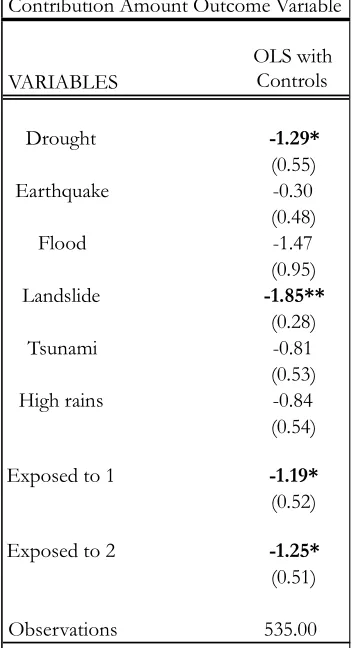
Observations 535.00 Table 10: Ordered Logit Disaster Indicator Regression Results for Contribution Amount Outcome Variable
Note: Each of these indicators were run separately in a regression with Contribution Amount as the outcome. Individual controls are not included in this table. These controls are: Marital Status dummies, Female dummy, Age,
Number of Children, Wealth, Satisfaction with SCA project, Spouse Present during SCA, Member of RDP,
Participated in RDP meetings and Participated in RDP building process. None of these controls show significance
in any of the regressions. Fixed effects are used in all regressions along with clustered standard errors at the village level. Standard errors are in parentheses. *** indicates statistical significance at 1%
level, ** at 5% level, and * at 10% level and are adjusted using the
VARIABLES
OLS with
Controls Observ. # of OLS with Controls Observ. # of OLS with Controls Observ. # of
Drought 0.01 1390 -0.33 1407 -0.04 1388
(0.24) (0.30) (0.23)
Earthquake -0.11 1390 -0.29 1407 0.37 1388
(0.25) (0.25) (0.21)
Flood -0.22 1390 -0.17 1407 0.15 1388
(0.29) (0.20) (0.21)
Landslide 0.13 1390 0.15 1407 -0.10 1388
(0.18) (0.30) (0.24)
Tsunami 0.01 1390 -0.39 1407 0.23 1388
(0.25) (0.12) (0.18)
High rains -0.01 1363 0.05 1379 0.47** 1359
(0.23) (0.21) (0.14)
Exposed to 1 -0.07 1406 -0.08 1423 0.32 1404
(0.18) (0.17) (0.16)
Exposed to 2 0.09 1406 -0.17 1423 0.23 1404
(0.19) (0.20) (0.20)
Table 11: Ordered Logit Disaster Indicator Regression Results for Prosocial Preference Outcome Variables Trust Reciprocity Altruism
Note: Each of these indicators were run separately in a regression with the prosocial preferences as the outcome. Individual controls are not included in this table. These controls are: Marital Status dummies, Female dummy, Age, Number of Children, and Wealth. Age shows significance in all of the regressions listed in column 1. Number of children shows significance in all of the regressions in column 2. None of
the control variables show significance in any of the regressions in column 3. Fixed effects are used in all regressions along with clustered standard errors at the village level. Standard errors are in parentheses. *** indicates statistical significance at 1% level, ** at 5% level, and * at 10% level and are adjusted with the
Holm-Bonferroni correction.
VARIABLES
OLS with
Controls Observ. # of OLS with Controls Observ. # of OLS with Controls Observ. # of
Drought -0.11 1390 -1.25 1407 0.15 1388
(0.81) (1.07) (0.52)
Earthquake -0.30 1390 -1.15 1407 0.72 1388
(0.79) (0.95) (0.48)
Flood -0.59 1390 -0.76 1407 0.40 1388
(0.85) (0.71) (0.42)
Landslide 0.68 1390 0.56 1407 -0.05 1388
(0.63) (1.07) (0.42)
Tsunami -0.09 1390 -1.38** 1407 0.36 1388
(0.82) (0.43) (0.36)
High rains 0.17 1363 0.10 1379 1.14*** 1359
(0.73) (0.75) (0.32)
Exposed to 1 -0.22 1406 -0.39 1423 0.82* 1404
(0.60) (0.58) (0.34)
Exposed to 2 0.47 1406 -0.63 1423 0.49 1404
(0.59) (0.74) (0.43)
Note: Each of these indicators were run separately in a regression with the prosocial preferences as the outcome. Individual controls are not included in this table. These controls are: Marital Status dummies, Female dummy, Age, Number of Children, and Wealth. Age shows significance in all of the regressions listed
in column 1. Number of children shows significance in all of the regressions in column 2. None of the control variables show significance in any of the regressions in column 3. Fixed effects are used in all regressions along with clustered standard errors at the village level. All are censored at the right by 20. Standard errors are in parentheses. *** indicates statistical significance at 1% level, ** at 5% level, and * at
10% level and are adjusted using the Holm-Bonferroni correction.
Table 12: Tobit Disaster Indicator Regression Results for Prosocial Preference Outcome Variables Trust Reciprocity Altruism