The University of San Francisco
USF Scholarship: a digital repository @ Gleeson Library |
Geschke Center
Master's Theses Theses, Dissertations, Capstones and Projects
Spring 6-3-2015
An Analysis of Juvenile Chinook Salmon
Outmigration Speed and Survival in Response to
Habitat Features: Sacramento River from Knights
Landing to Sacramento, California
Natalie N. McNair
University of San Francisco, [email protected]
Follow this and additional works at:https://repository.usfca.edu/thes
Part of theEnvironmental Monitoring Commons,Other Environmental Sciences Commons, and theTerrestrial and Aquatic Ecology Commons
This Thesis is brought to you for free and open access by the Theses, Dissertations, Capstones and Projects at USF Scholarship: a digital repository @ Gleeson Library | Geschke Center. It has been accepted for inclusion in Master's Theses by an authorized administrator of USF Scholarship: a digital repository @ Gleeson Library | Geschke Center. For more information, please [email protected].
Recommended Citation
McNair, Natalie N., "An Analysis of Juvenile Chinook Salmon Outmigration Speed and Survival in Response to Habitat Features: Sacramento River from Knights Landing to Sacramento, California" (2015).Master's Theses. 143.
[1]
This Master's Thesis
An Analysis of Juvenile Chinook Salmon (Oncorhynchus tshawytscha) Outmigration Speed and Survival in Response to Habitat Features: Sacramento River from Knights Landing to
Sacramento, California
by
Natalie McNair
is submitted in partial fulfillment of the requirements for the degree of:
Master of Science in
Environmental Management
at the
University of San Francisco
Submitted: Received:
...……….. ...………….
Natalie McNair Date John Callaway Date
...…………. Stephanie Ohshita Date
...………….
[2]
Abstract
Outmigration is an important life stage for Chinook salmon (Oncorhynchus tshawytscha)
survival in the Sacramento River, and yet our understanding of their behavior and needs during
this time is limited. To gain a better understanding of their survival and movement rates during
outmigration, late fall run Chinook salmon smolts were tracked using acoustic telemetry
techniques. Habitat features were measured and quantified throughout the study area to evaluate
how Chinook salmon respond to key levee features including shade, instream woody material,
and aquatic vegetation. The overall average movement speed through the entire study area was
0.77 m/s with an overall survival of 86%. Based on multiple linear regressions, vegetation was
found to have the largest effect on speed with fish slowing down with increased vegetation
cover. Shade, river mile, and velocity also had significant effects on movement speeds, but
instream woody material was not significant. The result for woody material was surprising since
it was anticipated to have a large impact on movement speeds. A positive correlation was found
between faster fish movement speeds and higher survival. No evidence of diel movement
patterns was found after releasing the fish. These finding can help managers create sites better
designed to help Chinook salmon in the Sacramento River system. Results from this paper
indicate that the type of woody material being installed might not be appropriate for this life
stage of salmon.
Introduction
Many North American species of salmon have suffered population declines over the last
century (Hubley et al. 2008, Welch et al. 2008, Perry et al. 2009, Dempson et al. 2011, Martins et
[3]
Sacramento River have been particularly impacted. Currently, all four of the Evolutionarily
Significant Units (ESU) of Chinook salmon in the Sacramento River are listed under the State
and/or Federal Endangered Species Act. The winter-run ESU is State and Federally listed as
endangered, the spring-run ESU is State and Federally listed as threatened, and the fall and
late-fall run ESU’s are Federally listed as a Species of Concern (California Department of Fish and
Wildlife 2013).
Return rates of Chinook salmon in the Sacramento River used to number in the millions,
but by 1970, the number of returning individuals dropped to around 4,000 (Newman & Rice
2002). Outmigration is an important life stage for salmon and survival rates during this stage
greatly impacts the adult return rates (Healey 1991, Newman & Rice 2002, Perry et al. 2009,
Michel et al. 2012). As juvenile salmon migrate through the Sacramento River and its
tributaries, their survival drops dramatically from factors such as predator encounters and water
diversions in a highly modified river system that tends to lack complex habitat structure (Perry et
al. 2009). Chinook in the Sacramento River have many routes that they can take during
migration. Our understanding of these routes is limited and has been the focus of several recent
studies. Evidence seems to indicate that some routes have better survival rates than others
(Newman & Rice 2002, Limm & Marchetti 2009, Perry et al. 2009, Michel et al. 2012). Perry
et al (2009) found survival to be highest for fish that remained in the Sacramento River and
lower for fish that migrated through slough and bypasses in the interior of the Delta. The health
and survival rates of outmigrating salmon cohorts can greatly affect adult return rates a few years
later.
Juvenile salmon have been found to have better growth and survival rates in off-channel
[4]
tend to have optimal temperatures and slower moving water which may provide less predator
interactions, more access to food, and better growth rates that improve salmon health prior to
reaching the ocean (Sommer et al. 2001, Limm & Marchetti 2009). Larger smolts typically have
greater survival rates upon reaching the ocean as well as during migration, compounding effects
from the outmigration period (Zabel & Williams 2002).
Unfortunately, the Sacramento River salmon have been largely cut off from floodplain
and off-channel habitat due to levees, dams, and diversions. The channelized levee system of the
Sacramento River began in the late 1800’s. By 1968, the State Flood Control levees were
finalized (James & Singer 2008). The narrow system with hardened banks promotes erosion
which eventually requires more riprap to repair weakened sections of levees. While riprap is
generally thought of as having a negative impact on fish habitat, it has also been found to have
some benefits for certain juvenile salmonid species, but not all salmonid life stages
(Schmetterling et al. 2001; Fischenich 2003). For example, hardening banks can improve water
quality by reducing erosion and sediment loads or provide habitat for aquatic invertebrates that
fish rely on as food sources (Fischenich 2003) The scale of impact from riprap or the
successfulness of restoration attempts is highly affected by the size of the project (Fischenich
2003, Bernhardt & Palmer 2011). If a small area in a large river is riprapped, it is not likely to
have much impact on the system as a whole. However, when the majority of a system is
riprapped, similar to the Sacramento River, the impacts can be profound, and small restoration
project might be less impactful.
Riprapped streams tend to lack woody debris (Lassettre & Harris 2001, Schmetterling et
al. 2001). Hardened banks halt channel migration and reduce the input of new IWM such as
[5]
recruit snags (Lassettre & Harris 2001, Schmetterling et al. 2001). Since 2001, repairs in the
area that is the focus of this paper have incorporated placement of anchored IWM on riprapped
sites to mitigate for the loss of naturally occurring woody debris recruitment (NMFS 2008,
USFWS 2008). The effectiveness of these mitigation measures is not clear due to their
patchwork nature of their locations and the large scale of the Sacramento River. Over time as
more sites with installed IWM are built, their overall effectiveness might increase as a larger area
of banks become covered with IWM. This will increase the complexity of riprapped banks.
Since conditions in most years only allow juvenile salmon access to the mainstem of the
river above the delta, this study takes a fine-scale look at a section of the lower Sacramento River
where the U.S. Army Corps of Engineers (USACE) has constructed numerous levee repairs,
which incorporated habitat structures for juvenile salmon on the levee banks to provide more
natural features with the intent of improving juvenile salmon survival (USACE 2012). Many of
these repairs were implemented under the Sacramento River Bank Protection Project (SRBPP),
which has been an ongoing project since its authorization in the 1960’s and has a project area
encompassing more than 1,300 miles (2092 km) of levee (USACE 2012). Repair designs along
the Sacramento River typically include some combination of rock, riparian vegetation consisting
of live cuttings, grasses, and woody plants, anchored instream woody material (IWM), and either
a sloping bank or riparian bench. This study used acoustically tagged juvenile hatchery late fall
run Chinook salmon to analyze change in outmigration speeds and survival through a stretch of
the Sacramento River. The movement and survival rates were then compared to existing habitat
features to determine how much of the change in speed and survival can be explained by
shoreline environmental features, river flow, or average river velocity.
[6]
The Sacramento River is the largest of California’s rivers. It flows from its headwaters at
the McCloud River to the San Francisco Bay with an average annual runoff of 27 billion cubic
meters (Domagalski et al. 2000). The analysis in this study focused on an approximately 30 mile
(48 km) stretch of the Sacramento River from Knights Landing at approximately river mile (RM)
93 (river km (rkm) 245) to Sacramento, California at approximately RM 62 (rkm 193) (Figure
1). This section of the river is constrained from levees and unable to meander. It contains
variable habitats and several USACE repair sites of various ages and types. Some sections are
more naturalized with eroding banks sloughing off into the river. The majority of this reach in
covered with riprap or other rock armoring such as cobble or concrete rubble.
The upper reach of the study area is fairly narrow and somewhat sinuous. About
mid-way through the study area (near RM 80; rkm223), the Feather River joins the Sacramento River,
and the river becomes slightly wider with less naturalized banks and more docks and marinas as
it approaches the city of Sacramento. The river is widest at the end of the study area. The
average flows through the study area during the study period (December 2012 – March 2013)
ranged from approximately 22,000 cfs (623 cms) to 12,000 cfs (340 cms) (DWR 2013). There
was one peak flow event during the study period. It occurred after the first release and flows had
significantly decreased by the second release, therefore the peak flow event was not captured in
any of the analysis for this study (Figure 2).
Methods
In order to monitor salmon migration speed and survival, acoustically tagged, hatchery
[7]
Anderson, CA were released in the Sacramento River from December 2012 to March 2013 and
used as surrogates for wild Chinook salmon smolts (Table 1).
Array
Our study used Vemco 180 kHz VR2W receivers to monitor fish survival and movement;
in order to stabilize receivers within the flow of the river, receivers were attached to large
mounts consisting of rebar and heavy weights. The receivers were attached to the custom
mounts using hose clamps and zip ties to reduce any vibration or noise interference. Cable was
attached to the bottom of the mounts for retrieval then secured to the shore. The receivers were
deployed at 11 migration timing stations (MS) in the mainstem of the Sacramento River (Figure
1, Table 2) that consisted of two to five receivers to create an acoustic gate with a high likelihood
of detecting tagged fish. The station at Knights Landing Bridge (KLB) was the only one with
two receivers due to the narrow channel. Most stations consisted of four receivers positioned
near the banks in a box pattern. Areas below the Feather River used an additional fifth receiver
in the center of the river to improve detection probability.
We focused our monitoring on the area between the release site at approximately RM 93
(rkm 245) and MS 11 at RM 62 (rkm 193) to match with available hydraulic modeling and
environmental data. Additionally, there are several SRBPP sites in this area with installed
habitat features that are the focus of this study. The linear distance between the release and MS
11 is approximately 179,000 feet (54,559 m). KLB served as the first migration timing station
for the array. A station called MS 0 was installed after the second release of fish to provide
additional information about how the fish behave just after release. MS 0 was located between
[8]
releases, it was only used to gain insight on the initial movement of the salmon just after release
and was not used in statistical analysis.
Tagging and Release
Juvenile hatchery raised Chinook salmon from the Coleman National Fish Hatchery were
tagged with Vemco 180 kHz V5 tags which weigh 0.65 g. The tags are cylindrical with a length
of 12 mm and a diameter of 5 mm; they last approximately 55 days after activation. A total of
617 fish weighing between 9 and 88 g (26 g average) and with a total length between 93 and 193
mm (133 mm average) were tagged. Fish size was limited by the size and weight of the tag to
not overburden the fish or cause behavioral changes from excessive weight. Fish were
anesthetized using Finquel MS-222 prior to tagging. After tagging, fish were held in recovery
tanks overnight and transported from the hatchery in Anderson, California, to the release site just
above Knights Landing, California.
Fish were released in six separate groups of approximately 100 fish (Table 2). The six
releases occurred on five separate days between December 2012 and March 2013. Release
groups were limited to 100 fish to reduce the possibility of tag collisions, which occur when too
many tags are transmitting at the same time. When this happens, the receivers can miss signals
and tags might not be recorded when they are within range of the receiver.
Twenty four hours after tagging, the fish were loaded into five or six coolers, each
containing 15 to 20 fish. Once at the release site, the coolers were slowly tempered with river
water to acclimate the fish to the river conditions. The fish were released when the water
temperature within a cooler was within 0.5°C of the river temperature, one cooler at a time in 20
minute intervals over 2 hours to further reduce tag collisions when the fish migrated through the
[9]
In order to evaluate potential differences in diurnal vs. nocturnal movement, the final
release was split into two groups, with paired day and night releases which both occurred on the
same day. Release 5b was released during the day at a similar time to other release groups, and
5c was released around midnight.
Environmental Data
Average river flows for the entire study area during the study period come from three
Department of Water Resources (DWR) California Data Exchange Center (CDEC) stations in or
around the study area (DWR 2013) (Figure 2). CDEC station Sacramento River at Wilkins
Slough is located approximately 26 river miles (42 rkm) upstream of the study area, Sacramento
River at Verona is located in the array between MS 7 and 8, and Sacramento River at Freeport is
located approximately 12 miles (19 km) downstream from the study area in a tidally influenced
part of the river.
Average water velocity for each reach between stations was derived from the Adaptive
Hydraulics (AdH) model (Saltus 2014). The model contains several river variables including
average velocity values at 5 m2 intervals. The model covered the entire study area from Knights
Landing to the Interstate 5 bridge just above Sacramento. River gauges and ADCP data from
Knights Landing, Fremont Weir and Verona were used to calibrate the model (Threadgill 2014).
Shoreline habitat data for shade, vegetation and IWM in the study area were quantified
using the USACE Revetment Database, which contains continuous GIS data for the Sacramento
River from river mile 0 (rkm 0) at Collinsville to river mile 194 (rkm 312) at Chico Landing
[10]
three surveyors. Data were recorded between 2003 and 2007 for features at the mean summer
water level and were grouped by bank type (e.g., natural, revetment, etc.). Surveyed bank
lengths were not equal since bank type was used to break up surveyed segments. GPS
equipment was used in the field to accurately document surveyed bank lengths (USACE 2007).
For SRBPP sites built after 2007, additional surveys were conducted, and that information was
added to the Revetment Database. For this study, only data on vegetation, IWM, and shade were
used since they are the primary features installed along repair sites for salmonid habitat. Each
segment surveyed was assigned a categorical value of percent cover for each habitat feature. For
example, IWM for a segment was recorded as either 0%, 1-10%, 11-50% or >50% (USACE
2007). For the purpose of this analysis, data from the Revetment Database were converted to an
index by taking the median of each of the habitat feature categories, and multiplying it by the
total amount of that category in the study area. Each reach (area between stations) was then
assigned an index value for each habitat type.
Analysis
Survival within each segment, as well as through the entire array, was determined using
the Cormack-Jolly-Seiber model for mark and recapture type analyses (Cormack 1964, Jolly
1965, Seiber 1965). A one-way analysis of variance (ANOVA) with the Holm’s sequential
Bonferroni correction was used to determine differences in survival between reaches (Holm
1979).
Migration speeds within individual sections were determined by using the last detection
time for an individual from the prior station and the first detection time from the preceding
station. Speeds for all fish in each release were averaged together to provide the migration speed
[11]
considered mortalities and removed from the analysis. A one-way ANOVA with the Holm’s
sequential Bonferroni correction was used to determine differences in average migration speed
between reaches (Holm 1979). A paired t-test was used to determine differences in movement
rates between the day and night release groups (release 5 and 5N).
Simple and multiple linear regressions were used to determine relationships between
migration speed and survival between stations and the environmental variables, including percent
cover of vegetation, shade, IWM, river mile, and river velocity. Simple regressions were
conducted first to determine significance of each individual habitat category with all release
groups analyzed together (Average Speed= α*Environmental Index + β). All variables that were
significant in the individual simple regressions were included in the final model.
All analysis was done using R (R Core Team 2014). Release groups were included in the
analysis as replicates.
Results
Average velocity magnitudes for the reaches ranged from 0.06 m/s to 0.3 m/s based on
results from the AdH. Vegetation index values decreased somewhat downstream (Figure 3).
Shade and IWM index values were strongly correlated with each other (r=0.85) and also
decreased slightly downstream (Figure 3). In general, the study area had more habitat features in
the upper reaches and these decreased downstream.
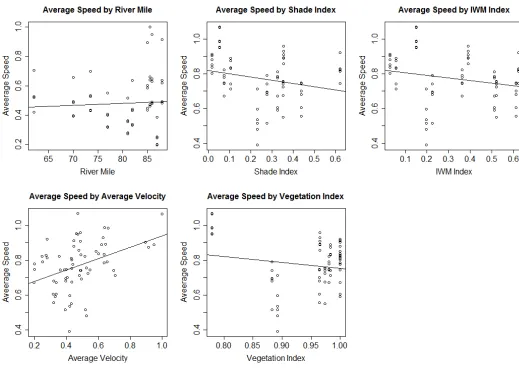
The SRA and vegetation indices, river mile, reach velocity, and release group were all
significant correlated with migration speed (Figure 6). Those variables were included in the final
model relating migration speed to habitat features (Average Speedi=βø+β1(SRA Index)+β2(Veg
[12]
index was not found to be a significant predictor of speed and therefore was not included in the
final model.
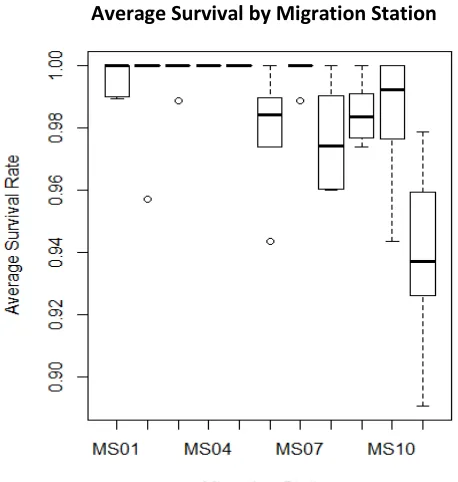
Survival through the study area was generally high; by the end of the array at Sacramento
approximately 86% of all tagged fish survived through the 48 km stretch of river. The first
release had the lowest overall survival rate of 69%, while release two had the highest with 97%
survival. In addition, survival between reaches was fairly consistent, with no significant
differences in survival between reaches based on ANOVA. Survivorship between individual
reaches was very high, usually greater than 98% with decreasing survival in the lower reaches
(Figure 7).
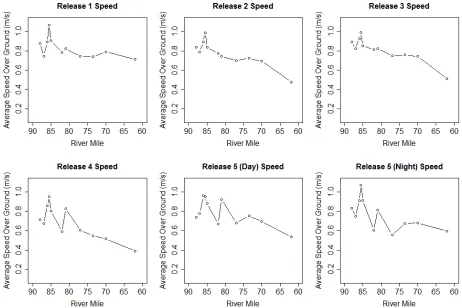
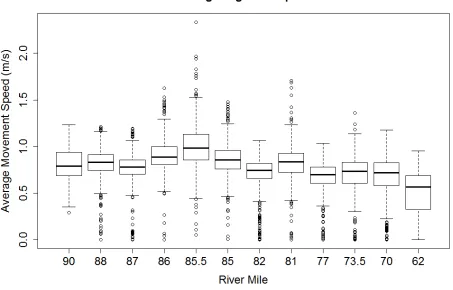
Average speed for all release groups by station varied from 0.39 m/s to 1.07 m/s with an
overall average of 0.77 m/s (Figure 4 and Figure 5). There was a consistent peak in speed at MS
4, RM 85 (rkm 232) on all sampling dates. The AdH model shows a strong hydraulic feature in
that location that is associated with high water velocities. A smaller peak in speed occurred at
MS 7, just before the Feather River confluence. This second peak developed as the season
progressed indicating a seasonal change in flows in that area, while the peak at MS 4 remained
fairly consistent. A possible explanation could be a backwater effect from the Feather River that
decreases later in the season. The ANOVA results show significant differences in movement
speed between several reaches. As mentioned previously, speed inMS 4 was the most different,
followed closely by MS 3. MS 7, though visibly different was not found to be significantly
different from any other station. Speed in the upper stations were significantly different from
speeds at the end of the array at MS 11. Additionally, there was a positive relationship between
[13]
Initial rates of movement between the release site and the first station at KLB for all
releases were found to be much slower than throughout the rest of the array. The initial
movement speeds averaged 0.19 m/s and were significantly lower than the average movement
speed through the rest of the array, which averaged 0.39 m/s through the slowest reach and 0.77
m/s overall. Migration rates were not found to differ significantly between the day and night
release groups when tested during the last release on March 27, 2013 (P=0.53).
Vegetation had a significant slowing effect on migration speed (P<0.0001) and the
largest effect size. While less significant than the vegetation, shaded area (P=0.007) and reach
velocity (P=0.005) were found to increase migration speed slightly. Reach velocity has the
second greatest effect size after vegetation. IWM was dropped from the final model due to
colinearity with the shade variable. IWM also was not found to have a significant effect on
speed when analyzed individually (P=0.07) (Figure 6).
In the final model, the river mile variable, or location in the river, had a significant effect
on speed (P<0.0001). The relationship was negative, indicating the fish slow down as the move
downstream. As fish moved lower in the system where the river gets wider and shallower, their
average speed decreased. They also move into a more tidally influenced zone which can be seen
on the hydrograph (Figure 2) Flows downstream fluctuate with the tides which may be
contributing to the reduction in speed.
Discussion and Conclusion
Habitat features were not as influential as expected
Habitat features were not found to have a large effect on fish movement or survival.
[14]
great extent. These results were unexpected, especially for IWM which has been documented to
be a key habitat attribute by providing cover and food resources for fish in healthy riverine
systems. (Lassettre & Harris 2001, Schmetterling et al. 2001, Zanjac et al. 2013). A key reason
smolts might not be responding to the installed habitat features is scale. The SRBPP sites with
installed habitat features are located in patches along the river. The lack of influence of IWM in
this study could be due to the small size of wood at repair sites given the size of the Sacramento
River. The anchored wood can break down and lose some of the intricate structure that typically
provides cover for small fish. Additionally, the IWM is usually installed at the mean winter
water line. Therefore it is not inundated unless flows are relatively high. This study was
conducted during the second year of a drought in the area, and the system experienced relatively
low winter flows. Lastly, the smolts in this study might be too large or too focused on migrating
to use the structures for cover. An updated shoreline survey documenting existing habitat
features in finer detail might help answer some of these questions in future studies.
Additionally, it is believed that smolts respond to hydraulic cues during migration. For
example, salmon smolts tend to wait for high pulse flow events prior to beginning downstream
migration (del Rosario 2013). They tend to use hydraulic cues to find suitable habitat, such as
velocity and strain (Nestler et al. 2012). It is possible that the size of the repair sites is too small
to offer slower velocities for foraging, and cover habitat is too small in a system as large as the
Sacramento River. Therefore the hydraulic cues may be missed as fish migrate in the higher
velocity channel. Background noise and hydraulics of the river could cause these sites to be
bypassed. The smolts could be moving with river currents that do not interact with the shoreline
[15]
the Sacramento River. Larger features may be needed to provide suitable refuge for migrating
juvenile salmon.
Similar to other studies, we observed a pattern of decreasing movement speed as fish
moved closer to the delta. (Michel et al. 2012). This could be due to lower flows in these areas
and increasing tidal effects closer to the delta. Several studies have also found flow to be a key
factor affecting outmigrating salmon in multiple river systems (Giorgi et al. 1997, Newman &
Rice 2002, Petrosky & Schaller 2010, Smith et al. 2002). Lower flows in this area also may
make it easier for smolts to access habitat features on the banks.
Faster Fish Survived Better
Overall, movement speed was fairly high through the study area. Other studies in the
area observed similar rates of movement around 0.50 m/s (Michel et al. 2012), which was within
our observed range of 0.39 to 0.77 m/s. This could be due to higher flows and water velocities
through our particular study boundaries, as fish migration was strongly correlated with water
velocity (Figure 6). For example, the bend between MS 3 and MS 4, at River Mile 85.6 (rkm
232), had some of the highest velocities in the array, and fish speeds were consistently fastest
there, close to or greater than 1 m/s. This particular hydraulic feature tends to push fish away
from the installed habitat features at RM 85.6 (rkm 232) (Sandstrom et al., 2012)
Previous studies have shown that fish exposed to floodplains and other habitats with
adequate nutrients and feeding opportunities tend to have higher survival rates. Contrary to
those findings, our study indicated that fish that migrated faster survived better (Figure 8). A
study focused on steelhead in the Puget Sound also found higher survival rates among faster
[16]
section of the Sacramento River, exposure time might be the most important factor for predation
rather than distance traveled (Anderson et al. 2005).
Lack of Diel Movement Patterns
Studies have documented diel migration patterns for Chinook through the Sacramento
River (Chapman et al. 2012, Michel et al 2012, Zanjac et al. 2013). While our study did not find
a significant difference in the migration patterns of the fish released at night versus the fish
release during the day on March 27, 2013, we did observe a pattern of holding prior to
movement after the fish are introduced to the river. The daytime releases appeared to hold
somewhere soon after being released, and then begin their migration after sunset. All release
groups took approximately 4 hours to travel from the release site to Knights Landing Bridge.
The average movement speed for all releases across the entire study area was 0.77 m/s with a
minimum average reach speed of 0.39 m/s. However, movement speed from the release site to
the first station at the Knights Landing bridge was approximately 0.19 m/s, indicating a lag prior
to migrating. The day and night release group had the same average speed getting to Knights
Landing Bridge, 0.21 m/s. This indicates that the smolts in our study seem to be waiting for a
cue other than nightfall to begin migration. It is possible that 4 hours is the time the salmon need
to acclimate to their new surroundings before deciding to begin migration.
Two potential limitations of this study are the use of hatchery fish as surrogates for wild
fish and the database used to quantify shoreline features. While hatchery fish provide a reliable
source of fish to meet the needed sample size requirements, they can have significant behavioral
differences from wild fish. Studies have found difference in size, survival, migration speed and
[17]
al. 2006, Thériault et al. 2009, Jackson & Brown 2011). However, hatchery raised fish are
commonly used in similar studies and therefore still a valuable tool for analyzing salmon
responses during migration. Additionally, the USACE Revetment database was the best
available source of comprehensive environmental data for the study area. Unfortunately, this
database was created in 2007 and is several years old. However, we feel that the data were still
reliable because they were collected at a very broad scale, and a visual comparison against
current satellite images showed the data to be similar to current conditions. Updated
environmental data could improve future studies in the area.
This study provided a more detailed look at Chinook movement through a relatively
small reach of the Sacramento River. While habitat features do appear to be of some value to
migrating salmon, they are not as influential as anticipated. Two additional years of data in this
area are currently being collected by the USACE and could provide further insight into habitat
use by migrating salmon. Larger habitat features placed lower on the river banks might provide
a better migratory corridor for salmon smolts in large rivers.
Acknowledgments
I’d like to that the U.S. Army Corps of Engineers for funding and conducting this study;
particularly, David Smith, Brian Mulvey, Brian Luke and Michael Fong. Anna Steel and Gabriel
Singer from U.C. Davis made the study possible by helping with the study design, tagging fish,
and teaching me how to analyze the data. Finally, I’d like to thank John Callaway and Stephanie
[19]
Tables and Figures
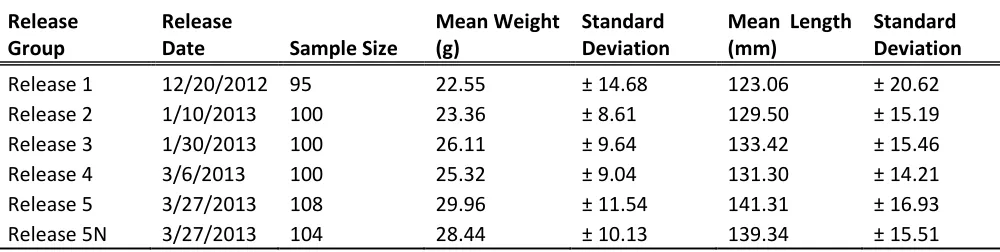
Table 1. The summary of the release groups, including release dates, sample size and average weights and lengths.
Release Group
Release
Date Sample Size
Mean Weight (g)
Standard Deviation
Mean Length (mm)
Standard Deviation
Release 1 12/20/2012 95 22.55 ± 14.68 123.06 ± 20.62 Release 2 1/10/2013 100 23.36 ± 8.61 129.50 ± 15.19 Release 3 1/30/2013 100 26.11 ± 9.64 133.42 ± 15.46 Release 4 3/6/2013 100 25.32 ± 9.04 131.30 ± 14.21 Release 5 3/27/2013 108 29.96 ± 11.54 141.31 ± 16.93 Release 5N 3/27/2013 104 28.44 ± 10.13 139.34 ± 15.51
Table 2. The migration timing station identification numbers and approximate corresponding Sacramento River location.
Station ID Approximate River Mile Approximate River Kilometer
Release 93 245
KLB 90 239
MS 1 88 237
MS 2 87 234
MS 3 86 233
MS 4 85.5 232
MS 5 85 231
MS 6 82 226
MS 7 81 224
MS 8 77 217
MS 9 73.5 213
MS 10 70 208
[20]
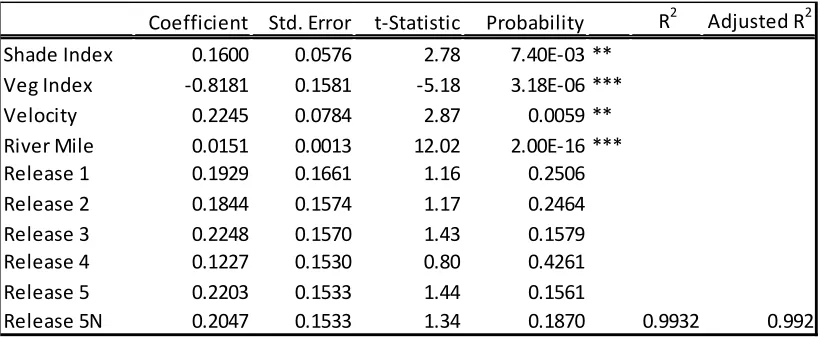
Table 3. Summary of the multiple regression model used to evaluate the relative influence of habitat features on migrating juvenile Chinook salmon speed in the Sacramento River.
Coefficient Std. Error t-Statistic Probability R2 Adjusted R2 Shade Index 0.1600 0.0576 2.78 7.40E-03 **
Veg Index -0.8181 0.1581 -5.18 3.18E-06 *** Velocity 0.2245 0.0784 2.87 0.0059 ** River Mile 0.0151 0.0013 12.02 2.00E-16 *** Release 1 0.1929 0.1661 1.16 0.2506 Release 2 0.1844 0.1574 1.17 0.2464 Release 3 0.2248 0.1570 1.43 0.1579 Release 4 0.1227 0.1530 0.80 0.4261 Release 5 0.2203 0.1533 1.44 0.1561
[21]
[22]
Figure 2. Hydrograph showing the average flows during the study period from Wilkins Slough (above the study area), Verona (near MS 7) and Freeport (after the study area in a tidally influenced zone)
[23]
[24]
[25]
[26]
[27]
Average Survival by Migration Station
[28]
Survival as a Function of Migration Speed
[29]
References
Anderson, J.J. E. Gurarie, & R.W. Zabel. 2005. Mean free-path length theory of predator-prey
interactions: application to juvenile salmon migration. Ecological Modeling,
186:196-211.
Bernhardt, E.S., & M.A. Palmer. 2011. River restoration: the fuzzy logic of repairing to reverse
catchment scale degradation. Ecological Applications, 21:1926-1931.
Bradford, P.B., P.G. Amiro, A.J.F. Gibson, G.L. Lacroix, & A.M. Redden. 2008. Survival and
behavior of migrating Atlantic salmon (Salmo salar L.) kelts in river, estuarine, and
coastal habitat. ICES Journal of Marine Science, 65:1626-1634.
California Department of Fish and Wildlife. 2014. State and federally listed endangered and
threatened animals of California. CDFW Biogeographic Data Branch, California National
Diversity Database. March 2014.
California Department of Water Resources (DWR). 2013. California Data Exchange Center
<http://cdec.water.ca.gov/index.html> Accessed on December 6, 2014.
Chapman, E.D., A.R. Hearn, C.J. Michel, A.J. Ammann, S.T. Lindley, & M.J. Thomas. 2012.
Diel movements of out-migrating Chinook salmon (Oncorhynchus tshawytscha) and
steelhead trout (Oncorhynchus mykiss) smolts in the Sacramento/San Joaquin watershed.
Environmental Biology of Fish 96:273-286.
Cormack, R.M. 1964. Estimates of survival from the sightings of marked animals. Biometrica
51(3/4):429-438.
Del Rosario, R.B., Y.J. Redler, K. Newman, P.L. Brandes, T. Sommer, K. Reece, & R. Vincik.
2013. Migration patterns of juvenile winter-run sized Chinook salmon (Oncorhynchus
tshawytscha) through the Sacramento-San Joaquin delta. San Francisco Estuary &
Watershed Science: 11 (1) (https://escholarship.org/uc/item/36d88128).
Dempson, J.B., M.J. Robertson, C.J. Pennell, G. Furey. M. Bloom, M. Shears, L.M.N. Ollerhead,
K.D. Clarke, R. Hinks, & G.J. Robertson. 2011. Residency time, migration route and
survival of Atlantic salmon Salmo salar smolts in a Canadian fjord. Journal of Fish
Biology, 78: 1976-1992.
Drenner, M.S., T.D. Clark, C.K. Whitney, E.G. Martins, S.J. Cooke, & S.G. Hinch. 2012. A
[30]
salmonids in marine environments. PLoS One 7(3): e31311. DOI:
10.1371/journal.pone.0031311.
Domagalski, J.L., D.L. Knifong, P.D. Dileanis, L.R. Brown, J.T. May, V. Connor, & C.N.
Alpers. 2000. Water quality in the Sacramento River Basin California, 1994-1998: U.S.
Geological Survey Circular 1215, 36 p., on-line at http://pubs.water.usgs.gov/circ1215/
Fischenich, J. C. 2003. “Effects of riprap on riverine and riparian ecosystems.” ERDC/EL
TR-03-4, U.S. Army Engineer Research and Development Center, Vicksburg, MS.
Giorgi, A.E., T.W. Hillman, J.R. Stevenson, S.G. Hays, & C.M. Peven. 1997. Factors that
influence the downstream migration rates of juvenile salmon and steelhead through the
hydroelectric system in the Mid-Columbia River basin. North American Journal of Fisheries
Management, 14:268-282.
Goetz, F.A., E. James, M.E. Moore, & T.P. Quinn. 2015. Comparative migratory behavior and
survival of wild and hatchery steelhead (Oncorhynchus mykiss) smolts in riverine, estuarine,
and marine habitats of Puget Sound, Washington. Environmental Biology of Fishes,
98:357-375.
Healey, M.C. 1991. Life history of Chinook salmon. In: Groot, C., & Margolis, L., eds. Pacific
salmon life histories. Vancouver, BC: University of British Columbia Press, pp. 313-391.
Holm, S. 1979. A simple sequentially rejective multiple test procedure. Scandanavian Journal of
Statistics, 6(2): 65-70.
Jackson, C. D., & G.E. Brown. 2011. Differences in antipredator behaviour between wild and
hatchery-reared juvenile Atlantic salmon (Salmo salar) under seminatural conditions.
Canadian Journal of Fisheries and Aquatic Sciences, 2165: 2157–2165.
James, L. A., & M. B. Singer. 2008. Development of the Lower Sacramento Valley
Flood-Control System: Historical Perspective. Natural Hazards Review, 9(3): 125-135.
Jolly, G.M. 1965. Explicit estimates from capture-recapture data with both death and
immigration-stochastic model. Biometrika 52(1/2):225-247.
Lassettre, N. S., R. R. Harris. 2001. The geomorphic and ecological influence of large woody
debris in streams and rivers. U.C. Berkeley.
Limm, M.P., & M.P. Marchetti. 2009. Juvenile Chinook salmon (Oncorhynchus tshawytscha)
growth in off-channel and main-channel habitats on the Sacramento River, CA using
[31]
Martins, E.G., S.G. Hinch, D.A. Patterson, M.J. Hague, S.J. Cooke, K.M. Miller, M.F. Lapointe,
K.K. English, & A.P. Farrell. 2011. Effects of river temperature and climate warming on
stock-specific survival of adult migrating Fraser River sockeye salmon (Oncorhynchus
nerka). Global Change Biology 17:99-114.
Michel, Cyril J., A.J. Ammann, E.D. Chapman, P.T. Sandstrom, H.E. Fish, M.J. Thomas, A.P.
Klimley, & R.B. MacFarlane. 2012. The effects of environmental factors on the
migratory movement patterns of Sacramento River yearling late-fall run Chinook salmon
(Oncorhynchus tshawytscha). Environmental Biology of Fishes. 96:257-271.
National Marine Fisheries Service (NMFS). 2008. Biological opinion, programmatic
consultation for phase II of the Sacramento River bank Protection Project. Prepared for
the U.S. Army Corps of Engineers. File Number: 151422SWR2007SA00492. July 08,
2008.
Nestler, J.M., P.S. Pompeu, R.A. Goodwin, D.L. Smith, L.G.M. Silva, C.R.M. Baigun, & N.O.
Oldani. 2012. The river machine: a template for fish movement and habitat, fluvial
geomorphology, fluid dynamics and biogeochemical cycling. River Research and
Applications, 28:490-503.
Newman, K.B., & J. Rice. 2002. Modeling the survival of Chinook salmon smolts outmigrating
through the lower Sacramento River system. Journal of the American Statistical
Association, 97(460): 936-993.
Perry, R.W., J.R. Skalski, P.L. Brandes, P.T. Sandstrom, A.P. Klimley, A. Ammann, & B.
MacFarlane. 2009. Estimating survival and migration route probabilities of juvenile
Chinook salmon in the Sacramento-San Joaquin River Delta. North American Journal of
Fisheries Management, 30: 142-156.
Petrosky, C.E., & H.A. Schaller. 2010. Influence of river conditions during seaward migration
and ocean conditions on survival rates of Snake River Chinook salmon and steelhead.
Ecology of Freshwater Fishes, 19: 520-536.
R Core Team. 2014. R: A language and environment for statistical computing. R Foundation for
Statistical Computing, Vienna, Austria. URL:http://R-Project.org.
Sandstrom, P.T., D.L. Smith, & B. Mulvey. 2012. Two-dimensional (2-D) acoustic fish tracking
at river mile 85, Sacramento River, California. U.S. Army Engineer Research and
[32]
Saltus, C.L., A.V. Davis, T.L. Threadgill, A. Hammack, & D.L. Smith. 2013. A guide for
incorporating AdH modeling data into ArcGIS using a NetCDF. U.S. Army Engineer
Research and Development Center, Vicksburg, MS.
Schmetterling, D. A., C. G. Clancy, & T.M. Brandt. 2001. Effects of riprap bank reinforcement
on stream salmonids in the Western United States. Fisheries 26(7):6–13.
Seber, G.A.F. 1965. A note on the multiple-recapture consensus. Biometrika 52(1/2):249-259.
Smith, S. G., W. D. Muir, & J.G. Williams. 2002. Factors associated with travel time and
survival of migrant yearling Chinook salmon and steelhead in the Lower Snake River.
North American Journal of Fisheries Management, 22:385-405.
Sommer, T.R., M.L. Nobriga, W.C. Harrell, W. Batham, & W.J. Kimmerer. 2001. Floodplain
rearing of juvenile Chinook salmon: evidence of enhanced growth and survival. Canadian
Journal of Fisheries and Aquatic Sciences, 58:325-333.
Thériault, V., G.R. Moyer, & M.A. Banks. 2010. Survival and life history characteristics among
wild and hatchery coho salmon (Oncorhynchus kisutch) returns: how do unfed fry differ
from smolt releases? Canadian Journal of Fisheries and Aquatic Sciences, 67(3): 486–
497.
Threadgill, T.L., D.L Smith, S. Duffy, E.A. Hammack, & S. Sanborn. 2014. Mesh Resolution
Comparison – A Technical Report Comparing a Low Resolution Large Domain AdH
Model to a Higher Resolution Nested Domain AdH Model. U.S. Army Corps of
Engineers, Engineer Research and Development Center. ERDC/CHL/TR-12.
U.S. Army Corps of Engineers (USACE). 2007. Sacramento River Bank Protection Project
revetment database. ESRI ArcIMS GIS database prepared for the GIS & Mapping
Section, U.S. Army Corps of Engineers, Sacramento District by Stillwater Sciences,
Berkeley, CA. Contract W91238-07-C-0002.
U.S. Army Corps of Engineers (USACE). 2012. Standard assessment methodology for the
Sacramento River Bank Protection Project, 2010-2012 certification update, final.
Prepared for U.S. Army Corps of Engineers, Sacramento District by Stillwater Sciences,
Berkeley, CA. Contract W91238-09-P-0249 Task Order 3.
U.S. Fish and Wildlife Service (USFWS). 2008. Biological opinion, section 7 programmatic
[33]
Costa, Sacramento, Solano, Sutter, Yolo, Yuba, Placer, San Joaquin, Butte, Colusa,
Glenn and Tehama counties, CA. File Number: 81420-2008-F-0805-1. June 23, 2008.
Welch, D.W., E.L. Rechisky, M.C. Melnychuk, A.D. Porter, C.J. Walters, S. Clements, B.J.
Clemens, R.S. McKinley, & C. Schreck. 2008. Survival of migrating salmon smolts in
large rivers with and without dams. PLoS Biology, 6(10):e265. DOI:
10.1371/journal.pbio.0060265
Wessel, M. L., W.W. Smoker, R.M. Fagen, & J. Joyce. 2006. Variation of agonistic behavior
among juvenile Chinook salmon (Oncorhynchus tshawytscha) of hatchery, hybrid, and
wild origin. Canadian Journal of Fisheries and Aquatic Sciences, 447: 438–447.
Zabel, R.W., & J.G. Williams. 2002. Selective mortality in Chinook salmon: What is the role of
human disturbance? Ecological Applications, 12(1):173-183.
Zanjac, D., S.H. Kramer, N. Nur, & P.A. Nelson. 2013. Holding behavior of Chinook salmon
(Oncorhynchus tshawytscha) and steelhead (O. mykiss) smolts, as influenced by habitat
features of levee banks, in the highly modified lower Sacramento River, California.