R E S E A R C H
Open Access
Analytical and numerical solutions of the
potential and electric field generated by different
electrode arrays in a tumor tissue under
electrotherapy
Ana E Bergues Pupo
1, Juan Bory Reyes
2, Luis E Bergues Cabrales
3*and Jesús M Bergues Cabrales
4,5* Correspondence: [email protected]
3Departamento de Investigaciones, Centro Nacional de
Electromagnetismo Aplicado, Universidad de Oriente, Ave. Las Américas s/n, Santiago de Cuba 90400, Cuba
Full list of author information is available at the end of the article
Abstract
Background:Electrotherapy is a relatively well established and efficient method of tumor treatment. In this paper we focus on analytical and numerical calculations of the potential and electric field distributions inside a tumor tissue in a
two-dimensional model (2D-model) generated by means of electrode arrays with shapes of different conic sections (ellipse, parabola and hyperbola).
Methods:Analytical calculations of the potential and electric field distributions based on 2D-models for different electrode arrays are performed by solving the Laplace equation, meanwhile the numerical solution is solved by means of finite element method in two dimensions.
Results:Both analytical and numerical solutions reveal significant differences between the electric field distributions generated by electrode arrays with shapes of circle and different conic sections (elliptic, parabolic and hyperbolic). Electrode arrays with circular, elliptical and hyperbolic shapes have the advantage of concentrating the electric field lines in the tumor.
Conclusion:The mathematical approach presented in this study provides a useful tool for the design of electrode arrays with different shapes of conic sections by means of the use of the unifying principle. At the same time, we verify the good correspondence between the analytical and numerical solutions for the potential and electric field distributions generated by the electrode array with different conic sections.
Keywords:Electrotherapy, Electric field, Tumor
Background
Electrotherapy is the use of electrical energy as a medical treatment and it was introduced to destroy solid tumors at the end of nineteenth century. Many physicians have success-fully used this therapy, also known as electrochemical tumor therapy, Galvanotherapy and electro-cancer treatment, as a standalone treatment in thousands of cases, with some truly spectacular results [1-4]. Electrotherapy of a low-level direct current is used to treat the cancer (target tissue) through two or more platinum (platinum-iridium 90/10, stainless steel) electrodes placed in or near the malignant tumor. In this therapy, two modes are
used with similar results: voltage mode (voltage keeps constant and direct current intensity varies due to changes in the tumor resistance) and current mode (direct current intensity keeps constant for voltage variations because the tumor resistance is altered). In both modes, the tumor electrical resistance variations may be explained by different bioeffects induced in due to the application of this therapy.
The voltage mode produces less pain in the patient than the one induced for the current mode. The voltage range usually used is 6 to 12 V, the electric quantity often is 80 to 100 coulombs and the time needed to deliver this quantity is 20 to 120 min-utes, in dependence of consistency, size and type of solid tumor. Permanent tissue damages are observed for voltage values equal and higher than 6 V and convenient dis-tributions of electrodes in the tumor, as shown in our current clinical trial (results not shown) and [2-4]. As a result of these studies, 6 V may be considered as an irreversible threshold.
The clinical results carried out up to now reveal that, in both modes, electrotherapy is safe, effective, inexpensive, and induces minimal adverse effects in the organism. Also, it can be applied when the conventional methods (surgery, radiotherapy, chemotherapy and immunotherapy) fail. This anti-tumor therapy has not yet been universally accepted because two main reasons: 1) its antitumor mechanism is not fully understood and 2) it is not standardized [2-4]. The first reason is justified by the diversity of underlying anti-tumor mechanisms, such as: change of pH [5], immune system stimulation [2,4,6], lost of tissue water for electro-osmosis [7], the combined action of the toxic products from electrochemical reactions (fundamentally those in which reactive oxygen species are involved) and immune system stimulation [8], and the increase of the expression of dihydronicotinamide adenine dinucleotide phosphate dehydrogenase (NADPH) oxidase subunits-derived reactive oxygen species, which subsequently induces apoptosis of oral mucosa cancer cells [9], among others. In spite of this, the underlying mechanisms more widely accepted are the changes of pH and the toxic products from the electrochemical reactions. These changes are justified because the regions around the anode and cathode become highly acidic (pH≤3) and highly basic (pH≥10), respectively, when electro-therapy is applied to the tumor area [2-4]. Although Li et al. demonstrated that at the tumor center and areas far from the electrodes the pH is not modified and its value is similar to that measured in the unperturbed tumors (pH varies between 6 and 7) [10]. In a more recent work, Turjanski et al. demonstrated experimentally and theoretically that pH fronts spread in space and time. In particular, between electrodes, two pH fronts evolve expanding towards each other until collision [5]. The second reason is explained by the fact that the dosage guideline is arbitrary and dose-response relationships are not established. Also, different electrode placements are used however, optimal electrode distribution has not been determined. Electrotherapy standardization from the experi-mental point of view is complex, cumbersome, requires excessive handling of animals, and expensive resources and time. As a result, a natural and quick efficient way (few minutes) that may contribute to the standardization of this therapy is the mathematical modeling.
theme because the tumor may significantly be destroyed with the minimum damage in the organism. Different studies reveal that the electric field (electric current density) spatial distribution in tumor and its surrounding healthy tissue strongly depends on the tumor size, electrodes array parameters (applied voltage on the electrodes, number, posi-tioning, size, shape, and polarity of them) and the electric field orientation [11-16]. Also, these distributions depend explicitly on the difference of conductivities of both tissues [13,15,16]. The influence of some of these parameters has experimentally been verified [3,4,6,17-19] and used to compute the power density distribution [20] and to increase the anti-tumor synergism of this therapy by means of the combination of this therapy with the intra-tumor injected saline solution, in agreement with previous results [3,4,21]. The good correspondence between the electric field spatial patterns obtained by experi-mental and theoretically ways has been demonstrated byŠersa et al. by means of the electric current density imaging technique [18]. Also, the influence of the ratio between direct current applied to the tumor and that distributed in it has been included in the Modified Gompertz equation [22].
In previous studies have been showed the two-dimensional (2D) analytical and numerical expressions for the potential and electric field generated by electrode arrays with circular [11,13] and elliptical [14,15] shapes. Jiménez et al. report three-dimen-sional (3D) analytical expressions to calculate the electric current densities in the tumor and its surrounding healthy tissue [16]. It has been reported that electric field (electric current density) inside the tumor increases with the increase of the tumor conductivity respect to that of its surrounding healthy tissue and when all electrodes are completely inserted in tumor [15,16]. These electric field (electric current density) spatial patterns and the conductivities in both tissues may be experimentally measured by means of different imaging techniques [18,23-30].
At present, several researchers have attempted to construct three-dimensional anato-mical models for tissues by means of the finite-element method; however, an exact rea-listic tissue model is very difficult to establish from a computational point of view because it requires a precise knowledge of the electric and physiologic properties of both tissues. These electrical properties are the electrical conductivity, electrical per-mittivity, among others, whereas, the physiological properties are the type, heterogene-ity, size, shape, composition, structure, consistency and water content of the tissue.
Methods
Analytical calculations
Dev et al. [11], Čorović et al. [13] and Aguilera et al. [14,15] show, for the electrostatic problem, that the analytical solution in 2D for the potential and electric field around the needle electrodes can be obtained by solving Laplace equation, if the needle pene-tration depth is larger than the distance between the electrodes. It is worth noting that because any complex analytic function F(z), where z = x + iy, in a given region, is a solution of the Laplace equation
(z)= 0, (1)
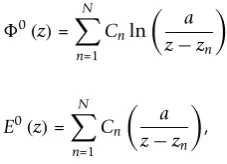
then its real part function, denoted by Re (F(z)), is also solution at the same region. In Equation 1, F(z) is the potential that can be written as a sum of multi-poles of all electrodes [11]. The higher terms in multipole series are neglected with respect to the leading terms of all electrodes if the distance between electrodes is larger than the electrode radius. As a result, we can use the first term of this sum (lead order approxi-mation, F0(z)) to calculate the electric field strength in lead order approximation, named E0(z) by means of▽F0(z). The details for the calculations ofF0(z) and E0(z) are reported in [11,13-15] and their analytical expressions are given by
0(z)=
N
n=1
Cnln
a z−zn
, (2)
E0(z)=
N
n=1
Cn
a z−zn
, (3)
where N represents the total number of electrodes placed on the array and z is the position of the point where the calculations are made. a is the electrode radius and d the smallest distance between two consecutive electrodes with alternate polarities.
zn=rneiφn is the position of the n-th electrode in the array. The coefficients Cnin (3)
are calculated from the boundary conditions of the electrodes and given in [11,13-15]. In Equation (2), a constant term is added if the number of electrodes is odd in order to satisfy conservation of the current, as shown in [13].
The equations in polar coordinates for the conic sections (ellipse, parabola and hyperbola) may be obtained by using the unifying principle for the electrode position zn. In this way, rncan easily be shown to have a general expression in polar
coordi-nates (common in form of the three curves) if the origin of coordicoordi-nates is located in the conic focus, given by
rn= me
1±ecosθn, (4)
where m is the distance between the focus (F) and the directrix line (D), as shown in Figure 1a. The straight line passing through F and perpendicular to D is assumed to be the prime direction, from which the angles are measured. rnyθnare the polar
the unifying principle for the conic sections allows the possibility to obtain the polar equations of all three curves (4), it should be remarked that in the case of hyperbola this equation represents only one of its branches (that whose focus is at the origin), rather than the entire curve. The plus sign corresponds to the left branch of the hyperbola.
Figure 1b shows electrode arrays with different shapes: circle (Configuration I, e = 0), ellipse (Configuration II, e = 0.6), parabola (Configuration III, e = 1) or hyperbola (Configuration IV, e = 2). The expressions for the potential and electric field intensity obtained for Configuration 1 are explicitly given in [11,13] (for rn = b: b is the circle
radius) and [14,15] (for rn= b1 = b2 = b: b1 and b2 are the major and minor radius of
the ellipse, respectively). It is important to point out that the expressions reported in [11,13-15] are referred to the origin of coordinates in the conic center. Two additional electrode arrays are used: one elliptical with e = 0.45 (Configuration II-1) and another hyperbolic with e = 3 (Configuration IV-1), keeping constant parameter m in order to evaluate the influence of parameter e. Table 1 shows the parameters e and m of each one of these configurations.
Following the ideas ofČorovićet al. [13], we assume that the ratio U/d = 0.115 V/mm is a constant, where U is the potential difference between two nearest electrodes. As a result, the potential in each electrode (V0) is ± V0= U/2. Table 2 shows the values of d,
U and V0for each one of these configurations. We fix the electrode radius (a = 0.215
mm) and the number of the electrodes (six electrodes with alternate polarities). The angular positions of these six electrodes (θ), with respect to the center of the conic, are fixed inθ= 0, 60, 120, 180, 240 and 300° (for the circle and the ellipse), andθ= 0, 45, 135, 180, 225 and 315° (for the hyperbola). In the case of the parabola, the angular posi-tions are referred to vertex inθ= 60, 65, 75, 285, 295 and 300°. In order to calculate the equation (4), these positions are transformed to those with respect to the focus F.
Numerical Calculations
Numerical calculations are performed by using a finite element method for each elec-trode array in 2D. The elecelec-trodes are placed inside a rectangle representing a homoge-neous tissue having a constant conductivity. For the analytical and numerical calculations, the electrodes are completely inserted in the tumor because the higher electric field strength (electric current density) is induced in it with the minimum damage in the surrounding healthy tissue [15,16].
A constant voltage is assigned to the boundary representing the electrodes surface. Isolating boundary conditions are assigned to the outer boundaries of the rectangle. The dimension of the outer square is 20 mm > 2d in all models, since 2d is the error due to the finite size of the model is negligible. The values of the parameters e, m, a, electrode potential and angular position of each electrode are the same as those used for the analytical calculations. Model geometries are meshed by triangular finite ele-ments. The final mesh is obtained by an adaptive method using a relative tolerance cri-terion of 0.001.
The maximum (Emax, in V/mm), minimum (Emin, in V/mm) and norm (EE, in V/mm)
values are used to quantify the differences between the electric field distributions gener-ated for each electrodes array. Emaxand Eminrepresent the local characterization of the
electric field and EE is the global characterization of it. Indeed, EE is the sum of the local electric field intensity over all points in the target tissue, given by
Table 1 Values of eccentricity (e) and distance between the focus and the directrix (m)
Types of electrode configurations Parameters of the electrode array
e m (mm)
Configuration I (circle) 0
-Configuration II (ellipse) 0.6 7
Configuration II-1 (ellipse) 0.45 7
Configuration III (parabola) 1 7
Configuration IV (hyperbola) 2 7
Configuration IV-1 (hyperbola) 3 7
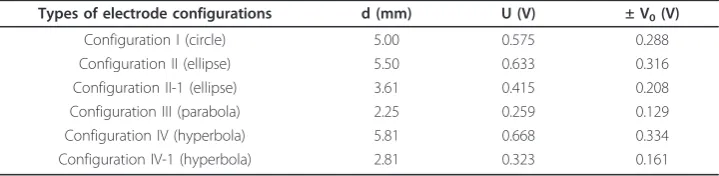
Table 2 Values of the potential (U) and distance between two closer electrodes (d) for each electrode configuration
Types of electrode configurations d (mm) U (V) ± V0(V)
Configuration I (circle) 5.00 0.575 0.288
Configuration II (ellipse) 5.50 0.633 0.316
Configuration II-1 (ellipse) 3.61 0.415 0.208
Configuration III (parabola) 2.25 0.259 0.129
Configuration IV (hyperbola) 5.81 0.668 0.334
Configuration IV-1 (hyperbola) 2.81 0.323 0.161
EE=
p
k=1
Ek
2
. (5)
where Ekis the local electric field intensity in each point k (k = 1, ..., p) and p is the
total number of points in the target tissue (p = 32 248).
Finite element method and the expressions (2-5) are implemented in the MATLAB software, version R2011a (License number: 625596. San Jorge University, Spain). The analytical and numerical calculations are performed on a personal computer Intel Pen-tium 4, dual-core processor 2.16 GHz CPU and 4 GB RAM. Each calculation takes approximately one minute.
Results
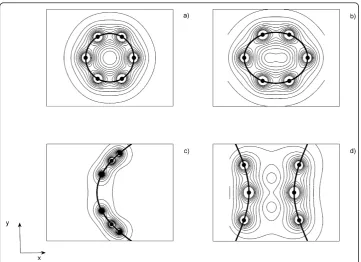
Figure 2 shows the electric field distributions for the electrode array with different shapes: circle (Figure 2a), ellipse (Figure 2b), parabola (Figure 2c) and hyperbola (Figure 2d). The isolines are drawn for the electric field values from 0 to 0.115 V/mm with a constant step of 0.01 V/mm. It illustrates how the electric field distributions in the tissue depend on the shape of the electrodes array and that the highest electric field strengths are obtained in the neighborhood of the electrodes. The electric field strength falls even more rapidly towards the tumor edges in the perpendicular direction to the plane in which the electro-des are. Also, these figures reveal that the electric field between the electroelectro-des is non-uniform whereas in the central region is non-uniform.
Table 3 shows Emax, Emin and EE values for each one of the configurations above
mentioned. These three quantities are calculated over all nodes within the work region. This table and Figure 2 evidence that Configurations I, II and IV concentrate more the electric field lines in the target tissue and show the higher values of these quantities. In contrast, Configuration III concentrates less these lines in it and shows the smallest values of EE and Emax. This configuration concentrates the electric field lines mainly
around the electrodes.
The comparison between the electrode elliptical arrays (Configurations II and II-1) and electrode hyperbolic arrays (Configurations IV and IV-1) evidences that there exist differences in the electric field distributions when parameter e varies, keeping constant parameter m, the type of electrode configuration, the angular position and the polarity of the electrodes. It is easy to check that electric field distribution generated for each conic section changes when the electrode polarity and values of the parameter m are varied (results not shown).
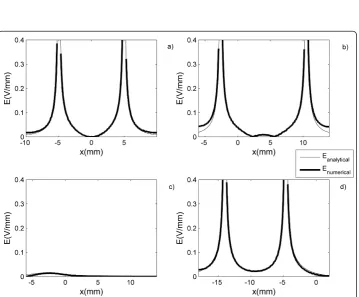
both solutions increases with the increase |x|. Similar results are observed in any directions.
Discussion
In this paper we do not pretend to discuss whether the analytical solution is better than numerical one or vice versa. The results demonstrate that the analytical calcula-tions shown in [11,13-15] can be extended also to the electrode configuracalcula-tions used in this paper. This mathematical approach is simple and constitutes a rapid and simple method for visualizing both potential and electric field distributions inside the target tissue without using special software for numerical modeling. That is why, we use the analytical method to know the exact dependence of the potential and electric field dis-tributions in function of the electrodes array parameters. The validity of this method from the mathematical point of view is verified by the good agreement between analy-tical and numerical solutions for each electrodes configuration in the area between the
Figure 2Electric field spatial patterns. Analytical results of the electric field distributions for the electrodes configurations with shapes of a) circle, b) ellipse, c) parabola and d) hyperbola defined in Fig. 1b.
Table 3 Values of the maximum electric field strength (Emax), minimum electric field strength (Emin) and electric field norm (EE) for each electrode configuration
Types of electrode configurations Emax
(V/mm)
Emin
(V/mm)
EE (V/mm)
Configuration I (circle) 37.5855 0.0000 44.9545
Configuration II (ellipse) 37.8268 0.0002 39.7075
Configuration II-1 (ellipse) 8.3062 0.0001 17.6613
Configuration III (parabola) 3.2166 0.0000 10.0745
Configuration IV (hyperbola) 30.1479 0.0002 32.7382
Figure 3Comparison of the analytical and the numerical solutions. The analytical and the numerical solutions of the electric potential distribution along y = 0 direction generated by electrode arrays with shapes of a) circle, b) ellipse, c) parabola and d) hyperbola defined in Fig. 1b.
electrodes. From the biological point of view, this validity may be reinforced by means of an in vivo(ex vivo) tissue model.
We use 2D numerical and analytical models in order to compare the potential and electric field strength, for different electrode configurations, in the central plane of a more general 3D model. The 2D results are a good approximation of local electric field distribution in 3D models for needle electrodes since these are usually long and deeply inserted in tissue, as is reported in [13]. Also, these results evidence that the electric field distributions depend markedly on the shape of electrodes array with respect to target tissue. This is possible by means of the use of the unifying principle for the conic sections that allows the knowledge of the exact geometry of the electrode array in a very clever way and therefore U/d ratio facilities the comparison between the different studies reported. This ratio is an approximation widely used to estimate the electric field intensity inside the tumor.
Emax, Eminand EE values may be useful to propose electrode configurations more
feasible for tumor treatment. Configurations I, II and IV concentrate more the electric field lines in the target tissue between the electrodes. As a consequence, these may be suggested for the solid tumors treatment with electrotherapy and other electric field based therapies, as electrochemotherapy and irreversible tissue ablation. For this, we should keep in mind that electric field strength should be above a certain irreversible threshold value of the electric field in order to cause permanent damages on the target tissue leading to its partial or complete destruction. However, it should not be exposed to excessively high electric field to avoid damages to the surrounding healthy tissue.
At first sight, Configuration III is un-useful for the solid tumors treatment if we keep in mind that it concentrates less the electric field lines in the tumor and shows low values of EE and Emax(10 times lower than that obtained by Configurations II and IV).
We have observed that the tumor complete remission and the conversion of an inoper-able tumor in operinoper-able (patients with breast cancer) are reached, independently of the tumor histological variety for voltage strengths below 6 V. In this case, we make a con-venient distribution of the electrodes in the tumor combined with the intra-tumor injected saline solution.
A potential clinical application of Configuration III may be in the selective treatment of the tumor-healthy tissue interface (or tumor border), which is a complex region due to the simultaneous presence of both cancerous and healthy cells and other cellular components.
when the tumor differentiates more than its surrounding healthy tissue, as previously reported by other authors [13,15].
Also, Configuration III may be used for cancer treatment if we use symmetric para-bolic configurations (similarly as for Configuration IV) and/or combining it with other pieces of different conic sections and the electrode arrays actually used. From the elec-trode configurations above mentioned, it is possible to propose other more complex electrode arrays: i) two elliptical pieces with different eccentricities; ii) one elliptical piecewise of eccentricity e with the parabola; iii) one elliptical piecewise of eccentricity given with one branch of the hyperbola; iv) the parabola with one branch of the hyper-bola of eccentricity e; and vi) two branches of hyperhyper-bola with different eccentricities). For this, we fix the origin (vertex) in the focus of one piecewise the ellipse and hyper-bola (parahyper-bola) and thus express the equation of the other piecewise of another conic section with respect to this frame of reference (origin) by means of a translation to the focus of the first conic. This allows the use of Configurations I, II, III and IV, though these have not been used in the preclinical and clinical studies.
The above mentioned is important in the therapeutic planning previous to the therapy application because we may choose the polarity and positioning of the electro-des, as well as the shape of the electrodes array, which have a marked influence in the potential and electric field distributions. These electric field distributions generated for these electrode arrays may be experimentally verified by means of diverse imaging tech-niques as the Electric Current Density Imaging [18,27], Electrical Impedance Tomogra-phy [28], Magnetic Resonance Electrical Impedance TomograTomogra-phy [29], Magnetic Induction Tomography, Magnetoacoustic Tomography and Magnetoacoustic Tomogra-phy with Magnetic induction [30]. Also, for showing the plausibility of this mathematical approach, anin vivomodel may be implemented in order to evaluate the influence of the parameters of these electrode arrays in the tumor growth kinetic, aspect that may be theoretically corroborated, as previously reported by Cabrales et al. [22].
We are not aware of the use of the conic sections in electrotherapy (electrochemother-apy and ablation ther(electrochemother-apy) for the cancer, but the use of these is feasible in the preclinical and clinical studies. In patients with cancer, these electrode configurations should be used in order to evaluate the safety (phase I of a clinical trial), adverse effects and toxi-city (phase II of a clinical trial), and effectiveness (phase III of a clinical trial). In clinical studies, the electrodes insertion methodology for Configurations I, II, III and IV is simi-lar to that used at present (electrodes inserted into the base perpendicusimi-lar to the tumor long axis) [1-6,17,19]. The essential steps of this methodology are:
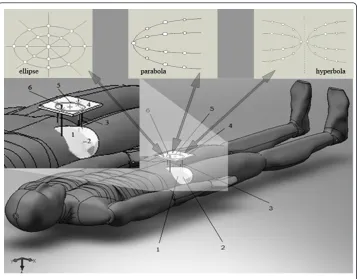
1. The tumor size is determined by clinic and/or any imaging techniques (ultrasound, Computer Tomography or Imaging Nuclear Magnetic Resonance). Plastic cannulae with style are inserted, through holes (printed in a plastic board and distributed in a family of conic sections that completely cover the tumor size), as shown in Figure 5 for an electrode elliptical array (isometric projection). This is also valid for electrode arrays with other shapes (circle, parabola and hyperbola).
tumor destruction with the minimum damage in the organism. Finally, the electrodes are connected to the negative poles (the cathodes) of a custom built constant voltage (current) generator, and the other needles are connected to the positive poles (the anodes).
The results of this study suggest that different physical and chemical quantities, such as heat, temperature, pH fronts and electrochemical reactions around electrodes may be calculated from the electric field generated by electrode arrays with shapes of coni-cal sections, which may contribute to the understanding of the electrotherapy antitu-mor mechanisms, as previously report other authors [5,10,18,20,32].
Conclusion
In conclusion, the mathematical approach presented in this study is an extension of the works of Dev et al. [11],Čorovićet al. [13] and Aguilera et al. [14,15] and constitu-tes a useful tool for the design of electrode arrays with different shapes of conic sec-tions by means of the use the unifying principle. Also, there is a good correspondence between the analytical and numerical solutions for the potential and electric field dis-tributions generated by the electrode array with different conic sections.
Acknowledgements
This work was partially supported by Ministry of Superior Education of the Republic of Cuba under the grant #6.176. The authors acknowledge the San Jorge University for economical support of this research.
The authors wish to thank Mario Hechavarría Sánchez, Emilio Suárez and Leonardo Mesa Torres for their technical assistance, and the anonymous reviewer # 2 of Mathematics and Computer in Simulation magazine (reference [15]),
who suggested the realization of this work. Also, we wish to thank in a special way the reviewers for their invaluable recommendations and suggestions.
Author details
1
Departamento de Física, Facultad de Ciencias Naturales, Universidad de Oriente, Patricio Lumumba s/n, Santiago de Cuba 90500, Cuba.2Departamento de Matemática, Facultad de Matemática y Computación, Universidad de Oriente, Patricio Lumumba s/n, Santiago de Cuba 90500, Cuba.3Departamento de Investigaciones, Centro Nacional de Electromagnetismo Aplicado, Universidad de Oriente, Ave. Las Américas s/n, Santiago de Cuba 90400, Cuba. 4
Computer Engineering Faculty, San Jorge University, Walqa Technological Park, Félix de Azara Building, 330a National Road, km 556, 22197. Cuarte, Spain.5Pharmacy Department, Faculty of Health Sciences, San Jorge University. Autov. A-23 Zaragoza-Huesca, km. 510, 50830 Villanueva de Gállego, Zaragoza, Spain.
Authors’contributions
JBR developed the mathematical idea on which this manuscript is based. All the computer simulations and results analysis were making by AEBP. LEBC and JMBC supervised this research and helped in the results analysis. Also, all authors read and approved the final version of the manuscript.
Competing interests
The authors declare that they have no competing interests.
Received: 21 May 2011 Accepted: 24 September 2011 Published: 24 September 2011
References
1. Yoon DS, Ra YM, Ko DG, Kim YM, Kim KW, Lee HY, Xin YL, Zhang W, Li ZH, Kwon HU:Introduction of electrochemical therapy (EChT) and application of EChT to the breast tumor.J Breast Cancer2007,10:162-168.
2. Cabrales LEB:The electrotherapy a new alternative for the treatment of the malignant tumors. Preclinical study.
PhD thesisHavana University, Biology Department; 2003.
3. Yuling X, Zhao H, Zhang W, Liang C, Wang Z, Liu G:Electrochemical Therapy of Tumors.Bioelectromagnetic Medicine
Marcel Dekker Inc., New York; 2004.
4. Jarque MV, Mateus MAO, Jing-hong L, Cabrales LEB, Palencia FS, Ciria HMC, Brooks SCA, Salas MF:First clinical experiences in Cuba over the use of electrotherapy in four patients with superficial malignant solid tumors.Rev MEDISAN2007,11:1-13.
5. Turjanski P, Olaiz N, Abou-Adal P, Suarez C, Risk M, Marshall G:pH front tracking in the electrochemical treatment (EChT) of tumors: Experiments and simulations.Electrochimica Acta2009,54:6199-6206.
6. Ciria HMC, Quevedo MCS, Cabrales LEB, Bruzón RNP, Salas MF, Peña OG, González TR, López DS, Flores JLM:Antitumor effectiveness of different amounts of electrical charge in Ehrlich and fibrosarcoma Sa-37 tumors.BMC Cancer2004, 4:1-10.
7. Vijh AK:Phenomenology and Mechanisms of Electrochemical Treatment (ECT) of Tumors.Modern aspects of electrochemistry2006,39:231-275.
8. Cabrales LEB, Ciria HMC, Bruzón RNP, Quevedo MCS, Aldana RH, González LMO, Salas MF, Peña OG:Electrochemical treatment of mouse Ehrlich tumor with direct electric current: Possible role of reactive oxygen species and antitumoral defense mechanisms.Bioelectromagnetics2001,22:316-322.
9. Wartenberg M, Wirtz N, Grob A, Niedermeier W, Hescheler J, Peters SC, Sauer H:Direct current electrical fields induce apoptosis in oral mucosa cancer cells by NADPH oxidase-derived reactive oxygen species.Bioelectromagnetics2008, 29:47-54.
10. Li KH, Xin YL, Gu YN, Xu BL, Fan DJ, Ni BF:Effects of Direct Current on Dog Liver: Possible Mechanisms for Tumor Electrochemical Treatment.Bioelectromagnetics1997,18:2-7.
11. Dev BS, Dhar D, Krassowska W:Electric field of a six-needle array electrode used in drug and DNA delivery in vivo: analytical versus numerical solution.IEEE Trans Biomed Eng2003,50:1296-1300.
12. Šel D, Mazeres S, Teissié J, MiklavčičD:Finite-element modeling of needle electrodes in tissue from the perspective of frequent model computation.IEEE Trans Biomed Eng2003,50:1221-1232.
13. ČorovićS, Pavlin M, MiklavčičD:Analytical and numerical quantification and comparison of the local electric field in the tissue for different electrode configurations.Biomed Eng Online2007,6:37-50.
14. Aguilera AR, Cabrales LEB, Ciria HMC, Pérez YS, Oria ER, Brooks SA:Distributions of the potential and electric field of an electrode elliptic array used in electrotherapy: Analytical and numerical solutions.Math Comput Simul2009, 79:2091-2105.
15. Aguilera AR, Cabrales LEB, Ciria HMC, Pérez YS, González FG, González MM, Ortíz LZ, Palencia FS, Salas MF, Bestard NR, González GS, Cabrales IB:Electric current density distribution in planar solid tumor and its surrounding healthy tissue generated by an electrode elliptic array used in electrotherapy.Math Comput Simul2010,80:1886-1902. 16. Jiménez RP, Pupo AEB, Cabrales JMB, Joa JAG, Cabrales LEB, Nava JJG, Aguilera AR, Mateus MAO, Jarque MV,
Brooks SCA:3D stationary electric current density in to spherical tumor treated with low direct current.
Bioelectromagnetics2011,32:120-130.
17. Ren RL, Vora N, Yang F, Longmate J, Wang W, Sun H, Li JR, Weiss L, Staud C, McDougall JA, Chou CK:Variations of dose and electrode spacing for rat breast cancer electrochemical treatment.Bioelectromagnetics2001,22:205-211. 18. Serša I, Beravs K, Dodd NJF, Zhao S, MiklavčičD, Demsar F:Electric current density imaging of mice tumors.Magn
Reson Med1997,37:404-409.
19. Chou CK, McDougall JA, Ahn C, Vora N:Electrochemical Treatment of Mouse and Rat Fibrosarcomas with Direct Current.Bioelectromagnetics1997,18:14-24.
21. Lin XZ, Jen CM, Chou CK, Chou CS, Sung MJ, Chou TC:Saturated saline enhances the effect of electrochemical therapy.Dig Disease and Sciences2000,45:509-514.
22. Cabrales LEB, Aguilera AR, Jiménez RP, Jarque MV, Ciria HMC, Reyes JB, Mateus MAO, Palencia FS, Ávila MG: Mathematical modeling of tumor growth in mice following low-level direct electric current.Math Comput Simul
2008,78:112-120.
23. Foster KR, Schwan HP:Dielectric properties of tissues.InHandbook of Biological Effects of Electromagnetic Fields..2 edition. Edited by: Polk C, Postow E. Florida: CRC Press LCC; 1996:68-70.
24. Foster KR:Dielectric properties of tissues.InThe Biomedical Engineering Handbook.Edited by: Bronzino JD. Florida: CRC Press LCC; 2000:1385-1394.
25. MiklavčičD, Pavšelj N, Hart FX:Electric Properties of Tissues.Wiley Encyclopedia of Biomedical EngineeringJohn Wiley & Sons, New York; 2006.
26. Schwan HP, Kay CF:The conductivity of living tissues.Ann NY Acad Sci1957,65:1007.
27. Halter RJ, Hartov A, Heaney JA, Paulsen KD, Schned AR:Electrical impedance spectroscopy of the human prostate.
IEEE Trans Biomed Eng2007,54:1321-1327.
28. Saulnier GJ, Blue RS, Newell JC, Isaacson D, Edic PM:Electrical impedance tomography.IEEE Sig Proc Mag2001, 18:31-43.
29. Seo JK, Kwon O, Woo EJ:Magnetic resonance electrical impedance tomography (MREIT): conductivity and current density imaging.J Phys: Conference Series2005,12:140-155.
30. Li X, Xu Y, He B:Imaging electrical impedance from acoustic measurements by means of magnetoacoustic tomography with magnetic induction (MAT-MI).IEEE Trans on Biomed Eng2007,54:323-330.
31. Cabrales LEB, Nava JJ, Aguilera AR, Joa JAG, Ciria HMC, González MM, Salas MF, Jarque MV, González TR, Mateus MAF, Brooks SCA, Palencia FS, Zamora LO, Quevedo MCC, Seringe SE, Cutié ES, Cabrales IB, González GS:Modified Gompertz equation for electrotherapy murine tumor growth kinetics: predictions and new hypotheses.BMC Cancer2010, 10:1-14.
32. Nilsson E, Fontes E:Mathematical modelling of physicochemical reactions and transport processes occurring around a platinum cathode during the electrochemical treatment of tumors.Bioelectrochemistry2001,53:213-224.
doi:10.1186/1475-925X-10-85
Cite this article as:Bergues Pupoet al.:Analytical and numerical solutions of the potential and electric field generated by different electrode arrays in a tumor tissue under electrotherapy.BioMedical Engineering OnLine
201110:85.
Submit your next manuscript to BioMed Central and take full advantage of:
• Convenient online submission
• Thorough peer review
• No space constraints or color figure charges
• Immediate publication on acceptance
• Inclusion in PubMed, CAS, Scopus and Google Scholar
• Research which is freely available for redistribution