196
Copyright © 2018. IJEMR. All Rights Reserved.
Volume-8, Issue-4, August 2018
International Journal of Engineering and Management Research
Page Number: 196-201
DOI:
doi.org/10.31033/ijemr.v8i4.13241
Financial Performance Analysis of Selected Private Sector Banks in India
K.Rajarajeswari1 and Dr. S.B. Gayathri2 1
Ph.D – Research Scholar, Department of Commerce, NGM College, Pollachi, INDIA 2
Associate Professor & Head, Department of Commerce, NGM College, Pollachi, INDIA
1Corresponding Author: [email protected]
ABSTRACT
The performance of the banking system has been widely recognized as an important element for economic growth and for enhancing the economic and financial system buoyancy in facing financial crisis. In fact, such a vital role in the economy has made banks to be considered as one of the most strained kinds of businesses in the globe as they are subject to close scrutiny since banks will otherwise be counterproductive and severely damage the economy of a country. Efficient and profitable banks maximize shareholders’ value and encourage the shareholders to make additional investments. As a result of which, more employment opportunities will be created and more goods and service will be produced and ultimately bring about economic growth in which private and public sector banking institutions play equal role. The present study analyses the financial performance of selected private banks in India with the help of correlation analysis by considering return on total assets as the independent variable.
Keywords-- Banking, economic growth, Financial crisis, Economy of a country, Shareholders’ value, Correlation analysis, Return on total assets
I.
INTRODUCTION
Banking Sector reforms were initiated to upgrade the operating standard health and financial soundness of the banks. The Government of India setup the Narasimham Committee in 1991, to examine all aspects relating to structure, organization and functioning of the Indian banking system the recommendations of the committee aimed at creating at competitive and efficient banking system. Another committee which is Khan Committee was instituted by RBI in December, 1997 to examine the harmonization of the role and operations of development financial institutions and banks. It submitted its report in 1998.
At present, financial regulation in India is oriented towards product regulation, i.e. each product is separately regulated. For example, fixed deposits and other banking products are regulated by the Reserve Bank of India (RBI), small savings products by the Government of India (GoI) etc..The enactment of the Banking Laws Amendment Act 2012 is expected to make the regulatory and supervisory powers of the RBI more effective and facilitate banks in raising funds from the capital market required for expansion of banking business. It will also facilitate finalization of guidelines by the RBI for providing licenses for new banks, which is essential for achieving the objective of financial inclusion in the current perspective.
II.
REVIEW OF LITERATURE
Karunakar et al. (2008) reported that the efficiency of a bank is not reflected only by the size of its balance sheet but also the level of return on its assets. The study emphasized that the NPAs do not generate interest income for banks but at the same time banks are required to provide provisions for NPAs from their current profits. The study revealed that NPAs have deleterious impact on the return on assets and contributes significantly to credit risk concentration in the Indian banking sector.
197
Copyright © 2018. IJEMR. All Rights Reserved.
tend to increase both their ratio of capital-to-risk weighted assets and levels of risk.
Ho and Yusoff (2009) studied the credit risk management practices in Malaysian commercial banks and reported that the financial institutions believed in risk mitigation and managed their credit risk through better quality assets and human resources. The research also noted that the financial institutions utilize a variety of mitigations techniques to avoid credit risk. The study concluded that no single strategy is superior in covering all exposures, but combinations of a variety of techniques were effective in the mitigation of credit risk in the Malaysian commercial banks.
Aman and Zaman (2012) studied the credit risk performance of private and state owned banks in Pakistan and found that the private sector banks were performing better with regards to the credit risk compared to the state owned banks. The study by analyzing data for a fifteen year period from 1990 to 2005 reported that the private sector banks were efficient in managing their credit risk and suggested that the public sector banks need to improve their efficiency of credit risk management.
III.
RESEARCH METHODOLOGY
The financial data and relevant information required for the study are drawn from the various secondary source. The Prowess' corporate databases developed by CMIE (Centre for Monitoring Indian Economy) and CLP (Capital Line Plus) have been used as principal sources. The other relevant data are collected from Journals, Magazines, Dailies namely The Financial Express and The Economic Times. According to the prowess corporate database developed by CMIE, (Centre for Monitoring Indian Economy) there are 17 private sector banks operating India
and listed in both Bombay Stock Exchange (BSE) and National Stock Exchange (NSE). Out of 17 Private sector banks 6 banks are having the net profit above 2000 crores and 10 years data are available for all the 6banks. So they were selected as sample units for the present study. The following are the sample banks which have been considered for the present study. HDFC Bank, ICICI Bank Axis Bank Yes Bank IndusInd Bank and Kotak Mahindra bank.
IV.
STATISTICAL ANALYSIS
Correlation analysis is one of the most common and most useful statistics. A correlation is a single number that describes the degree of relationship between two variables. The most familiar measure of dependence between two quantities is the Pearson product-moment correlation coefficient, or "Pearson's correlation." It is obtained by dividing the covariance of the two variables by the product of their standard deviations. In the present study the relationship between return on total assets and Advances to Assets, Debt - Equity Ratio, Investments to Total Assets, Current Ratio, Quick Ratio Investments Deposit Ratio, Credit + Investments Deposit Ratio,Fixed Assets to Total Assets, Return on Advances, Interest Income to Total Assets, Other Liabilities to Total Assets, Return on Networth, Operating Expenses to Total Income, Interest Expended to Total Expenses, Interest expended to interest earned, Spread to Working Fund, Burden to Working Fund, Interest Income to Total Income, Non-Interest Income to Working Fund Non Operating Expenses to Total Assets, Deposits to Total Assets, Liquid Assets to Total Assets, Provision & Contingencies to Total Assets, Cash Deposit Ratio, Investments to Advances and Interest cover.
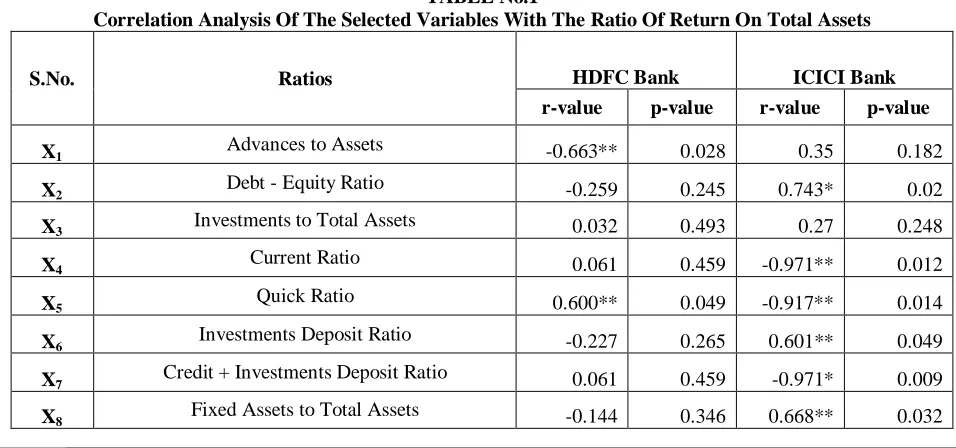
TABLE No.1
Correlation Analysis Of The Selected Variables With The Ratio Of Return On Total Assets
S.No. Ratios HDFC Bank ICICI Bank
r-value p-value r-value p-value
X1 Advances to Assets -0.663** 0.028 0.35 0.182
X2 Debt - Equity Ratio -0.259 0.245 0.743* 0.02
X3 Investments to Total Assets 0.032 0.493 0.27 0.248
X4 Current Ratio 0.061 0.459 -0.971** 0.012
X5 Quick Ratio 0.600** 0.049 -0.917** 0.014
X6 Investments Deposit Ratio -0.227 0.265 0.601** 0.049
X7 Credit + Investments Deposit Ratio 0.061 0.459 -0.971* 0.009
198
Copyright © 2018. IJEMR. All Rights Reserved.
X9 Return on Advances -0.007 0.492 0.717** 0.023
X10 Interest Income to Total Assets 0.482 0.097 0.421 0.132
X11 Other Liabilities to Total Assets -0.014 0.483 0.656** 0.034
X12 Return on Networth -0.785** 0.015 0.116 0.4
X13 Operating Expenses to Total Income -0.532 0.064 0.544 0.069
X14 Interest Expended to Total Expenses -0.708** 0.021 0.156 0.358
X15 Interest expended to interest earned -0.332 0.177 0.012 0.512
X16 Spread to Working Fund -0.023 0.474 -0.534 0.063
X17 Burden to Working Fund -0.383 0.141 -0.801* 0.014
X18 Interest Income to Total Income 0.065 0.454 -0.147 0.342
X19 Non-Interest Income to Working Fund 0.518 0.081 -0.028 0.468
X20 Non Operating Expenses to Total Assets 0.305 0.218 0.175 0.339
X21 Deposits to Total Assets 0.363 0.755 0.689 0.54
X22 Liquid Assets to Total Assets -0.937 0.408 -0.337 0.753
X23 Provision & Contingencies to Total Assets -0.032 0.979 -1.279 0.265
X24 Cash Deposit Ratio -1.217 0.299 -0.689 0.527
X25 Investments to Advances -1.145 0.324 -0.148 0.891
X26 Interest cover 33.393 0.012 1.428 0.228
**significant at 5% level. *Significant at 1% level
The correlation coefficient matrices of the selected variables with the dependent variable, i.e., Return on Total Assets of selected Banks for the periods from 2006-2007 to 2015-2016 .
In HDFC Bank four variables namely X1(Advances to Assets),X5(Quick Ratio ), X 12(Return on Networth), X14(Interest Expended to Total Expenses)are having significant correlation with profitability of the bank. The variables X5(Quick Ratio)is positively correlated to the
profitability of the bank where as remaining variables have negative correlation.
In ICICI Bank, nine variables namely X2(Debt - Equity Ratio),X4(Current Ratio), X5(Quick Ratio),X6(Investments Deposit Ratio),X7(Credit + Investments Deposit Ratio),X8(Fixed Assets to Total Assets) , X9(Return on Advances) ,X11(Other Liabilities to Total Assets) , X17(Burden to Working Fund) are having significant correlation with profitability of the bank. The variables X2(Debt - Equity Ratio), X6(Investments Deposit Ratio), X8(Fixed Assets to Total Assets) , X9(Return on Advances) , X11(Investments Turnover Ratio) are positively correlated to the profitability of the bank where as the remaining variables have negative correlation.
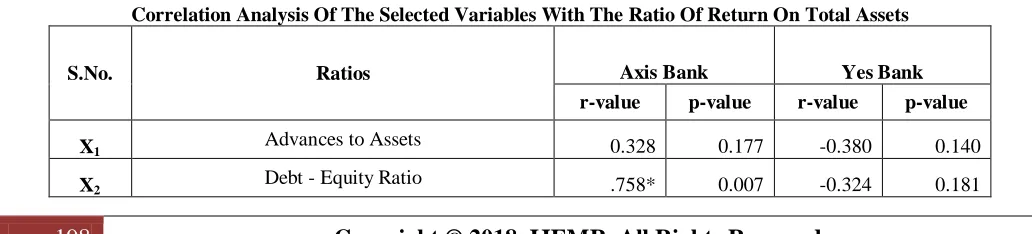
TABLE No.2
Correlation Analysis Of The Selected Variables With The Ratio Of Return On Total Assets
S.No. Ratios Axis Bank Yes Bank
r-value p-value r-value p-value
X1 Advances to Assets 0.328 0.177 -0.380 0.140
199
Copyright © 2018. IJEMR. All Rights Reserved.
X3 Investments to Total Assets .585** 0.042 0.037 0.460
X4 Current Ratio -.613** 0.021 .832* 0.001
X5 Quick Ratio -.659** 0.014 .835* 0.001
X6 Investments Deposit Ratio .679** 0.018 -0.397 0.128
X7 Credit + Investments Deposit Ratio -.649** 0.021 .814 0.001
X8 Fixed Assets to Total Assets .618** 0.020 -0.456 0.093
X9 Return on Advances 0.474 0.083 .618** 0.016
X10 Interest Income to Total Assets -0.275 0.221 -.719* 0.009
X11 Other Liabilities to Total Assets 0.360 0.154 0.515 0.064
X12 Return on Networth .503** 0.044 -.584** 0.038
X13 Operating Expenses to Total Income .609** 0.028 -0.434 0.105
X14 Interest Expended to Total Expenses .805* 0.001 -0.158 0.332
X15 Interest expended to interest earned 0.000 0.000 -0.116 0.375
X16 Spread to Working Fund -0.158 0.331 -.629** 0.024
X17 Burden to Working Fund -0.077 0.417 -0.255 0.238
X18 Interest Income to Total Income 0.513 0.065 0.441 0.101
X19 Non-Interest Income to Working Fund -.561** 0.044 -.853* 0.000
X20 Non Operating Expenses to Total Assets -0.254 0.239 .724* 0.009
X21 Deposits to Total Assets
-.067 .949 -.067 .949
X22 Liquid Assets to Total Assets
-.430 .682 -.430 .682
X23 Provision & Contingencies to Total Assets
.649 .540 .649 .540
X24 Cash Deposit Ratio
-.170 .871 -.170 .871
X25 Investments to Advances
1.071 .325 1.071 .325
X26 Interest cover
.756 .478 .756 .478
**significant at 5% level.*Significant at 1% level
In Axis Bank Eleven variables namely X2(Debt - Equity Ratio), X 3(Investments to Total Assets), X4(Current Ratio), X5(Quick Ratio), X 6(Investments Deposit Ratio) , X7(Credit + Investments Deposit Ratio), X8(Fixed Assets to Total Assets), X12(Return on Networth), X 13(Operating Expenses to Total Income) , X14 (Interest Expended to Total Expenses), X19 (Non-Interest Income to Working Fund)are having significant correlation at both 1% and 5% level of profitability of the bank. The variables X2 ,X3,X6,X8, X12, X13 ,X14are positively correlated to the profitability of the bank where as remaining variables have negative correlation.
200
Copyright © 2018. IJEMR. All Rights Reserved.
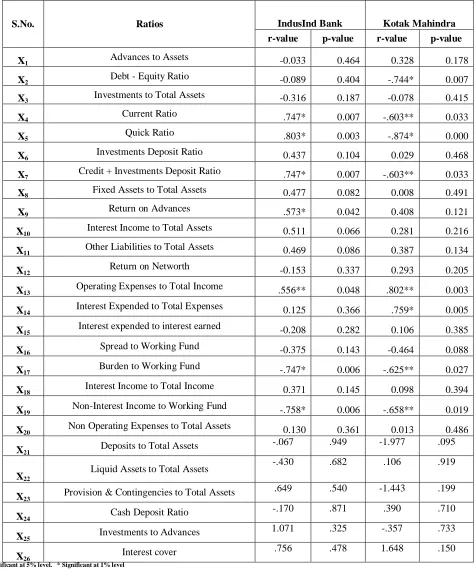
TABLE No.3
Correlation Analysis Of The Selected Variables With The Ratio Of Return On Total Assets
S.No. Ratios IndusInd Bank Kotak Mahindra
r-value p-value r-value p-value
X1 Advances to Assets -0.033 0.464 0.328 0.178
X2 Debt - Equity Ratio -0.089 0.404 -.744* 0.007
X3 Investments to Total Assets -0.316 0.187 -0.078 0.415
X4 Current Ratio .747* 0.007 -.603** 0.033
X5 Quick Ratio .803* 0.003 -.874* 0.000
X6 Investments Deposit Ratio 0.437 0.104 0.029 0.468
X7 Credit + Investments Deposit Ratio .747* 0.007 -.603** 0.033
X8 Fixed Assets to Total Assets 0.477 0.082 0.008 0.491
X9 Return on Advances .573* 0.042 0.408 0.121
X10 Interest Income to Total Assets 0.511 0.066 0.281 0.216
X11 Other Liabilities to Total Assets 0.469 0.086 0.387 0.134
X12 Return on Networth -0.153 0.337 0.293 0.205
X13 Operating Expenses to Total Income .556** 0.048 .802** 0.003
X14 Interest Expended to Total Expenses 0.125 0.366 .759* 0.005
X15 Interest expended to interest earned -0.208 0.282 0.106 0.385
X16 Spread to Working Fund -0.375 0.143 -0.464 0.088
X17 Burden to Working Fund -.747* 0.006 -.625** 0.027
X18 Interest Income to Total Income 0.371 0.145 0.098 0.394
X19 Non-Interest Income to Working Fund -.758* 0.006 -.658** 0.019
X20 Non Operating Expenses to Total Assets 0.130 0.361 0.013 0.486
X21 Deposits to Total Assets
-.067 .949 -1.977 .095
X22
Liquid Assets to Total Assets -.430 .682 .106 .919
X23 Provision & Contingencies to Total Assets
.649 .540 -1.443 .199
X24 Cash Deposit Ratio
-.170 .871 .390 .710
X25 Investments to Advances
1.071 .325 -.357 .733
X26 Interest cover
.756 .478 1.648 .150
**significant at 5% level. * Significant at 1% level
In IndusInd Bank , Seven variables namely X4(Current Ratio ), X 5(Quick Ratio), X7(Credit + Investments Deposit Ratio),X9(Return on Advances), X
201
Copyright © 2018. IJEMR. All Rights Reserved.
bank. The variables X4,X5,X7, X9, X13are positively correlated to the profitability of the bank where as remaining variables have negative correlation.
In Kotak Mahindra , Eight variables namely X2(Debt - Equity Ratio ), X4(Current Ratio), X5(Long Quick Ratio), X7(Credit + Investments Deposit Ratio), X13(Operating Expenses to Total Income), X14(Interest Expended to Total Expenses), X17(Burden to Working Fund), X19(Non-Interest Income to Working Fund) are having significant correlation with profitability of the bank. The variables X13 and X14are positively correlated to the profitability of the bank where as the remaining variables have negative correlation.
V.
CONCLUSION
Currently, Private sector banks in India is matured in terms of supply, product range and reach, even though, reach in rural India still remains a challenge for the private sector banks. In terms of quality of assets and capital adequacy, Indian banks are considered to have clean, strong and transparent balance sheets. With the growth in the Indian economy which is expected to move faster, especially in the services sector, the demand for the banking services, especially retail banking, mortgages and investment services are expected to be strong. Mergers and acquisitions, takeovers and asset sales are expected to increase. Eventhough public sector banks dominating the industry there is a wide scope for private sector banks due to their simplified procedures and user friendliness. The bankers need to analyse the financial variables which effectively contributed to the growth of the private sector banks and which influences the overall performance and negative variables should be given utmost care for efficient and effective financial performance.
REFERENCES
[1] Gordon E. & Natarajan K. (2000). Banking theory, law
and practice. Mumbai, India: Himalaya Publishing House.
[2] Sharma B.P. (2005). The role of commercial banks in
India’s developing economy. New Delhi, India: Sulthan
Chand Company, Pvt. Ltd.
[3] Sundharam K.P.M. (2008). Money, banking and international trade. New Delhi, India: Sultan Chand & Sons.
[4] H. Bhattacharya. (2001). Banking strategy, credit
appraisal and lending decisions. New Delhi, India:
Oxford University Press.
[5] Milind Sathye. (2005). Privatization, performance and efficiency: A study of Indian banks. Vikalpa: The Journal for Decision Makers, 30(1), 7-16.
[6] Sumathy Venkatesan. (2007 January). Banking industry vision 2010. The Indian banker. 2(1), 33-37. [7] Umakrishnan Kollamparambil & Indrani Banerjee. (2008). Foregin institutional investment share and bank performance: An empirical analysis on Indian bank. Afro-Asian Journal of Finance and Accounting, 1(1), 26-39. [8] ZhiShen. (2009 December). Efficiency and productivity analysis in ten asian banking industries. A Doctoral Thesis, Submitted to Loghborough's Institutional
Repository, Loughborough University. Available at:
https://dspace.lboro.ac.uk/dspace-jspui/bitstream/2134/6110/1/Shen_PhD%20thesis_Final% 20Version.pdf.
[9] Anupam Mehta. (2012). Financial performance of UAE banking sector- A comparison of before and during crisis ratios. International Journal of Trade, Economics and Finance, 3(5), 381-387.