Performance Analysis of Layered Vector Space Model in
Web Information Retrieval
Jayant Gadge
Research Scholar VJTI, Mumbai
India
Suneeta Sane
Professor VJTI, Mumbai
India
H.B. Kekre,
Ph.D Sr. Professor, MPSTME SKVM’s NMIMS UniversityMumbai, India
ABSTRACT
Information on the web is growing exponentially. The unprecedented growth of available information coupled with the vast number of available online activities. It has introduced a new wrinkle to the problem of web search. It is difficult to retrieve relevant information. In this context search engines have become a valuable tool for users to retrieve relevant information. Finding relevant information according to user’s need is still a challenge. Various retrieval models have been proposed and empirically validated to find out relevant web pages related to user’s queries. The vector space model is one of the extensively used for web information retrieval. But this model ignores the importance of terms with respect to their position while calculating the weight to the terms.
In this paper, new approach is proposed and validated based on vector space model, referred as Layered Vector Space model. In Layered Vector Space approach, the importance of terms with respect to their position is considered. The web document is conceptually segmented in N-layers considering the organization of the web document and the weights are assigned to terms appearing in different layers based on their occurrence within the document. The proposed layered vector space approach is compared with other token based similarity measures: vector space model, Jaccard similarity, Dice similarity, Pearson’s coefficient and PMI-IR
General Terms
Information Retrieval; Layered vector space model.
Keywords
vector space model; Dice similarity; Jaccard similarity; Cosine Similarity; Layered vector space model; pearson’s coefficient ; PMI-IR; Similarity measure.
1.
INTRODUCTION
The growth of the World Wide Web has prompted a massive increment in the measure of information. The web offers new opportunities and difficulties to information retrieval (IR) scientists. With the information explosion and ceaseless increment of pages, it is tricky to recover valuable and dependable information from the web [1]. The concept of "what is relevant" to a user has only become more unclear as the web has matured and more diverse data have become available. The major problem in web information retrieval is the issue of predicting which document is relevant and which are not. Information retrieval has become of primary interest in computational and language interpretation from texts.
Information retrieval task is an important and major issue in the information age and it plays an important role in
knowledge discovery. Most of the current search engines are based on the terms, not the concepts. When searching for certain information or knowledge with a search engine, one can only use a few terms to narrow down the search. The result of the search process maybe tens or maybe hundreds of relevant and irrelevant links to various web pages.
The information retrieval facilitated by the automation of the term extraction process. As a result, a number of term extraction methods have been developed. Because terms can be relate to each other as well as to existing knowledge base, the notion of term similarity has also been defined and considered in different ways: terms may have functional, structural, lexical or other similarities. Establishing relations between extracted terms from a corpus is indispensable for improving information retrieval. The purpose of information retrieval is to assist users in locating the information they are looking for. The main idea is to locate documents that contain terms that users specify in queries.
The requirement for persuasive techniques for IR has become essential due to the gigantic explosion of information on the web. Web information retrieval needs to manage retrieval of unstructured information particularly textual documents [2][3]. The web allows users to publish large volumes of data with almost no controlling standards that upset the process of accumulating information from it. In order to gratify precise user’s needs, it has to overcome some hostile characteristics such as irregular data quality, volume of data, content and format heterogeneity that arises mainly because of unstructured or semi-structured format of data.
End-Users moreover present some additional troubles in the information retrieval. A query or a topic submitted by a user may itself be unstructured e.g. a sentence or even documents. Sometimes the query submitted by the user may be structured such as a Boolean expression. Contrary to the previous scenario, it is observed that a user typically submits short inquiries. The studies exhibit that the conventional request length is 2-3 keywords. User’s query may not contain the most suitable terms as truly expected by the User. Also, these short requests have state of vulnerability. User's main concern is the methods by which to procure the suitable and accurate information from the web. The meticulous conveyance of content is subject to user preferences and interpretation. There are numerous reasons for not obtaining relevant documents. Few of these are listed beneath.
Information needs are frequently imprecisely defined that generates a semantic gap between user needs and their specification [3][4].
users often do not have foggiest idea about the best query to retrieve the information they require [5].
There are various types of users and they have their own perspectives and interpretation. Even for exactly the same content, there may be diverse understanding and interpretation.
Besides, the user's needs for information change with time. In order to make the enormous amount of information readily available and more easily accessible to users, the information must be decently composed and indexed in efficient ways [4][5].
Major problem in information retrieval is the issue of predicting which documents are relevant and which are not. This relies on a similarity measure approach that decides whether documents are pertinent or not and the similarity measure approach also helps in ordering and ranking of the retrieved documents. Documents appearing at the top of the order are considered to be more likely to be relevant.
Broadly, there are two major categories of web information retrieval approaches, semantic and statistical approach [6]. Semantic methodologies endeavor to execute some level of syntactic and semantic analysis. It tries to reproduce in some degree the understanding of the natural language text that a human user would provide. In statistical approach, the documents that match the query most closely on the basis of some statistical measure are retrieved or ranked
Statistical approaches fall into a number of categories such as boolean model, extended boolean model, vector space model, and probabilistic model [7][8][9]. In statistical approach, documents are initially preprocessed. All documents are segmented into tokens based on white space, paragraph separators and punctuation marks. All words are extracted and stemmed to get the root word. This is one of the essential steps in similarity matching process. Similarly stop words are removed. Stopwords are some extremely regular words which would appear to be of little value in documents matching process. These stopwords should be discarded during indexing. Removal of stopwords significantly reduces the number of postings that a system has to store. Lastly the number of occurrences of each word is counted are typically transformed into a suitable representation.
2.
RELATED WORK
The retrieval of relevant documents for the user request is of utmost importance. Measures of retrieval performance characterize different aspects of document orderings. Usually a document showing better performance is moved up in the ranked list of documents whereas a document with lower performance is moved down in the ranked list. Document ordering is usually performed by search engine using a ranking algorithm. One of the ways to find the relevance is to calculate the similarity of the user query with the documents in the dataset. The retrieved documents are ranked in the order of presumed importance. There is a large number of similarity measures proposed in the literature, because the best similarity measure doesn't exist.
Similarity measures play inexorably paramount part in text related research and applications. Discovering similarity between words is a crucial part of text similarity which is then used as a primary stage for sentence, paragraph and document similarities. Words can be comparable in two ways, lexically
and semantically [10]. Semantic similarity measures play an important role in the extraction of semantic relations.
In order to resolve the semantic similarity between the words, intelligence needs to be incorporated. Using intelligence assimilated in the computer, semantics or meaning of the words can be interpreted. With grammar and syntactic representation, the semantics associated between words or terms are represented. For this, various approaches have been suggested till now. The various approaches or metrics for word semantic similarity can be categorized as follows:
Pre-compiled database based metrics: These metrics based on ontologies such as WordNet, UMLS and MeSH. They are based human-built knowledge resources. These metrics are designed by human experts.
Co-occurrence based metrics: These metrics are proposed based on the co-occurrence of terms or words. The basic hypothesis is that the semantic similarity between words or terms is functionally expressed as a ratio of their co-occurrence [11][12].
Context based metrics: These metrics are expressed as text. It understands and utilizes the contextual meaning and vicinity of words or terms to compute semantic similarity between text and text snippets [11].
Several methods have been proposed in the literature based on concepts of precompiled database e.g. in order to compute semantic similarity between words or snippets, WordNet [13] is used. WordNet is a lexical database that used on-line semantic dictionary. This was developed at Princeton by a group led by Miller. It resembles the traits of a thesaurus in that it structures words that have similar meaning together. WordNet displays some quality of a dictionary. It describes the definition of words and their corresponding part-of-speech Second, considering words and its positions in the taxonomic structure, edge counting methods are proposed based on the length of the paths that link the word and word position.
The Unified Medical Language System started at the National Library of Medicine (NLM) [14] in 1986, with one of the objectives is to help interpret and understand medical meanings across systems. It consists of three main knowledge sources: Metathesaurus, Semantic Network, SPECIALIST Lexicon and Lexical Tools. The Metathesaurus is built from the electronic versions of 5 various thesauri, classifications, code sets, and lists of controlled terms used in patient care, health services billing, public health statistics, indexing and cataloging of biomedical literature, and/or basic, clinical, and health services research
MeSH [15], stands for Medical Subject Headings is one of the main source terminologies and concepts used in UMLS with the primary purpose of supporting indexing, cataloging, and retrieval of medical literature articles stored in NLM MEDLINE database, and includes about 16 high-level categories taxonomies and sub- trees.
Similarly consolidating taxonomic peculiarities that exist in the used resources, information content methods are proposed that compute similarity between terms e.g. count of subsumed words, frequencies computed over textual corpora [17][18][19]. Besides, new words are perpetually being created and new sense is additionally being allotted to the present words, linguistics similarity between words keeps changing dynamically.
words are constantly being created and new meaning is also being assigned to the existing words. There are some problems with the pre-compiled databases. The new senses of words cannot be immediately listed in any pre-compiled database. Maintaining an up-to-date taxonomy of all the new words and new usages of existing words is difficult and costly. Syntactic or lexical similarity is introduced though different String-Based algorithms[17][20]. A string metric is a metric that measures similarity or dissimilarity between two text strings for approximate string matching or comparison. String-Based measures operate on string sequences and character composition. There are two types of String based similarity measures
Character Based Similarity Measures
Terms Base Similarity Measures
2.1
Character-Based Similarity Measures
2.1.1
Longest Common Subsequence (LCS
) It considers the similarity between two strings and it is focused around the length of contiguous chain of characters that exist in both strings [21][22]. LCS is used to establish the length of sequential relationships between queries and documents. LCS is adopted in the text document retrieval systems as a feature weighting technique. This metric simply normalizes the length of the largest substring that the two strings have in common. The formula is given below in eq. (1)
where len() function returns the number of characters in a string.
2.1.2
Jaro
It is based on the number and order of the common characters between two strings; it takes into account typical spelling deviations and mainly used in the area of record linkage. The formula for Jaro similarity measure is given below in eq. (2)
Where m is the number of matching characters and t is the number of transpositions. Two characters match if they are not further apart than
2.1.3
Jaro–Winkle
It is an extension of Jaro distance. The Jaro-Winkler distance is a measure of similarity between two strings [23][25]. The Jaro measure is the weighted sum of percentage of matched characters. Winkler increased this measure for matching initial characters, and then rescaled it. The formula for Jaro-winkle similarity measure is below in eq. (3)
2.1.4
Needleman-Wunsch:
It is an example of dynamic programming. It performs a global alignment to find the best alignment over the entire two sequences. The algorithm essentially divides a full sequence into a series of smaller sequences and uses the solutions to the smaller sequences to reconstruct a solution to the larger
sequences. It is also sometimes referred to as the optimal matching algorithm and the global alignment technique. The Needleman–Wunsch algorithm is widely used for optimal global alignment, particularly when the quality of the global alignment is of the utmost importance. It is suitable when the two sequences are of similar length, with a significant degree of similarity throughout [23][25].
2.1.5
Smith-Waterman
It is another example of dynamic programming. It performs a local alignment to find the best alignment over the conserved domain of two sequences. It is useful for dissimilar sequences that contain regions of similarity or similar sequence motifs within their larger sequence context. One can align two partially overlapping sequences, also it’s possible to align the sub-sequence of the sequence to itself. These are the main advantages of Local Sequence Alignment [23][25].
2.1.6
N-gram
It is a sub-sequence of n items from a given sequence of text. N-gram similarity algorithms compare the n-grams from each character or word in two strings. Each word is represented by a list of its constituent n-grams, where n is the number of adjacent characters in the substrings. Using these lists, similarity measures between pair of words are calculated based on shared unique grams and the number of unique n-grams for each word. Typical values for n are 2 or 3, which correspond to the use of bigrams and trigrams. For bigram the number of n-grams is n+1, and trigram is n+2. Distance is computed by dividing the number of similar n-grams by maximal number of n-grams [23][24].
2.1.7
Damerau-Levenshtein
The Levenshtein algorithm calculates the least number of edit operations that are necessary to modify one string to obtain another string. It defines distance between two strings by counting the minimum number of operations needed to transform one string into the other [23][24], where an operation is defined as an insertion, deletion, or substitution of a single character, or a transposition of two adjacent characters.
2.2 Term-based Similarity Measures
2.2.1 Block Distance
Manhattan distance or City Block is an efficient statistical measurement of similarity /dissimilarity. The City block distance is always greater than or equal to zero. The measurement would be zero for identical points and high for points that show little similarity. It uses two vectors of equal length with n time samples. It is sums the absolute value of the difference in corresponding samples for all samples [25]. Block distance between two point p and q is given by formula below
2.2.2 Euclidean distance
Fig. 1 Taxonomy of Lexical Similarity
2.2.3 Matching Coefficient
The simple matching coefficient used which has the number of shared index terms. It is a very simple vector based approach which simply counts the number of similar terms, on which both vectors are non-zero. This coefficient does not take into account the sizes of vectors. Given two vector i and j of features, Where
p - Number of variables that are positive in both vectors
q - Number of variables that are positive in the first vector and negative in the second vector
r - Number of variables that are negative in the first vector and positive in the second vector
s - Number of variables that are negative in both
t - Total number of variables i.e. t= p + q + r + s
The Matching coefficient is
2.2.4 Overlap coefficient
The overlap coefficient is a similarity measure related to the Jaccard's index that computes the overlap between two sets. Tt is defined as the size of the intersection divided by the smaller of the size of the two sets. Overlap Coefficient (OC) is a metric that determines to what degree one string is a substring of another. If set s1 is a subset of s2 or the converse then the overlap coefficient is equal to one. Its formula is given below.
3.
LAYERED VECTOR SPACE MODEL
The vector space model is a standout amongst the most broadly known and contemplated IR models. This is because of its simplicity and its efficiency over large document collections. In vector-space approach, a document is conceptually exemplified by a vector of terms taken out from the document. The weight connected with the terms expresses the prominence of the terms in the document and inside the entire document collection. Additionally a query is exhibited as a list of terms with related weights indicating the imperativeness of the terms in the query.
The viability of the vector space model crucially relies on upon the weights attached to the terms of the document vectors. Terms that happens all the more frequently in a document are dealt with as more essential, i.e. they better depict the document content, and accordingly are given a higher weight. Terms that happen less habitually everywhere on a dataset are given a higher weight as they find themselves able to segregate the documents in a more noticeable manner.
Web document has semi-structured characteristics. The terms that are utilized for indexing purpose appears in exceptional area such as title, subtitle, header, hyperlinks etc. The content of these exceptional areas represents paramount information in the web documents. The vector space model disregards the vitality of these terms and their position in the document while ascertaining the weights to these indexing terms.
In N-layer vector space representation, semi-structured characteristics of web document are considered. The terms that appear in the exceptional locations such as title, hyperlinks, body and paragraph represent more vital information in the web document. The document is coherently isolated in layers as per the structure and weights are allocated to terms focused around their vicinity in various layer inside the document. The document is sensible separated into three layers, specifically, title region, hyperlink region and body region and weights are allotted to terms focused around their vicinity in distinctive layer inside the document.
Let D = {D1, D2, D3, …,Dn} be the document set. where tfik - Feature frequency of term k in document Di
tfikm - Region feature frequency of term k in document Di
∝ - Weight assigned to Title region. β - Weight assigned to Hyperlink region. γ - Weight assigned to Body Region.
M = tfik1 + tfik2 + tfik3
In order to calculate the feature frequency of terms, region frequency of terms in each region is considered. More weightage is assigned to term appearing in title region followed by hyperlink region and body region i.e.
while calculating feature frequency of term tfik multiply it
by factor by
The feature frequency is calculated as
given in eq. (8)
∝
The term idfk represents inverse document frequency and is
given by Eq. (9)
N= total number of documents in the collection C
nk =total number of documents in the collection C that contain
term k.
The weight of a term is the product of its feature frequency and inverse document frequency. This is given by Eq. (10)
The Similarity between document Di and query q is defined as dot product of the document and query vectors which is equal to the cosine angle between document and query. Let w1, w2
w3,……,wit represents weights of term appearing in document
Di. Let wq1, wq2, wq3,…., wqt represents weights of term
appearing in query q. The similarity between document and query is calculated by Eq. (11).
If the similarity value of a document and query is zero it means that the query and document vector are orthogonal and have no match. Once the similarity value of the document and query is calculated, the documents are ranked according to their cosine similarity value.
4.
SIMILARITY MEASURES AND
EVALUATION PARAMETERS
A similarity measure computes the degree of similarity between a document and query. Similarity measures depend vigorously on terms occurring in both query and the document. Similarity score will be zero or low, if the query and document do not have any term is common then similarity score is very zero. Various similarity measures have been suggested to match the query document. In this paper in order to investigate the performance of N-layer vector space model, five diverse similarity measures are considered: cosine similarity, dice similarity, jaccard similarity, PMI-IR similarity and Pearson similarity.
4.1
Cosine Similarity
Cosine similarity is one of the most widely used similarity measure applied to text document. A document is conceptually represented by a vector of keywords extracted from the document, with associated weights representing the importance of the keywords in the document and within the whole document collection. A query is modeled as a list of keywords with associated weights representing the importance of the keywords in the query. The similarity of two documents corresponds to the correlation between the vectors. This is quantified as the cosine of angle between vectors as given in equation (12)
4.2
Dice Coefficient Similarity
Dice Coefficient is a popular combinatorial similarity of measure adapted to information retrieval to measure lexical distributional similarity [10][18]. It is computed as twice the ratio between the size of the inter-section of the two sets and
the sum of the sizes of the individual sets. With the dice coefficient, the similarity between words with no shared co-occurrences is zero and the similarity between words with identical features is 1.
For a text document, the dice coefficient is the ratio of twice of the sum of weights of shared terms to the sum of weights of individual set of two documents. The formal definition for document and query is below in eq. (14)
4.3
Jaccard’s Coefficient Similarity
Jaccard’s coefficient also known as the tanimoto coefficient is another popular combinatorial similarity measure. It can be defined as the proportion of features belonging to either word that are shared by both words [14][15]. It is the ratio between the size of the intersection of the feature sets and the size of the union of feature sets.
For text document, the Jaccard coefficient compares the sum of weights of shared terms to the sum of weights of terms that are present in either of the two documents but are not the shared terms. The formal definition is given below in eq. (16)
4.4
PMI-IR
The point wise mutual information for information retrieval (PMI-IR) was suggested by Turney as an unsupervised measure for the evaluation of the semantic similarity of words. It is based on word co-occurrence collected over very large corpus. This statistical approach is used to compute relatedness between terms i.e. the degree of shared content as measured by probability of co-occurrence versus independent occurrence of terms [16][26]. PMI has been applied to several natural language processing problems including word clustering and word sense disambiguation. PMI between two terms t1 and t2 compares the probability of observing the two terms together to the probabilities of observing t1 and t2 independently.
For text document and query, above definition is extend as follows. Here N= no of document in the corpus.
4.5
Pearson’s Correlation Coefficient
Pearson correlation coefficient between two data points is defined as the covariance of the two points divided by the product of their standard deviations. Pearson correlation can be thought of as the line of best fit between the points of a given set. The value of Pearson correlation varies from 1 to -1. The value of Pearson’s coefficient 1 represents strong positive correlation or a good match, while a -1 represents a strong negative correlation, which in this case would mean a bad match. A value of 0 indicates no correlation. There are different forms of the Pearson correlation coefficient (P) formula
where
Information retrieval performance is usually measured by considering to what degree documents are relevant to the searcher and are moved toward the front of the ordered list of documents. In order to compare the N-layer vector space model with other similarity measures, precision and recall are used as evaluation parameters. Precision indicates the percentage of documents retrieved that are pertinent to user’s needs and recall indicates percentage of pertinent documents that are retrieved.
Along with precision and recall, one more parameters: F-measure is applied for assessment of performance of information retrieval process. There are two purposes behind applying these parameters. To start with, the proper estimation of maximum recall for a query requires comprehensive information of every last one of document in the collection. With large collection of information, such knowledge is unobtainable which infers that recall can't be assessed exactly. Also, precision and recall are correlated measures which apprehend aspects of the set of retrieved documents. It is helpful to have a solitary measure which consolidates precision and recall. The F-measure consolidates precision and recall, taking their harmonic mean. The F-measure is high when both precision and recall are high.
Where P and R represents accuracy and review separately. The F-measure expects values in the interim of [0, 1]. It has value 0 when no pertinent documents are retrieved and the estimation of F-measure is 1 when all retrieved document are significant.
5.
RESULT
In order to investigate and analyze the performance of N-layer vector space model, three datasets are used. First dataset used for experimentation is UW-CAN-DATASET [27] from University of Waterloo. The dataset consists of 314 web pages from various web sites at university of Waterloo and some Canadian websites. These web pages are categorized into 10
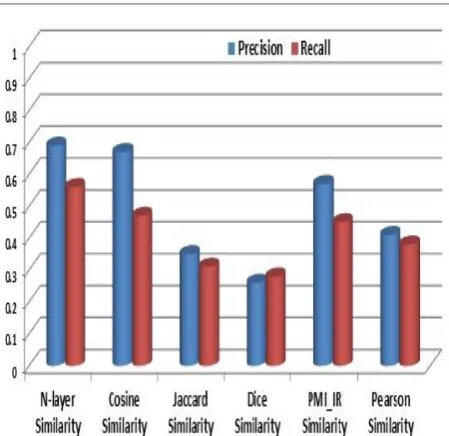
categories. Fig.2 shows graph of average precision and average recall obtained for UW-CAN-DATASET and Fig 3 shows precision versus recall graph of all six similarity measures for UW-CAN-DATASET.
Fig.2 Precision and recall graph for UV-CAN-DATASET
Fig.3 Precision versus recall graph for UV-CAN-DATASET
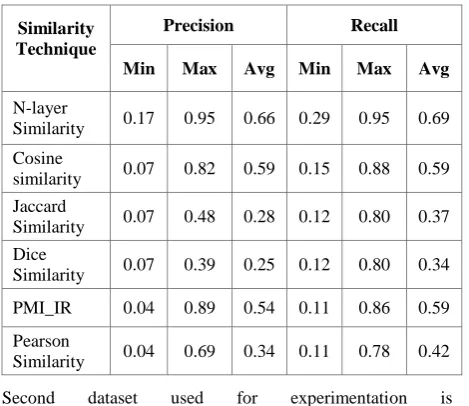
Table 1. Precision and Recall for UV-CAN-DATASET
Similarity Technique
Precision Recall
Min Max Avg Min Max Avg
N-layer
Similarity 0.17 0.95 0.66 0.29 0.95 0.69
Cosine
similarity 0.07 0.82 0.59 0.15 0.88 0.59
Jaccard
Similarity 0.07 0.48 0.28 0.12 0.80 0.37
Dice
Similarity 0.07 0.39 0.25 0.12 0.80 0.34
PMI_IR 0.04 0.89 0.54 0.11 0.86 0.59
Pearson
Similarity 0.04 0.69 0.34 0.11 0.78 0.42
Second dataset used for experimentation is MathWebPageCorpus dataset [28] from National University of Singapore. It consists of web pages related to 27 different mathematical concepts.
Fig 4: Precision and Recall for MathWebPageCorpus
Fig 4 shows graph of average precision and average recall obtained for MathWebPageCorpus dataset and Fig 5 shows precision versus recall graph of all six similarity measures for MathWebPageCorpus dataset.
It shows that the layered vector space approach gives better result as compare to other similarity measures: cosine similarity, Jaccard similarity, dice similarity, PMI-IR similarity and Pearson similarity respectively. The result is obtained by executing 25 queries. Table 2 show details of precision and recall obtained with MathWebPageCorpus for different similarity measures.
Fig.5 Precision versus recall graph for MathWebPageCorpus
Table 2. Precision and Recall for MathWebPageCorpus
Similarity Technique
Precision Recall
Min Max Avg Min Max Avg
N-layer
Similarity 0.45 0.86 0.63 0.60 0.95 0.79
Cosine
similarity 0.24 0.78 0.51 0.50 0.91 0.77 Jaccard
Similarity 0.18 0.80 0.46 0.11 0.80 0.44 Dice
Similarity 0.18 0.80 0.43 0.11 0.71 0.41
PMI_IR 0.17 0.90 0.55 0.13 0.89 0.58
Pearson
Similarity 0.22 0.83 0.45 0.33 0.85 0.66
The third data set used for experimentation is the 7sector [29] dataset. It contains 3417 web articles partitioned in hierarchical order. These articles are categorized in basic material, energy, financial, health, technology, transport and utilities
Fig 6 shows the graph of average precision and average recall for 7sector dataset and the Fig. 7 shows precision versus recall graph of all six similarity measures for sector dataset. The result shows significant improvement in average precision and average recall when layered approach is compared with all other token based similarity measures.
. Fig 6: Precision and Recall for 7Sector Dataset
Fig.7 Precision versus recall graph for 7Sector Dataset
Table 3. Precision and Recall for 7 Sector Dataset
Similarity Technique
Precision Recall
Min Max Avg Min Max Avg
N-layer
Similarity 0.45 0.86 0.63 0.60 0.95 0.79
Cosine
similarity 0.24 0.78 0.51 0.50 0.91 0.77 Jaccard
Similarity 0.18 0.80 0.46 0.11 0.80 0.44 Dice
Similarity 0.18 0.80 0.43 0.11 0.71 0.41
PMI_IR 0.17 0.90 0.55 0.13 0.89 0.58
Pearson
Similarity 0.22 0.83 0.45 0.33 0.85 0.66
Table 4. Table captions should be placed above the table
Similarity Technique
F-Measure
MathWeb PageCorpus
UW-CAN-DATASET 7sectors
N-layer
Similarity 0.69 0.68 0.61
Cosine
similarity 0.59 0.58 0.54
Jaccard
Similarity 0.43 0.34 0.30
Dice
Similarity 0.40 0.31 0.26
PMI_IR 0.55 0.57 0.50
Pearson
Similarity 0.51 0.39 0.38
6.
CONCLUSION
Term weight appraisal is an important aspect of information retrieval. Terms are words, phrases, or any other indexing units used to identify the document. The term that appears in the special locations such as title, hyperlinks, body and paragraph represents more important information in the web document. The proposed layer vector space model assigns more weight to terms appearing in special location such title, hyperlink, body.
In this paper, performance of N-layer vector space model is compared with five different similarity measures: cosine similarity, dice similarity, jaccard similarity, PMI-IR similarity and Pearson similarity. For the comparison, three different standard dataset are used. For all three datasets, N-layer vector space model shows significant improvement in precision and recall as compare to dice similarity, jaccard similarity and Pearson similarity. The layered vector space approach, average precision and average recall is improved by approximately 20 to 25 percent and 25 to 30 percent respectively.
The N-layer vector space model is also compared with PMI-IR for all three datasets. It shows average precision and average recall is improved by approximately 10 percent and approximately 11 percent respectively. The proposed approach when compared with cosine similarity shows that average precision and average recall is improved by 5 percent and approximately 7 percent respectively.
F-measure is one more parameter used to evaluate the performance. The N-layer vector space approach shows approximately 10 percent improvement in F-measure when it is compared with vector space model and PMI-IR. In case of dice similarity, jaccard similarity and Pearson similarity, it shows approximately improvement of 20 percent. The layered vector space approach outperforms other similarity measures. The overall assessment shows that concept of assigning weight to the term based on the position of term within document provides better results.
7.
REFERENCES
[1] Srinath Sriniwas, P.C. Bhatt., Introduction to Web Information Retrieval: A User Perspective, Resonance Resonance, June 2002 ,age 27-38
Search Engine Techniques, Al-Satil Journal, Page 55-81
[3] Mehran Sahami, Vibhu Mittal, Shumeet Baluja, Henry Rowley, The Happy Searcher: Challenges in Web Information Retrieval, Google Inc. 1600 Amphitheatre Parkway, Mountain View, CA 94043
[4] Ricardo Baeza-Yate, Information retrieval in the Web: beyond current search engines, International Journal of Approximate Reasoning, vol. 34, 2003 page 97–104
[5] P. Ravikumar, Ashutosh kumar singh, Web Structure Mining: Exploring Hyperlinks and Algorithms for information Retrieval, American Journal of Applied Science vol.7(6) 2010, Page 840-845
[6] Elias Iosif and Alexandros Potamianos, Unsupervised Semantic Similarity Computation Between Terms Using Web Documents, IEEE transaction on Knowledge and Data Engineering, vol.22 no.11, November 2010 .pp. 1637-1647
[7] Joon Ho Lee, Properties of Extended Boolean models in information Retrieval, Proceeding SIGIR '94, Proceedings of the 17th annual international ACM SIGIR conference on Research and development in information retrieval, Pages 182-190
[8] Kirk Baker, Singular Value Decomposition Tutorial March 29, 2005, Revised January 14, 2013
[9] Norbert Fuhr, probabilistic model in information retrieval, http://citeseerx.ist.psu.edu/viewdoc/download? doi=10.1.1.88.9250
[10] Danushka Bollegala, Yutaka Matsuo, and Mitsuru Ishizuka, A Web Search Engine-Based Approach to Measure Semantic Similarity between Words, Transaction on Knowledge and Data Engineering, VOL.23, NO.7, JULY 2011
[11] Sapna Chauhan, Pridhi Arora and Pawan Bhadana, Algorithm for Semantic Based Similarity Measure, International Journal of Engineering Science Invention, ISSN (Online):2319–6734, ISSN (Print):2319–6726
[12] Sheetal A. Takale, Sushma S. Nandgaonkar, “Measuring Semantic Similarity between Words Using Web Documents” International Journal of Advanced Computer Science and Applications, ( Vol. 1, No.4 October, 2010).
[13] George Miller, Richard Beckwith, Christiane Fellbaum, Derek Gross,and Katherine Miller, “Introduction to WordNet: An On-line Lexical Database”, International Journal of Lexicography, Vol.3, No.4. (21 December 1990) pp. 235-244
[14] UMLS: Unified Medical Language System. Available: http://www.nlm.nih.gov/research/umls/ visited on 30/11/2013
[15] MESH: http://www.nlm.nih.gov/mesh/meshhome.html MeSH visited on 30/11/2013
[16] Hamani and Maamri. R, “ Word Semantic Similarity Based on Document's Title”, International workshop on
database and expert systems applications(DEXA) 2013, (ISSN:1529-4188, Print ISBN:978-0-7695-5070-1), pp.43-47
[17] Lan Huang, D. Milne, E. Frank and Ian H. Witten, Learning a Concept-based Document Similarity Measure, Journal of the American Society for Information Science and Technology, Volume 63,Issue 8,August 2012, pages 1593–1608.
[18] Danushka, B.,Yutaka Matsuo and Mitsuru Ishizuka, “Measuring Semantic Similarity between Words Using Web Search Engines”, Proceedings of the 16th international conference on World Wide Web Pages 757-766.
[19] Taher H. Haveliwala, Aristides Gionis, Dan Klein and Piotr Indyk, “Evaluating Strategies for Similarity Search on the Web ”, WWW2002, May 7–11, 2002, Honolulu, Hawaii, USA, ACM 158113-449-5/02/0005.
[20] Myoung-Cheol and Key-Sun Choib, “ A comparison of collocation-based similarity measures in query expansion” Information Processing and Management, Volume 35, Issue 1, January 1999, Pages 19–30
[21] Sung-Hyuk, Cha, “ Comprehensive Survey on Distance /Similarity Measures between Probability Density Functions”, International Journal of Mathematical models and methods in applied sciences, Issue 4, Volume 1, 2007, PP 300-307
[22] Y. Xiao, W.P. Luk, K.F. Wong and K.L.Kwok, “ Using Longest Common Subsequence Matching for Chinese Information Retrieval”, Journal of Chinese Language and Computing ( volume 15, no 1), pp 45-51
[23] Wael H. Gomaa and Aly A. Fahmy, “A Survey of Text Similarity Approaches”, International Journal of Computer Applications, Volume 68– No.13, April 2013, 0975 – 8887
[24] http://www-igm.univ-mlv.fr/~lecroq/string/ visited on 22/01/2014
[25] J. French, A. Powell and E. Schulman, “Applications of Approximate word matching in information retrieval”, 6th informational conference on information and knowledge management,( Nov.10-14,1997), pp 9-15. [26] Aji S, and R. Kaimal, “Document summarization using
positive pointwise mutual information”, International Journal of Computer Science and Information Technology (IJCSIT) ( Vol 4, No 2, April 2012).
[27] http://pami.uwaterloo.ca/~hammouda/webdata/ visited on 08/10/11
[28] http://wing.comp.nus.edu.sg/downloads/mwc/ visited on 06/12/2012
[29]