March-April 2017 287
Research
Paper
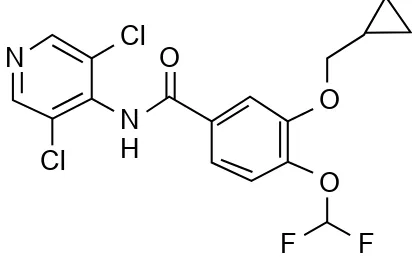
Roflumilast[1], 3-(cyclopropylmethoxy)-N-(3,5-dichloropyridin-4-yl)-4-(difluromethoxy) benzamide (fig. 1), is a white fine powder freely soluble in acetone and acetonitrile, sparingly soluble in methanol and insoluble in water. Roflumilast, used for chronic obstructive pulmonary disease (COPD), is a selective, long-acting inhibitor of enzyme PDE-4. It has potential antiinflammatory and antimodulatory effects in the pulmonary system. It is thought that the increased levels of intracellular cyclic adenosine mono phosphate (AMP) are responsible for the therapeutic actions of roflumilast. Literature survey revealed that ultra violet (UV)[2], high performance liquid chromatography (HPLC)[3,4], stability indicating HPLC methods[5-7] were reported for the estimation of roflumilast. However, high performance thin layer chromatography (HPTLC) method has not yet been reported for the determination of roflumilast in formulations.
The International Conference on Harmonization (ICH) guideline entitled “Stability testing of new
drug substances and products” requires testing to be conducted to assess the inherent stability of the active substances[8]. An ideal stability-indicating method is one that resolves the drug and its degradation products efficiently. Hence it is necessary to conduct stability studies of roflumilast under acidic, alkaline, oxidative and photolytic conditions. The main aim of the present work is to develop novel validated stability indicating HPTLC technique for the estimation of roflumilast in formulation and its application to accelerated stability studies. The proposed method is simple, accurate and reproducible, can be employed for the routine quality control analysis.
A Validated Stability-indicating HPTLC Method for the
Determination of Roflumilast in Tablets and Application
to Accelerated Stability Studies
A. SUGANTHI*, K. ARTHI AND T. K. RAVI
Department of Pharmaceutical Analysis, College of Pharmacy, Sri Ramakrishna Institute of Paramedical Sciences, The Tamil Nadu Dr. M.G.R. Medical University, Coimbatore-641 044, India
Suganthi, et al.: Accelerated Stability Studies of Roflumilast Using HPTLC
A high performance thin layer chromatography method was developed for roflumilast on silica gel 60F254
thin layer chromatography plates using mobile phase comprising of toluene:ethyl acetate (7:3% v/v) with
detection set at 254 nm on a densitometer. The Rf value of roflumilast was 0.54±0.02. Percent recovery of
the drug from tablet formulation was carried out by standard addition method and was found to be close to 100 and percent relative standard deviation was less than 2%, which indicated good accuracy and precision of the method. Roflumilast was subjected to acid, alkali and neutral hydrolysis, oxidation and thermal and photolytic degradation. Degradation studies indicated roflumilast to be susceptible to acid and alkaline hydrolysis and oxidation. The degradation product was well resolved from the pure drug with significant
differences in Rf values. The developed validated method was applied to formulation, content uniformity test and accelerated stability studies of roflumilast. The rate of hydrolysis was found to increase with increase in the strength of hydrochloric acid. It was observed that temperature had a major effect over acid hydrolysis of roflumilast compared to varying the strength of hydrochloric acid. Further this study can be extended for the determination of shelf life of roflumilast formulations.
Key words: Roflumilast, HPTLC, forced degradation, acid hydrolysis, alkaline hydrolysis, oxidation, accelerated stability studies, validation
*Address for correspondence
E-mail: [email protected]
This is an open access article distributed under the terms of the Creative Commons Attribution-NonCommercial-ShareAlike 3.0 License, which allows others to remix, tweak, and build upon the work non-commercially, as long as the author is credited and the new creations are licensed under the identical terms
Accepted 23 March 2017 Revised 27 December 2016
MATERIALS AND METHODS
Roflumilast was received as a gift sample from SNR Sons Charitable Trust. HCl (AR grade), hydrogen peroxide (H2O2) (AR grade), toluene (LR grade), ethyl acetate (AR grade), acetonitrile (HPLC grade) and sodium hydroxide (NaOH) were purchased from S. D. Fine Chem. Ltd., and Qualigens Fine Chemicals Ltd., Mumbai, India. Precoated silica gel 60F254 on aluminium sheets were procured from Merck, Germany. Shimadzu Digital Electronics Balance, Camag HPTLC system (with TLC Scanner, WinCATs software and Linomat 5 as application device), hot air oven manufactured by Inlab Equipment, Madras Ltd., sonicator manufactured by Leelasonic Ultrasonic sonicator and centrifuge manufactured by Remi.
Preparation of mobile phase and stock solutions:
Initially the method was developed using toluene:ethylacetate (7:3% v/v) as the mobile phase and precoated silica gel 60F254 TLC plates as the stationary phase. After applying the spots, the plate was developed, dried and scanned keeping the slit dimension at 5.00×0.45 mm and scanning speed at 20 mm/s using Camag TLC scanner 3 at 254 nm, controlled by WinCATS software. Deuterium lamp was used as the radiation source and densitometric evaluation was carried out to understand the effect of the above mentioned variables over Rf values of roflumilast so as to find the optimized chromatographic conditions. Ten milligram of roflumilast was weighed accurately and transferred to 10 ml volumetric flask in acetonitrile and made up to 10 ml to get a concentration of 1000 µg/ml.
Method validation:
The linearity of response for roflumilast was assessed using different concentration from 0.6-2.6 µg/spot. Peak area was noted for each spot and plotted against concentration to get a linear graph. The peak purity
of roflumilast was also assessed by comparing the chromatogram at three different levels of peak start, peak apex and end position of the peak. The pre-analysed samples were spiked with extra 50, 100, 150% of standard roflumilast and the resulting solutions were analysed by the developed method. Repeatability of sample application and measurement of peak area were carried out using six replicates of same spot 1.4 and 1.8 µg/spot of roflumilast.
The intra-day and inter-day variations were also carried out for the same above mentioned concentrations and the %RSD values were calculated. Detection limit (LOD) and limit of quantification (LOQ) was calculated using the Eqns., LOD = 3.3×σ/S; LOQ = 10×σ/S, where, σ is the standard deviation of y intercepts of regression line and S is slope of calibration curve.
Robustness was evaluated using 1.8 µg/ spot by making small changes in mobile phase composition, chamber saturation time, migration distance, for about ±0.1 ml, ±5 min and ±5 mm, their effects on Rf value were analysed and the %RSD was calculated. Stability was evaluated using the concentration of 1.4 µg/spot, after storing the stock solutions of roflumilast at room temperature for 48 h and under refrigeration for 3 d.
Application of study to assay of formulation:
To determine the amount of roflumilast in formulation, the tablets were powdered and powder equivalent to 10 mg of roflumilast was weighed. The drug was extracted with acetonitrile after sonication for 5 min. filtered using Whatman filter paper No.1 and volume was made up to 10 ml. Then 10 µl of the filtrate was applied on pre coated TLC plate and the chromatogram developed was scanned under the optimised conditions. The calibration graph prepared was used to find out the concentration of the drug. This analysis was repeated for six times.
Application to content uniformity of test:
Ten tablets were randomly selected from a lot of twenty tablets to perform content uniformity test. After extracting the drug using acetonitrile, a fixed volume of 20 μl was taken and applied on a 20×10 cm HPTLC plate. The plates were developed and scanned at 254 nm. The amount present in roflumilast formulation was determined by relating formulation to the standard graph and the corresponding percent label claim was calculated.
N
N
H
CI
F
F
CI
O
O
O
March-April 2017 289 Forced degradation studies:
For conducting the forced degradation studies, four samples were taken, the blank solution stored under normal conditions, the blank subjected to stress in the similar manner as the drug solution, zero time analyte solution, which was stored under normal and the sample subjected to stress. The study was conducted separately for roflumilast in bulk as well as for tablets containing 5 mg of roflumilast. Twenty five milligram of roflumilast was weighed accurately and transferred into three different 25 ml volumetric flasks. To this 10 ml of 1 N, 1.5 N, 2 N HCl were added separately and the volume made up to 25 ml with acetonitrile. This solution was refluxed for 5 h at 80°. Further 1 ml was made up to 5 ml (200 µg/ml). Similar procedure was followed adding NaOH in place of HCl for alkaline degradation. For neutral hydrolysis, 25 mg of roflumilast was dissolved in 10 ml water and volume made up to 25 ml using acetonitrile in a volumetric flask. This solution was refluxed for 6 h at 80°. Further 1 ml was made up to 5 ml (200 µg/ml). Similarly the oxidative degradation study was conducted using 10 ml of 30% H2O2 and 1 ml of sample was withdrawn 1 h once for about 6 h and 24 h and the procedure was repeated. Thermal degradation study had 25 mg of roflumilast placed in a hot air oven at 80° in a Petri dish for 5 h, then dissolved and made up to 25 ml with acetonitrile. Further 1 ml was taken and made up to 5 ml (200 µg/ml). Twenty five milligram of roflumilast was weighed, transferred to a Petri dish and exposed to sunlight for about 8 h. The contents were dissolved in acetonitrile and photolytic studies were carried out. From various stress samples prepared, 10 µl were spotted on TLC plate in triplicates, analysed using the chromatographic conditions described earlier.
Method application to degradation kinetics[9], the
order of reaction:
Ten millilitres of 2 N HCl was added to 25 mg of roflumilast and made up to 25 ml with acetonitrile in a volumetric flask. This was refluxed at 80° for 5 h. From the stress sample prepared about 10 µl was spotted from 200 µg/ ml, along with standard on HPTLC plate and chromatograms were recorded.
Effect of concentration of HCl on the reaction rate:
Into a series of 25 ml volumetric flasks, 25 mg of roflumilast was taken, dissolved in acetonitrile and 10 ml of 1, 1.5 and 2 N HCl were added separately and the volume was made up with acetonitrile. These
solutions were transferred into a clean round bottom flask and refluxed at 80° for 5 h. From the degraded solution, further 1 ml was made up to 5 ml (200 µg/ ml). From this 10 µl of each solution was spotted along with standard solution of roflumilast were applied on HPTLC plate and chromatograms were recorded under optimized condition.
Effect of temperature on reaction rate:
Twenty five milligrams of roflumilast was taken in three different 25 ml volumetric flasks, 10 ml of 1, 1.5 and 2 N HCl was added separately and the volume was made up with acetonitrile. These solutions were transferred into clean dried round bottom flasks and then refluxed at 50, 60, 70 and 80° for 5 h. One millilitre of stressed sample solution was diluted to 5 ml and 10 µl was spotted along with the standard on HPTLC plate.
RESULTS AND DISCUSSION
Toluene:ethyl acetate (7:3 v/v) gave a symmetric peak with acceptable Rf value. Hence it was finally selected as mobile phase. The use of other solvent systems like methanol:ethylacetate:toluene (4:5:1), methanol:ethylacetate (2:8), ethylacetate:methanol (2:8), methanol:cyclohexane (7:3), toluene:ethylacetate (8:2), ethylacetate:toluene (2:8), toluene:ethylacetate (5:5) resulted in either peak broadening or asymmetric peak. The chromatogram was recorded at 254 nm where the linear response was very good with maximum sensitivity.
solution was about 6 h at normal room temperature and about 3 d at refrigration. The percent label claim was calculated and the estimated amount was close to the labelled value. The corresponding reports are presented in Table 3. The content uniformity test is used to ensure
that every tablet contains the amount of drug substance intended with little variation among tablets in a batch. The % labelled claim was found to be in the range of 99.50-104.9, the %RSD was calculated and found to be 1.512.
400
350
300
250
200
150
100
50
0-0.14 0.06 0.26 0.46 0.66 0.86 1.06 R f AU
Track 8. ID: Standard3
ROFLUMILAST
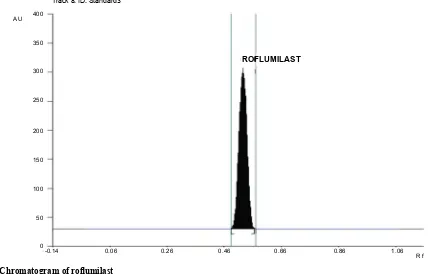
Fig. 2: Chromatogram of roflumilast
Chromatogram of standard 1.4 µg/spot with Rf value of 0.54
Concentration of
sample taken (mg) standard added (mg)Concentration of % Level % Recovery %RSD*
5 2.5 50 100.71 0.1317
5 5 100 100.23 0.0047
5 7.5 150 99.35 1.6628
TABLE 1: RECOVERY STUDIES
RSD is relative standard deviation for six observations
Robustness evaluation was performed at 1.8 µg/spot. Three factors were slightly changed at three levels (-0.1, 0, +0.1) for mobile phase volume and ratio, ±5 min and ±5 mm for chamber saturation time and solvent migration distance
TABLE 2: ROBUSTNESS EVALUATION
Volume of mobile phase composition (toluene:ethyl acetate)
Factor Level Peak area %RSD*
7:3 (10 ml)
–0.1 6626.08 0.012570
0 6628.70 0.002560
+0.1 6628.30 0.004159
Chamber saturation time
Factor Level Peak area %RSD*
20 min
-5 6626.8 0.00916
0 6627.9 0.00913
+5 6624.8 0.01824
Solvent migration distance
Factor Level Peak area %RSD*
80 mm
+5 6629.1 0.01553
0 6626.1 0.02440
March-April 2017 291
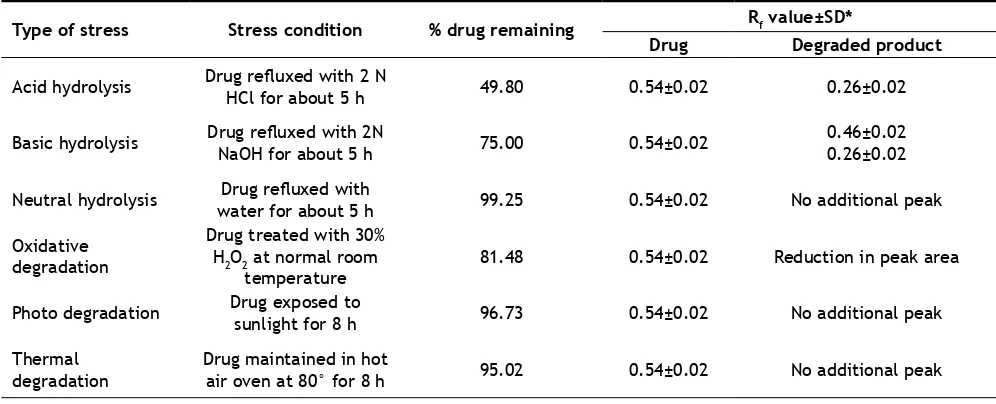
During optimization of the hydrolytic degradation process, roflumilast was refluxed using 2 N HCl at 80° for 5 h showed 50.20% degradation (fig. 3) where as 25% degradation was observed when the drug was refluxed at 80° using 2 N NaOH for 5 h, (fig. 4). No degradation was observed when the drug was subjected to neutral hydrolysis. But oxidative degradation using 30% H2O2 at normal room temperature was carried out, the peak area was reduced from the normal value, this may be due to the formation of N-oxide. No degradation
was seen in solid drug maintained at 80° for 8 h in a hot air oven. Results proved that the degradation of roflumilast was more pronounced under acidic hydrolytic condition than alkaline condition. Summary of the data for all forced degradations is given in Table 4. Peak purity test suggested that the roflumilast peak as well as the peaks of degradation products were pure for all the forced samples analyzed. No additional peak was observed in chromatograms obtained for the extended runtime of 25 min in a sample study.
Rofaday is the brand name of roflumilast
TABLE 3: ANALYSIS OF FORMULATION
Brand LabeledAmount (µg/tab)Estimated % Label claim %RSD*
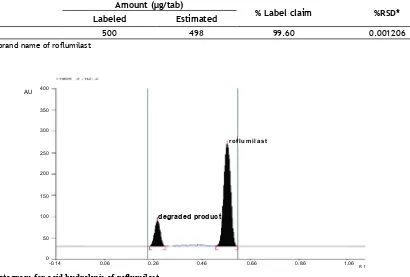
Rofaday 500 498 99.60 0.001206
400
350
300
250
200
150
100
50
0
-0.14 0.06 0.26 0.46 0.66 0.86 1.06
AU
roflumilast
degraded product
R f Fig. 3: Chromatogram for acid hydrolysis of roflumilast
Chromatogram showed drug peak at 0.54, which was well resolved from the degraded product at 0.26
Fig. 4: Chromatogram for alkaline hydrolysis of roflumilast
A linear relationship was obtained by plotting log concentration of roflumilast remaining against time. K value was obtained by graphical method (fig. 5). Since the hydrolysis was performed in a large excess of 2 N HCl, it can be assumed as pseudo first order reaction rate. The effect of temperature was studied by conducting the reaction at different temperature using different concentration of HCl. At each temperature the rate constant was plotted against the reciprocal of temperature in Kelvin units (Arrhenius plot) to demonstrate the effect of temperature on rate constant. From the regression equation, activation energy was calculated as 10.9421 kcal/mol. t1/2 value can be determined from the rate constant value (k) and it is
shown in Table 5. The rate of hydrolysis was found to increase with increase in the strength of HCl. It was observed that the temperature had a major effect over acid hydrolysis of roflumilast compared with varying strength of HCl.
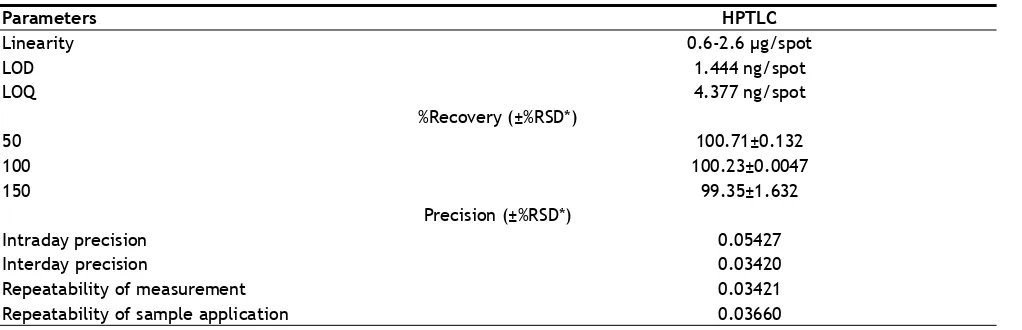
The developed HPTLC method was found to be sensitive, precise, robust, accurate and rapid. Summary of validation parameters for the estimation of roflumilast by the proposed method is given in Table 6. It can be concluded that the proposed validated stability indicating HPTLC method could be employed for the routine quality control analysis and also extended for the prediction of shelf life of formulation containing roflumilast.
TABLE 4: SUMMARY OF FORCED DEGRADATION STUDIES
Type of stress Stress condition % drug remaining Rf value±SD*
Drug Degraded product
Acid hydrolysis Drug refluxed with 2 N HCl for about 5 h 49.80 0.54±0.02 0.26±0.02
Basic hydrolysis Drug refluxed with 2N NaOH for about 5 h 75.00 0.54±0.02 0.46±0.020.26±0.02
Neutral hydrolysis water for about 5 hDrug refluxed with 99.25 0.54±0.02 No additional peak
Oxidative
degradation
Drug treated with 30% H2O2 at normal room
temperature 81.48 0.54±0.02 Reduction in peak area
Photo degradation Drug exposed to sunlight for 8 h 96.73 0.54±0.02 No additional peak
Thermal
degradation Drug maintained in hot air oven at 80° for 8 h 95.02 0.54±0.02 No additional peak
0 0.05 0.1 0.15 0.2 0.25 0.3 0.35
0 1 2 3 4 5 6
Lo
g
Co
nc
en
tr
a
ti
on
R
em
ai
ni
ng
Time in Hours
Fig. 5: First order plot for the hydrolysis of roflumilast
First order plot for the hydrolysis of roflumilast with 2 N HCl at 70°. It followed pseudo first order reaction, Y =-0.04836 X+0.30126,
March-April 2017 293
Acknowledgements:
The authors would like to thank the Tamilnadu Welfare Trust for selecting the work to receive the merit scholarship and SNR Sons Charitable Trust, Coimbatore for providing the necessary infrastructural facilities to perform this study.
Conflicts of interest:
There are no conflicts of interest mentioned.
Financial support and sponsorship:
Nil.
REFERENCES
1. https://en.wikipedia.org/wiki/Roflumilast.
2. Krishna PR, Desai DG, Zanwar A, Kumar AS, Seth AK. Development and validation of UV spectroscopy method for estimation of roflumilast in bulk and tablet dosage form. Pharma Science Monitor 2013;4:274-80.
3. Barhate VD, Deosthalee P. Validation of rapid liquid chromatographic method for the determination of roflumilast. J Chem Pharm Res 2011;3:770-5.
4. Fang Tan. Development and validation of stability-indicating HPLC method for roflumilast and related substances. Adv Mater Res 2013;781-4:68-71.
5. Barhate VD, Deosthalee P. Rapid liquid chromatographic method for the determination of roflumilast in the presence of degradation products. Indian J Pharm Sci 2010;72:401-4. 6. Arpit DS, Chaganbhai NP. Implementation of QbD approach to
the RP-HPLC method development and validation of roflumilast in bulk and tablet dosage form: an application in degradation study. World J Pharm Pharm Sci 2014;3:2282-307.
7. Tarek SB. Validated stability study with diode array detection method for determination of phosphodiesterase (PDE4) inhibitor roflumilast. Bull Fac Pharm (Cario Univ) 2014;52:79-89.
8. https://www.ich.org/fileadmin/Public_Web_Site/ICH_ Products/Guidelines/Quality/Q2_R1/Step4/Q2_R1__ Guideline.pdf.
9. Martin A. Physical Pharmacy. 4th ed. New York: A Wolters Kluwer Company; 2002. p. 284-311.
TABLE 5: KINETIC DATA FOR ACID HYDROLYSIS OF ROFLUMILAST
t1/2 is the time required for a quantity of drug reduced to half its initial value
Normality of HCl Temperature(°) K (h-1) t
1/2 (h)
1 N
50 0.026417 26.240
60 0.048236 14.371
70 0.07760 8.9329
80 0.09795 7.0770
1.5 N
50 0.03230 21.4613
60 0.06232 11.1232
70 0.09379 7.3909
80 0.11740 5.90459
2 N
50 0.03285 21.1019
60 0.07012 9.8859
70 0.11011 6.2960
80 0.13837 5.00975
LOD and LOQ represent the limit of detection and limit of quantification
TABLE 6: SUMMARY OF VALIDATION PARAMETERS
Parameters HPTLC
Linearity 0.6-2.6 µg/spot
LOD 1.444 ng/spot
LOQ 4.377 ng/spot
%Recovery (±%RSD*)
50 100.71±0.132
100 100.23±0.0047
150 99.35±1.632
Precision (±%RSD*)
Intraday precision 0.05427
Interday precision 0.03420
Repeatability of measurement 0.03421