University of Pennsylvania University of Pennsylvania
ScholarlyCommons
ScholarlyCommons
Publicly Accessible Penn Dissertations
2019
Improving Performance Of Infiltrated Sofc Cathodes Via Scaffold
Improving Performance Of Infiltrated Sofc Cathodes Via Scaffold
Engineering And Catalyst Surface Engineering
Engineering And Catalyst Surface Engineering
Yuan Cheng
University of Pennsylvania, [email protected]
Follow this and additional works at: https://repository.upenn.edu/edissertations
Part of the Chemical Engineering Commons, Mechanics of Materials Commons, and the Oil, Gas, and Energy Commons
Recommended Citation Recommended Citation
Cheng, Yuan, "Improving Performance Of Infiltrated Sofc Cathodes Via Scaffold Engineering And Catalyst Surface Engineering" (2019). Publicly Accessible Penn Dissertations. 3541.
https://repository.upenn.edu/edissertations/3541
This paper is posted at ScholarlyCommons. https://repository.upenn.edu/edissertations/3541
Improving Performance Of Infiltrated Sofc Cathodes Via Scaffold Engineering Improving Performance Of Infiltrated Sofc Cathodes Via Scaffold Engineering And Catalyst Surface Engineering
And Catalyst Surface Engineering
Abstract Abstract
Solid Oxide Fuel Cells (SOFCs) are energy-generating devices operating at elevated temperatures. At their cathode sides, oxygen molecules reduce into oxygen ions and then transport to the anode side through a solid-state ceramic membrane (typically, Yttria-Stabilized Zirconia (YSZ)). At their anode side, the fuels react with the oxygen ions and then release electrons to the external circuit. Always, it is the cathode that has the slowest reaction kinetics, such it contributes the largest resistance in the entire device.
The state-of-the-art cathode materials are typically perovskite-phase ceramic materials, such as
doped Lanthanum Manganate (LSM), doped Lanthanum Ferrite (LSF) and Strontium-doped Lanthanum Cobaltite (LSC). Conventionally, they are just printed to the well-sintered solid-state electrolyte surface and then sinter again to a medium temperature (~1373K) to build contact with the electrolyte. This brings multiple problems, such as solid-state reactions, bad mechanical properties, limited reaction sites, etc. To resolve these problems, infiltrated cathodes, which has nanoscale cathode materials distributed in a porous matrix of electrolyte, was developed at Penn. Cathodes made with this method have multiple advantages such as a significantly larger number of reaction sites, the avoidance of solid-state reactions, strong mechanical properties and the match of coefficient of thermal expansion. However, although infiltrated cathodes exhibit significantly better performances than traditional printed cathodes, there is still room for improvement. An important concern about the infiltration method is manufacturability. A single infiltration step takes about 30 mins, and the infiltrated material per cycle is restricted by the volume of material that can be added. Normally, 30 wt% loading of the nanoparticles in the cathode matrix is necessary to achieve a good electronic conductivity, with only one thirds of the nanoparticles are there for the surface reaction kinetics. Therefore, to improve the manufacturability of infiltrated SOFC cathodes, one must develop an electronically conductive cathode at a low loading of the cathode nanoparticles. In our study, we have demonstrated a promising approach of using composite materials, such as LSF-YSZ and LSCrF-YSZ, instead of single-phase YSZ as the matrix material. This allows the cathode to have a better performance at low nanoparticles loading due to the incorporated electronic conductivity in the porous matrix backbone.
Another approach to improve the cathode performance is to increase the surface reaction kinetics of the infiltrated cathode materials. In this study, we used Atomic Layer Deposition (ALD), a thin-film growth technology capable of making atomic-level composition tuning, to reveal the desired surface composition of the perovskite-phase cathodes for the sluggish oxygen reducing process. It was discovered that for the ABO3 perovskites, an AO layer on top of BO2 layer configuration is desired for fast oxygen reducing kinetics and it is very likely due to the increase in surface oxygen vacancies. Computational study performed by our collaborator investigated the thermodynamic nature of this configuration and suggested its thermal instability, which was proved by further experimental evidence.
Degree Type Degree Type Dissertation Degree Name Degree Name
Doctor of Philosophy (PhD) Graduate Group
Graduate Group
First Advisor First Advisor Raymond J. Gorte Second Advisor Second Advisor John M. Vohs Keywords Keywords
Catalysis, Ceramic, Fuel Cell, Membrane, Oxygen Reduction, SOFC Subject Categories
Subject Categories
Chemical Engineering | Mechanics of Materials | Oil, Gas, and Energy
IMPROVING PERFORMANCE OF INFILTRATED SOFC CATHODES VIA
SCAFFOLD ENGINEERING AND CATALYST SURFACE ENGINEERING
Yuan Cheng
A DISSERTATION
in
Chemical and Biomolecular Engineering
Presented to the Faculties of the University of Pennsylvania
in Partial Fulfillment of the Requirements for the
Degree of Doctor of Philosophy
2019
Supervisor of Dissertation Co-Supervisor of Dissertation
____________________________ _________________________ Raymond J. Gorte John M. Vohs
Russell Pearce and Elizabeth Crimian Heuer Professor Carl V. S. Patterson Professor and Chair Chemical and Biomolecular Engineering Chemical and Biomolecular Engineering
Graduate Group Chairperson
_________________________
John C. Croker, Professor, Chemical and Biomolecular Engineering
Dissertation Committee:
Donald H. Berry, Professor, Chemistry
ii Acknowledgements
First and foremost, I would like to thank my advisors, Prof. Raymond Gorte and
Prof. John Vohs, for their guidance and support along my academic path. From them, I
not only enriched my knowledge in chemical engineering and surface sciences, but also
learned the mentality of an engineer. Their wisdom and kindness have influenced me in
being an independent researcher and will keep on influencing me in my future careers.
I would also like to thank the rest of my thesis committee, Prof. Donald Berry and
Prof. Aleksandra Vojvodic, for their constructive suggestions as well as their hard
questions on my thesis. Their comments provided more insights to the content of my
research and made it more comprehensive from various aspects.
I will not forget the countless support I get from my amazing labmates, friends
and students here at UPenn. I am grateful for your generous help that pushed me forward.
I am honored that I have worked and lived with you. Thank you all for these great
memories.
Last but not the least, I want to express my deepest gratitude to my parents,
Yaoguang Cheng and Ruifen Zhang, and my wife, Yunzhu Zhuo. Thank you for showing
faith in me and giving me your consistent love, support and blessings. They mean
iii
ABSTRACT
IMPROVING PERFORMANCE OF INFILTRATED SOFC CATHODES
VIA SCAFFOLD ENGINEERING AND CATALYST SURFACE ENGINEERING
Yuan Cheng
Raymond J. Gorte
John M. Vohs
Solid Oxide Fuel Cells (SOFCs) are energy-generating devices operating at
elevated temperatures. At their cathode sides, oxygen molecules reduce into oxygen ions
and then transport to the anode side through a solid-state ceramic membrane (typically,
Yttria-Stabilized Zirconia (YSZ)). At their anode side, the fuels react with the oxygen
ions and then release electrons to the external circuit. Always, it is the cathode that has
the slowest reaction kinetics, such it contributes the largest resistance in the entire device.
The state-of-the-art cathode materials are typically perovskite-phase ceramic
materials, such as Strontium-doped Lanthanum Manganate (LSM), Strontium-doped
Lanthanum Ferrite (LSF) and Strontium-doped Lanthanum Cobaltite (LSC).
Conventionally, they are just printed to the well-sintered solid-state electrolyte surface
and then sinter again to a medium temperature (~1373K) to build contact with the
electrolyte. This brings multiple problems, such as solid-state reactions, bad mechanical
iv
which has nanoscale cathode materials distributed in a porous matrix of electrolyte, was
developed at Penn. Cathodes made with this method have multiple advantages such as a
significantly larger number of reaction sites, the avoidance of solid-state reactions, strong
mechanical properties and the match of coefficient of thermal expansion.
However, although infiltrated cathodes exhibit significantly better performances
than traditional printed cathodes, there is still room for improvement. An important
concern about the infiltration method is manufacturability. A single infiltration step takes
about 30 mins, and the infiltrated material per cycle is restricted by the volume of
material that can be added. Normally, 30 wt% loading of the nanoparticles in the cathode
matrix is necessary to achieve a good electronic conductivity, with only one thirds of the
nanoparticles are there for the surface reaction kinetics. Therefore, to improve the
manufacturability of infiltrated SOFC cathodes, one must develop an electronically
conductive cathode at a low loading of the cathode nanoparticles. In our study, we have
demonstrated a promising approach of using composite materials, such as LSF-YSZ and
LSCrF-YSZ, instead of single-phase YSZ as the matrix material. This allows the cathode
to have a better performance at low nanoparticles loading due to the incorporated
electronic conductivity in the porous matrix backbone.
Another approach to improve the cathode performance is to increase the surface
reaction kinetics of the infiltrated cathode materials. In this study, we used Atomic Layer
Deposition (ALD), a thin-film growth technology capable of making atomic-level
composition tuning, to reveal the desired surface composition of the perovskite-phase
cathodes for the sluggish oxygen reducing process. It was discovered that for the ABO3
v
reducing kinetics and it is very likely due to the increase in surface oxygen vacancies.
Computational study performed by our collaborator investigated the thermodynamic nature
of this configuration and suggested its thermal instability, which was proved by further
vi
Contents
Chapter 1. Introduction 1
1.1 Motivation 1
1.2 SOFC Operating Principles 1
1.3 Voltage Losses in SOFCs 3
1.4 Electrochemical Impedance Spectrometry (EIS) 5
1.5 State-of-the-art materials 7
1.5.1 Electrolyte Materials 7
1.5.2 Anode Materials 8
1.5.3 Cathode Materials 9
1.6 Printed SOFC cathodes vs. Infiltrated SOFC cathodes 11
1.7 Optimization opportunities for infiltrated SOFC cathodes 14
1.7.1 Developing a Mix-Conducting Scaffold for Infiltration 14
1.7.2 Studying the desired surface composition of the infiltrated nanoscale perovskite
materials 15
1.8 References 18
Chapter 2. Manufacturing Methods 22
2.1 Fabrication Procedure for Preparing Electrochemical Cells 22
2.1.1 Principles of Tape Casting 22
2.1.2 Dense electrolyte manufacturing using tape casting method 23
vii
2.1.4 Cell Lamination and Sintering 25
2.2 Impregnating Perovskite Materials via Infiltration Methods 25
2.3 Atomic Layer Deposition (ALD) 29
2.4 References 31
Chapter 3. Preparation of SOFC Cathodes by Infiltration into LSF-YSZ Composite
Scaffolds 33
3.1 Introduction 33
3.2 Experimental 36
3.3 Results 39
3.3.1 Compatibility of LSF and YSZ 39
3.3.2 The interface between the LSF-YSZ cathode and the YSZ electrolyte 40
3.3.3 The EIS result of a cathode with a conventional YSZ scaffold 42
3.3.4 The EIS result of a cathode with a LSF-YSZ composite scaffold 44
3.3.5 Applying this novel cathode in a SOFC 46
3.4 Discussion 49
3.5 Conclusions 50
3.6 References 51
Chapter 4. Optimization of LSF-YSZ Conductive Scaffolds for Infiltrated SOFC
Cathodes 54
4.1 Introduction 55
viii
4.3 Results & Discussion 57
4.3.1 Compatibility of Different LSF with YSZ 57
4.3.2 Total Conductivity of LSF-YSZ composite as a function of Sr content 60
4.3.3 Ionic Conductivity of LSF-YSZ composite as a function of Sr content 62
4.3.4 Symmetric cell test results of cathode with different scaffolds 66
4.3.5 Structural analysis of the scaffolds with SEM 69
4.4 Conclusions 71
4.5 References 72
Chapter 5. Cr-Doped LSF as A Zr-Excluding Component in Dual-Phase Cathode
Scaffold 74
5.1 Introduction 74
5.2 Experimental 75
5.3 Results and Discussion 76
5.3.1 Elimination of Zr incorporation with Cr doping into LSF 76
5.3.2 Conductivity of LSCrF-YSZ composites 79
5.3.3 Performance of LSCrF-YSZ composite scaffold 79
5.3.4 Structural defects of co-sintered LSCrF-YSZ composite scaffold 81
5.4 Conclusions 84
5.5 References 85
Chapter 6. Modification of LSF-YSZ Composite Cathodes by Atomic Layer Deposition
ix
6.1 Introduction 87
6.2 Experimental 89
6.3 Result 94
6.3.1 Effect of ZrO2 surface modification on LSF cathodes 94
6.3.2 Effect of Fe2O3 surface modification on LSF cathodes 97
6.3.3 Effect of La2O3 surface modification on LSF cathodes 99
6.3.4 Effect of La2O3 and Fe2O3 surface modification on LSF cathodes 100
6.4 Discussion 104
6.5 Conclusions 107
6.6 References 108
Chapter 7. Enhancing Oxygen Exchange Activity by Tailoring Perovskite Surfaces 111
7.1 Introduction 112
7.2 Methods 113
7.2.1 Experimental Methods 113
7.2.2 Computational Methods 116
7.3 Results and Discussion 117
7.3.1 ALD modification of cathode surfaces 117
7.3.2 Surface modification of LSF electrodes with A- and B-site cations 120
7.3.3 Thermal Stability Study of the AO-Terminated Perovskite Surface 126
7.3.4 Observation of Similar Effect on A-cation Modified LSM Systems 130
x
7.4 Conclusions 135
7.5 References 135
xi
List of Tables
Table 3.1: Ohmic and Non-Ohmic Resistances for Symmetric Cells prepared by infiltration of LSCF into either porous LSF-YSZ composite scaffolds or YSZ scaffolds.
46
Table 4.1: Ionic conductivities of dense materials used in this study. Results for the 40-wt% LSF82-YSZ composite and LSF82 were determined from oxygen fluxes measured
in a membrane reactor. 65
Table5.1: Conductivity test of La0.8Sr0.2CrxF1-x and La0.8Sr0.2CrxF1-x -YSZ composites. 79
xii
List of
Figures
Figure 1.1: Operation Principles of an SOFC. 3
Figure 1.2: V-I characteristics of a functioning SOFC. 4
Figure 1.3: A typical SOFC Nyquist plot. The frequency of the different data points drops from 30000 Hz to 0.01Hz from left to right. 6
Figure 1.4: An illustration of the active regions of a dual-phase cathode (LSM-YSZ) and
a MIEC cathode (LSCF). 11
Figure 1.5: SEM of an LSF-YSZ infiltrated SOFC cathode. The bulk part is the YSZ scaffold and the nanoparticles are infiltrated LSM materials. Reproduced from reference
[33]. 13
Figure 1.6: An illustration of the ALD process. The light blue sphere is the target metal atom and the wavy orange band surrounding it represent the bulky ligands. A full ALD cycle consists of dose-purge-oxidation steps. 17
Figure 2.1: An illustration of the tape casting process. 23
Figure 2.2: XRD result of the porous YSZ cathode infiltrated with LSM (a), LSF (b) and LSCo (c) after calcination at 1123 K. The perovskite phase peaks are labeled in red asterisks and the fluorite YSZ peaks are labeled with green triangles. 28
Figure 2.3: An illustration of the in-house built ALD system. Heating system is not
shown in the figure. 29
Figure 3.1: Schematic of the process used in making the composite electrodes. Although the anode part is not showing in this figure, it has been demonstrated that a Ni-YSZ cermet anode can also be co-sintered with YSZ electrolyte. 37
xiii
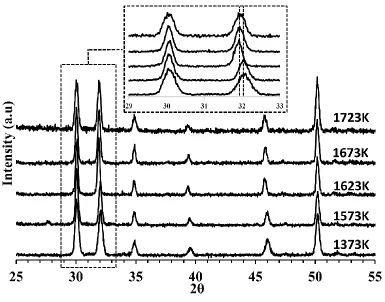
calcination at 1723 K. The inset shows the peak positions for the fluorite (near 30°) and perovskite (near 32°) phases in more detail. 40
Figure 3.3: An SEM image showing the interfacial region near the porous LSF-YSZ composite (at the top) and the dense YSZ (at the bottom). The sample was prepared by laminating a YSZ tape with a LSF-YSZ tape (containing graphite pore formers) and
calcining this to 1623 K. 41
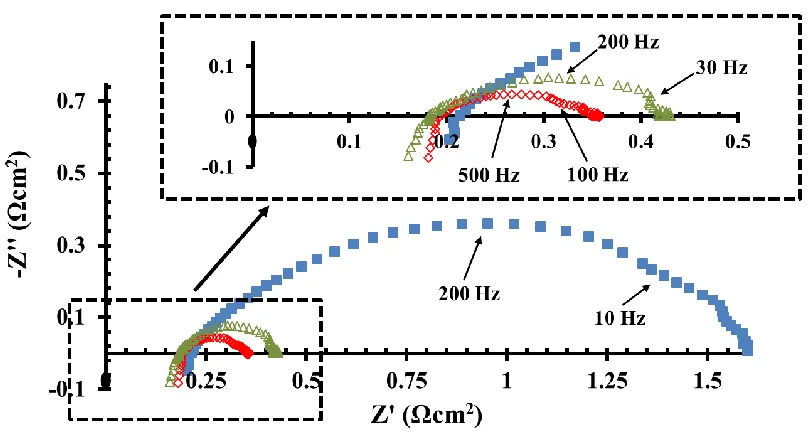
Figure 3.4: Nyquist plot showing the performance of symmetric cells with porous YSZ scaffolds at 973 K as a function of the number of LSCF infiltration cycles. The data is shown for cells with no added LSCF (◼), after 2 cycles (), and after 8 cycles (). 43
Figure 3.5: Nyquist plot showing the performance of symmetric cells with porous LSF-YSZ scaffolds at 973 K as a function of the number of LSCF infiltration cycles. The data is shown for cells with no added LSCF (◼), after 1 cycles (), and after 2 cycles (). 44
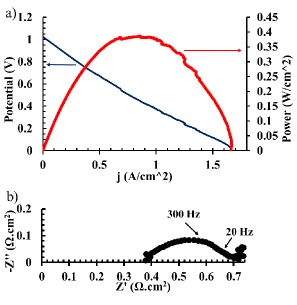
Figure 3.6: Electrochemical results for an SOFC at 973 K, made with a cathode prepared by infiltration of 2 LSCF cycles into a porous LSF-YSZ scaffold. The anode was 30 wt% LSV anode with 5 wt% ceria and 1 wt% Pd catalysts. V-i and P-i curves are shown in a). The open-circuit impedance spectrum is shown in b). 48
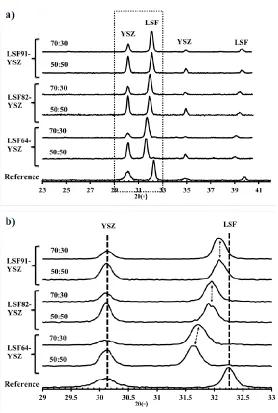
Figure 4.1: XRD patterns of LSF-YSZ mixtures after calcination at 1623 K for 4 h with different LSF:YSZ weight ratios (as indicated in the figure) and different La:Sr ratios in the LSF. The bottom pattern is that of a physical mixture of a 50-wt% LSF91-YSZ mixture prior to calcination. (a) shows the XRD patterns over a wider range of angles while (b) reports the same patterns in the region shown between the dashed lines in (a). 59
Figure 4.2: Total conductivity of dense 50-wt% LSF:YSZ composites and pure LSF as a function of the La:Sr ratio in the LSF. 62
xiv
Figure 4.4: Nyquist plots of symmetric cells with different cathode scaffolds in air as a function of the number of infiltration rounds in the scaffold. Hollow symbols (O) are for cells with bare scaffolds and filled symbols are for cells with two rounds () and eight rounds () of infiltration of LSCF. Data are shown at 973 K in (a) and 1073 K in (b). 67
Figure 4.5: Scanning Electron Micrographs of co-fired scaffold-YSZ electrolyte
interfaces. Data are show for (a) a pure YSZ scaffold, (b) a 50:50 LSF91-YSZ composite scaffold and (c) a pure LSF91 scaffold. 70
Figure 5.1: XRD data for LSCrxF1-x-YSZ mixtures at 1693 K. Room temperature
patterns indicate the peak positions of the unsintered materials. 78
Figure 5.2: Nyquist plots for cells with LSCrF-YSZ scaffolds and pure YSZ scaffolds collected in air at 973 K. Red squares (), green diamonds () and blue circles (О) are for cells with one, two, and ten, rounds of LSCoF infiltration, respectively. 81
Figure 5.3: SEM images of (a) (d) a cell with LSCrF-YSZ scaffolds, (b) (e) a cell with pure YSZ scaffolds, and (c) a cell with LSF-YSZ scaffolds. 83
Figure 6.1: Growth rate as a function of number of ALD cycles on γ-Al2O3 for a) ZrO2,
b) La2O3 and c) Fe2O3. 91
Figure 6.2: XRD patterns of the γ-Al2O3 sample before ALD modification and after
depositing 45 ALD cycles La2O3 and 15 ALD cycles of Fe2O3.The XRD are of a) Fresh,
unmodified γ-Al2O3; b) ALD-modified γ-Al2O3 after calcination to 873 K; c) the
ALD-modified sample after calcination to 1073 K. Characteristic peaks for LaFeO3 are marked by *, while obvious peaks associated with Al2O3 are marked by ●. 92
xv
Figure 6.4: Nyquist plots of LSF-YSZ cathode symmetric cells before and after Fe2O3
ALD treatment measured at 873 K. Black triangles (), diamonds (), and squares () represents cells after 5, 15, and 65 cycles of ZrO deposition, and red cycles () represent the pristine cell. The impedance spectra have been offset for clarity. 98
Figure 6.5: Nyquist plots of LSF-YSZ cathode symmetric cells before and after La2O3
ALD treatment measured at 873 K. The impedance spectra have been offset for clarity.
100
Figure 6.6: Nyquist plots of a LSF-YSZ cathode symmetric cell before and after La2O3
and Fe2O3 ALD treatment measured at 873 K. Labels on the right side if the curves show
how many cycles of ALD have been performed on the cell. The impedance spectra have
been offset for clarity. 102
Figure 7.1: Schematic showing the different ALD-modified surfaces that were
investigated in this study. 113
Figure 7.2: LEIS spectra obtained from (a) a pristine LSF slab that had been sintered at 1473 K, (b) the sample in (a) after 5 La ALD cycles, (c) a pristine high-surface area infiltrated LSF-YSZ composite cathode that had been sintered at1123 K and (d) the sample in (c) after 10 La ALD cycles. 119
Figure 7.3: Impedance spectra obtained from infiltrated LSF/YSZ composite cathodes as a function of the number of (a) La ALD cycles and (b) Sr ALD cycles. The polarization resistance, Rp, extracted from the impedance spectra as a function of the number of ALD
cycles and number of metal atoms deposited for each sample is plotted in panel (c). 121
Figure 7.4: Effect of La
2O3 ALD on infiltrated A-site deficient LSF (a), and B-site
deficient LSF (b). Pristine cell performance is denoted as black squares (). Red cycles () show the cell performance after 5 ALD cycles of La
2O3. 122
Figure 7.5: Effect of 5 ALD cycles of Pr2O3(a), and CaO (b) on LSF cells. Pristine cell
xvi
Figure 7.6: Effect of 5 ALD cycles of MnOx on LSF cells. Pristine cell performance is
denoted as black squares (). Red cycles () show the cell performance after 5 ALD
cycles. 125
Figure 7.7: Effect of the addition of submonolayer amounts (5 ALD cycles) of A-site and B-site cations on the Rp of infiltrated LSF/YSZ composite cathodes. 126
Figure 7.8: Summary of DFT study of the stability of various terminations of LaFeO3(001). The specific terminations that were studied are shown in (a) and the
calculated surface Gibbs free energy for each termination as a function of the Fe chemical potential is plotted in (b), and (c) provides impedance spectra for a composite LSF/YSZ cathode as a function of La ALD cycles and annealing temperature for comparison with
the stability calculations. 129
Figure 7.9: Impedance spectra obtained from (a) infiltrated LSM/YSZ and (b) LSCo/YSZ composite cathodes as a function of the number of La ALD cycles. The polarization resistance, Rp, extracted from the impedance spectra as a function of the
number of ALD cycles and number of metal atoms deposited for each sample is plotted in panel (c). To facilitate comparison, data for LSF/YSZ composite electrodes (from Figure 7.3) is also include in this plot. 131
Figure 7.10: Effect of 5 ALD cycles of Pr
2O3 (a), SrO (b), and MnOx (c) on LSM cells.
1
Chapter 1. Introduction
1.1 Motivation
Solid Oxide Fuel Cells (SOFCs) are an intriguing energy generating technology.
They are high-temperature, solid-state devices that can convert chemical energy to
electrical energy with high efficiency. They can use a variety of fuels, including hydrogen,
biogas, and hydrocarbons, and can have efficiencies of over 50% when generating
electricity [1–3]. Their reverse mode, Solid Oxide Electrolyser Cells (SOECs), can
efficiently generate fuels, such as H2 and CO from water and CO2 [4–6]. Because of their
potential, SOFCs are an attractive option for energy-efficient and low-carbon power
generation. The global SOFC market has been growing for the past 5 years and is projected
to reach USD 1.42 billion market size by 2025 [7].
Despite the promising future of this technology, there are still multiple
opportunities to optimize and promote this technology. One major problem is the
significant energy loss at the air electrode due to the sluggish reaction kinetics. The focus
of this thesis is on understanding and re-engineering the air electrode in order to reduce the
electrode loss.
1.2 SOFC Operating Principles
The primary components of an SOFC are the porous anode, the dense electrolyte
2
cathode side, gas-phase oxygen molecules dissociate on the cathode surface and combine
with electrons to form oxygen ions. This half-cell reaction is represented in equation 1.1:
𝑂2+ 4𝑒− → 2𝑂2− 1.1
The oxygen ions are then transported though the electrolyte to the anode side. Fuel enters
the anode and combines with the oxygen ions to form oxidized products, releasing
electrons as shown in equation 1.2 and 1.3:
𝐻2+ 𝑂2− → 𝐻2𝑂 + 2e− 1.2
𝐶𝑛𝐻2𝑛+2+ (3𝑛 + 1)𝑂2− → 𝑛𝐶𝑂
2 + (𝑛 + 1)𝐻2𝑂 + 2(3n + 1)e− 1.3
The potential energy of the released electrons is higher than that of the electrons entering
the cathode. These electrons can therefore perform work on an external circuit before
returning to the cathode. SOFCs normally operate at elevated temperatures (i.e. 873 to 1073
K) in order for there to be fast ionic transport through the electrolyte and good surface
reaction kinetics in the electrodes. The use of oxygen-ion conducting electrolytes allows
SOFC to operate on any combustible fuel, such as H2, CO and hydrocarbons, if appropriate
3
Figure 1.1: Operation Principles of an SOFC.
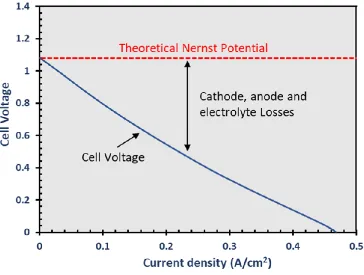
1.3 Voltage Losses in SOFCs
The output power of a cell is calculated from the product of the cell voltage and the
output current. The theoretical maximum voltage a fuel cell can generate is determined by
the Nernst equation (Equation 1.4), in which ∆𝐺 is the change in Gibbs Free Energy for
the reaction of interest, n is the number of transferred electrons in that reaction, F is the
Faraday constant, R is the Ideal Gas Constant, T is the absolute temperature, and the Pi are
the partial pressures of the products and reactants. Note that the potential can change due
to the concentration of reactants, products, and temperature.
𝑁𝑒𝑟𝑛𝑠𝑡 𝑃𝑜𝑡𝑒𝑛𝑡𝑖𝑎𝑙 = −∆𝐺
𝑛𝐹 − 𝑅𝑇 𝑛𝐹𝑙𝑛
∏ 𝑃𝑃𝑟𝑜𝑑
4
For an ideal process with no cell losses, the cell voltage will be equal to the Nernst
Potential. However, there will be energy losses in any real-world process; therefore, the
cell voltage will usually be lower than the Nernst Potential, although the cell voltage at
zero current, the open-circuit potential, may approach the Nernst Potential in many SOFC.
In all real cases, the cell potential will drop as current increases. Figure 1.2 shows the V-I
characteristics of a typical operating cell. The cell voltage deviates increasingly further
from the Nernst potential as the output current increases. While not a general principle, it
is commonly observed that the cell voltage decreases almost linearly with current for
SOFCs. In this case, the slope can be considered to be the total resistance of the cell.
5
There are a number of factors that can contribute to the total cell resistance. The
resistance due to transport of the charge carriers, primarily the ions moving through the
electrolyte, is always present and is referred to as the ohmic resistance. To minimize these
losses, the electrolytes are usually prepared as thin films since the ohmic resistance is
directly proportional to the electrolyte thickness. The resistances associated with the two
electrodes are sometimes referred to as polarization resistances. There are two types of
polarizations: activation polarization and concentration polarization. Activation resistances
are related to the reaction kinetics of the surface reactions at both electrodes. Since the
reduction of H2 on the anode side is fast for the anode-supported, Ni-based cells that are
most commonly used, it is usually the cathodic activation resistance that contributes the
majority of the activation resistance. The concentration polarization is due to transport
limitations of reactants to the electrode-electrolyte interface. Transport limitations are often
important in working fuel cell at high fuel utilizations but are not typically important for
lab-scale testing.
1.4 Electrochemical Impedance Spectrometry (EIS)
Although V-I polarization curves can measure the total resistance of a SOFC, they
are not able to separate the resistances of the individual components of the cell. In order to
test cathode performance, it is crucial to identify the cause of cell losses. For this purpose,
EIS is employed to assist the diagnosis of cells. EIS records the sinusoidal current response
of the system against a sinusoidal changing voltage to calculate the impedance of the
6
impedance, Z, which can then be separated into a real part (Z’) and an imaginary part (Z”).
By plotting Z’’ vs. Z’ over a wide frequency range, a Nyquist plot is generated. One
example is shown in Figure 1.3. The distance between the origin and each data point is the
absolute impedance at that frequency.
Figure 1.3: A typical SOFC Nyquist plot. The frequency of the different data
points drops from 30000 Hz to 0.01Hz from left to right.
In principle, a fuel cell can be modeled as a simplified equivalent circuit. The
electrolyte losses are purely resistive and can be modeled as a simple resistor. Since the
electrochemical reactions are frequency dependent, they are often modeled as a capacitor
7
at the electrode-electrolyte interface, due to the polarization phenomenon. The resistance
component models the sluggish surface reaction kinetics. A complete model of an SOFC
is generated by assembling every component in series.
During an EIS test, time-dependent processes cannot be observed at high
frequencies (the leftmost point in Figure 1.3). In the equivalent circuit representation, each
capacitor acts as a short. When the frequency is almost zero (rightmost data point in the
plot), one measures the total cell resistance (the slope of the V-i polarization curve). The
capacitors in the equivalent circuit are essentially open circuits. The difference between the
total cell resistance and the ohmic resistance is the polarization resistance, which is equal
to the length under the arc in the Nyquist plot. With this powerful tool, one can distinguish
between electrode and electrolyte losses.
1.5 State-of-the-art materials
1.5.1 Electrolyte Materials
A dense ion-conducting and electron-blocking ceramic electrolyte is essential to a
SOFC. Yttria-Stabilized Zirconia (YSZ) is currently the industrial standard for this
application. This fluorite-structured material is known for its relatively low cost, stability
in both oxidizing and reducing environments, and high oxygen conductivity at
medium-to-high temperatures. At the optimal Y-doping level, the ionic conductivity of YSZ at 973 K
is 0.019 S/cm [8]. As with most oxides, it can undergo solid-state reactions with the
8
La1-xSrxCoyFe1-yO3- (LSCF) and La1-xSrxCoO3- (LSCo), can form insulating phases at the
interface with YSZ if co-sintered [9–11]. Therefore, a thin and dense Gadolinium-Doped
Ceria (GDC) layer is usually applied between the cathode material and the YSZ electrolyte
as a barrier layer to prevent direct contact12,13,14.
1.5.2 Anode Materials
A Ni-YSZ, ceramic-metallic (cermet) composite has become the standard
high-performance anode material for H2 fueled SOFCs [15–18]. The cermet anode is typically
prepared by pressing or tape-casting a mixture of YSZ and NiO powders. After
high-temperature sintering, reduction of the NiO results in the Ni-YSZ cermet. In
anode-supported cells, a layer of YSZ powder is usually deposited onto the NiO-YSZ mixture
prior to sintering and the electrolyte and anode are then co-fired. The incorporation of YSZ
in the cermet anode makes the anode Coefficient of Thermal Expansion (CTE) more
closely match that of the electrolyte. It also provides pathways for oxygen-ion conduction
from the electrolyte. Therefore, well-made porous Ni-YSZ cermet anodes can have a low
resistance when used in anode-supported cells.
Although Ni/YSZ cermets work very well for H2 fueled SOFCs, they cannot be
used when hydrocarbon fuels are fed directly to the anode and suffer from redox
instabilities. Because Ni tends to form carbon fibers when exposed to dry hydrocarbons,
hydrocarbons must be externally reformed with steam to produce H2 and CO before being
fed to anode. Many coke-resistant anodes have been developed for direct hydrocarbon
9
La1-xSrxVO3- (LSV) [20,21] based, infiltrated anodes. These anodes are manufactured by
impregnating a porous YSZ anode with a conductive electronic material, LSV or LST,
together with catalytically materials such as ceria and Pd. The detailed instruction on
infiltration process can be found in Chapter 2. These anode have been proven to be
high-performance and coke-resistant.
1.5.3 Cathode Materials
It is commonly acknowledged that the cathode side has the largest resistance in
anode-supported fuel cells. The conventional cathode material was a mixture of
Strontium-doped Lanthanum Manganate (LSM) and YSZ, with LSM being the pure
electron-conducting phase and YSZ being the pure ion-electron-conducting phase [18,22,23]. The
oxygen-reduction reaction produces oxygen cations from the electrons and the oxygen molecules,
which then pass into the electrolyte. Therefore, the reaction can only happen at
three-phase-boundary (TPB) sites, which are those sites at the interface between LSM, YSZ, and the
gas phase [24]. LSM was chosen due to its moderate compatibility with YSZ at the cathode
sintering temperatures. One way to make this cathode is to take a slurry mixture of LSM
and YSZ and screen print it onto the sintered YSZ electrolyte. The cathode must then be
sintered, typically at 1473 K, to prepare a good interface.
Cathodes made in this manner have some disadvantages [24]. First, they have a high
polarization resistance, typically greater than 0.4 Ωcm2 at 973 K. This is due to the
randomly distributed reaction sites and the poor catalytic activity of LSM [25]. Second, the
sintering temperature is insufficient to form a robust connection between the cathode and
10
sintering at higher temperatures would cause LSM to react with YSZ and lead to an
insulating layer.
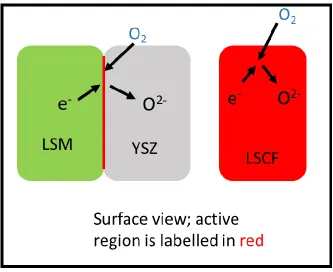
Mixed-ionic-and-electronic (MIEC) cathode materials, like LSCo, La1-xSrxFeO3-
(LSF) and LSCF, were developed as alternatives for dual-phase cathode materials [26–32].
Due to their mixed-conducting properties, the entire surface can be considered to be part
of the TPB. A comparison of the reaction mechanism of a dual-phase cathode material and
a MIEC cathode material is illustrated in Figure 1.4. The MIEC material clearly has a larger
region for surface reactions than the dual-phase perovskite material. Because of this, the
catalytic performance of these materials can be better than LSM-YSZ composites.
However, the electronic conductivity of LSF is deficient and cobalt-containing materials
can react with the YSZ electrolyte over time; therefore, high-temperature co-sintering is
11
Figure 1.4: An illustration of the active regions of a dual-phase cathode
(LSM-YSZ) and a MIEC cathode (LSCF).
1.6 Printed SOFC cathodes vs. Infiltrated SOFC cathodes
Conventional SOFC cathodes are printed onto the sintered electrolyte as the last
step during cell manufacturing. Due to the low reactivity of NiO and YSZ, the co-sintering
of the anode-electrolyte dual-layer structure is usually performed first with Ni-YSZ based
SOFC, with sintering performed at around 1673 K. After that, an ink consisting of the
12
temperature sintering at around 1373 K. There are issues associated with this process. First,
the CTE of the deposited material must match that of the electrolyte, which limits the
choice of materials that can be used in the cathode. Second, the best cathode materials
undergo solid-state reactions with the YSZ electrolyte at the required sintering
temperatures. Therefore, a barrier interlayer, typically GDC, is commonly applied between
the cathode and the electrolyte. This interlayer not only adds to the ohmic resistance but is
only partially able to block cation interdiffu24sion. Third, the sintering temperature must
be a compromise between two competing processes. If the temperature is too low, contact
between the cathode and the electrolyte is weak. But if the temperature is too high, the
solid-state reaction between the deposited cathode material and the electrolyte can
compromise the property of both parts. Therefore, printed cathodes often do not have good
contact with the barrier layer.
Manufacturing SOFC cathodes via an infiltration method was developed here at
Penn, initially as an attempt to avoid forming an insulating phase at the electrolyte interface
during the high-temperature sintering process [24]. In this method, the dense electrolyte and
a porous scaffold of the same material are formed together. Next, electronically conductive
and catalytic materials are infiltrated into the scaffold, after which the resulting structure is
calcined at a relatively low temperature (923 K to 1123 K) to form the catalytical perovskite
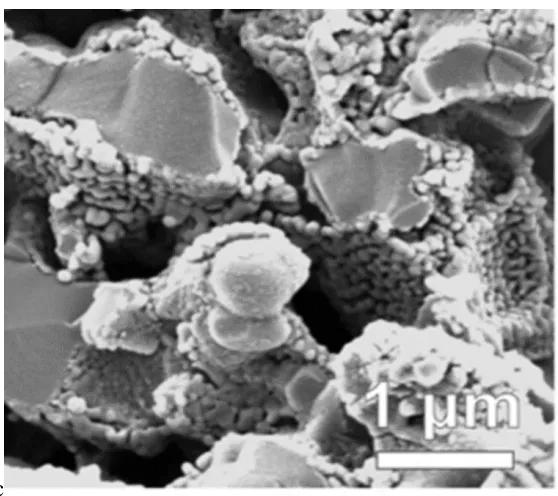
phase. Details about this method will be discussed in the next chapter. Figure 1.5 shows a
Scanning Electron Microscope (SEM) image of an infiltrated SOFC cathode. This
approach minimizes solid-state reactions because different sintering temperatures are used
for the scaffold and the infiltrated cathode materials. Since the scaffold is co-sintered to the
13
cathodes prepared from mixed powders, composites prepared by infiltration are not random
composites. One advantage of the non-random structure is that conductivity can be
achieved with a lower mass fraction of the electronic conductor. Another is that the CTE
in these non-random composites is closer to that of the electrolyte scaffold. Finally, the
performance of infiltrated electrodes can be very good, both because the ion-conducting
scaffold is well connected to the electrolyte and because the infiltrated phase can be
nano-structured, providing for a high surface area and catalytic activity.
cc
Figure 1.5: SEM of an LSF-YSZ infiltrated SOFC cathode. The bulk part is the
YSZ scaffold and the nanoparticles are infiltrated LSM materials. Reproduced from
14
1.7 Optimization opportunities for infiltrated SOFC cathodes
Cathodes formed by infiltration, which have nanoscale components dispersed in the
porous YSZ electrolytes, exhibit significantly better performance than traditional
screen-printed cathodes [9,24,34,35]. However, there is still room for improvement. In this thesis, I
examined ways to improve both the scaffold component and studied how modification of
the surface of the infiltrated component changes cathode performance.
1.7.1 Developing a Mix-Conducting Scaffold for Infiltration
An important concern about the infiltration method is manufacturability. A single
infiltration step takes about 30 mins, and the infiltration amount per cycle is restricted by
the volume of material that can be added [24,36,37]. For catalytic purposes, a few weight
percent of the cathode component would be sufficient [38]; however, this level of loading is
not sufficient to achieve the necessary electronic conductivity. Assuming that the YSZ
scaffold will have a porosity of about 65%, it is necessary to add about 30-wt% (20-vol%)
of the conducting oxide in order to achieve sufficient electrode conductivity [39]. With
solutions of nitrate salts, this typically requires at least 10 rounds of infiltration. Therefore,
to improve the manufacturability of infiltrated SOFC cathodes, one must develop an
electronically conductive cathode at a low loadings of the cathode components.
The general strategy we took is to prepare scaffold structure that were electronically
15
sufficient electronic conductivity was reduced. At the same time, it was necessary to have
the scaffold have oxygen-ion conductivity, so that the dissociated oxygen ions can diffuse
to the electrolyte interface. In addition, the scaffold material must be compatible with the
electrolyte so that addition of a barrier layer was not needed. Adding an additional barrier
layer would add an extra sintering step and extra ohmic resistance. Studies based on this
strategy are discussed in Chapter 3-5.
1.7.2 Studying the desired surface composition of the infiltrated nanoscale perovskite
materials
Another approach to improve the cathode performance is to increase the surface
reaction kinetics of the infiltrated cathode materials. The kinetics of a surface reaction are
related to both the total surface area and the number of reaction sites per surface area. Even
though the infiltrated nanoscale perovskites already provide huge surface areas, the
sluggish oxygen-reduction reaction often remains the largest resistance in the process.
Therefore, in addition to increasing the surface area, it is also important to understand the
surface compositions of these perovskites in order to maximize the surface reaction site
density.
Since the reduction of oxygen molecules can only happen at the very surface of a
cathode, it is crucial to tune the composition of the outermost layer of the perovskite.
However, because this layer is in a different environment from that of the bulk, its
composition could be different from that of the nominal composition of the infiltrated
material after the calcination step. Therefore, it is not possible to control the surface
16
Several groups have modified cathodes by infiltration with various metal oxides
and have reported lower cathode impedances [40,41]. However, this method modifies two
properties of the cathode at the same time: both the surface morphology and surface
composition are changed. Therefore, it is not clear from these experiments which factor is
responsible for the promotional effect. In addition, infiltration introduces particles, which
do not uniformly modify the substrate surface. Therefore, we used Atomic Layer
Deposition (ALD) to modify the surfaces of various cathodes, since this method changes
only the surface composition without affecting the morphology or surface area.
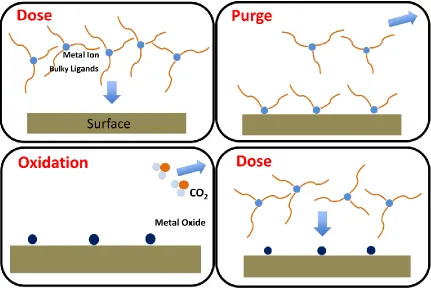
An illustration of the ALD process used in our lab is shown in figure 1.6. During
an ALD cycle, the surface is first exposed to an organometallic precursor molecule. The
molecules react with the surface; but, since they do not react with themselves, the reaction
is self-limited to one monolayer. After purging the excess precursors, the adsorbed
molecules are oxidized. This process can be repeated to grow thicker films. This method
was employed in our study to modify the composition of the outermost layer of the
17
Figure 1.6: An illustration of the ALD process. The light blue sphere is the target
metal atom and the wavy orange band surrounding it represent the bulky ligands. A full
18
1.8 References
1. Y. Yi, A. D. Rao, J. Brouwer, and G. S. Samuelsen, J. Power Sources, 144, 67–76
(2005).
2. R. Payne, J. Love, and M. Kah, 25, 231–239 (2009).
3. H. Zhu and R. J. Kee, J. Power Sources, 161, 957–964 (2006).
4. Q. Li et al., Int. J. Hydrogen Energy, 39, 10833–10842 (2014).
5. P. Iora and P. Chiesa, J. Power Sources, 190, 408–416 (2009).
6. J. Yan et al., J. Power Sources, 252, 79–84 (2014).
7. Grand View Research, Inc, (2019)
http://www.abnewswire.com/pressreleases/solid-
oxide-fuel-cells-market-size-projected-to-reach-usd-142-billion-by-2025-grand-view-research-inc_360372.html
8. V. V. Kharton, F. M. B. Marques, and A. Atkinson, Solid State Ionics, 174, 135–149
(2004).
9. Y. Cheng et al., J. Electrochem. Soc., 163, F54–F58 (2016).
10. Y. Cheng, T.-S. Oh, R. Wilson, R. J. Gorte, and J. M. Vohs, J. Electrochem. Soc.,
164, F525–F529 (2017).
11. D. Energia, P. Milano, and V. Lambruschini, 78, 729–740 (2017).
12. M. Izuki et al., J. Power Sources, 196, 7232–7236 (2011).
19
14. R. Küngas, F. Bidrawn, J. M. Vohs, and R. J. Gorte, Electrochem. Solid-State Lett.,
13, B87 (2010).
15. S. T. Aruna, M. Muthuraman, and K. C. Patil, 111, 45–51 (1998).
16. M. Ni, M. K. H. Leung, and D. Y. C. Leung, Int. J. Hydrogen Energy, 33, 2337–2354
(2008).
17. D. Mogensen, J.-D. Grunwaldt, P. V. Hendriksen, J. U. Nielsen, and K.
Dam-Johansen, J. Chem., 2014, 1–8 (2014).
18. N. Q. Minh, Solid State Ionics, 174, 271–277 (2004).
19. G. Kim, M. D. Gross, W. Wang, J. M. Vohs, and R. J. Gorte, J. Electrochem. Soc.,
155, B360 (2008).
20. J. S. Park et al., J. Power Sources, 196, 7488–7494 (2011).
21. L. Adijanto, R. Küngas, J. Park, J. M. Vohs, and R. J. Gorte, Int. J. Hydrogen Energy,
36, 15722–15730 (2011).
22. Y. Huang, J. M. Vohs, and R. J. Gorte, J. Electrochem. Soc., 152, A1347 (2005).
23. R. N. Basu, F. Tietz, E. Wessel, and D. Stöver, J. Mater. Process. Technol., 147, 85–
89 (2004).
24. J. M. Vohs and R. J. Gorte, Adv. Mater., 21, 943–956 (2009).
25. F. Bidrawn, R. Küngas, J. M. Vohs, and R. J. Gorte, J. Electrochem. Soc., 158, B514
(2011).
20 156, 20–22 (2006).
27. Y. Huang, J. M. Vohs, and R. J. Gorte, J. Electrochem. Soc., 152, A1347 (2005).
28. W. Wang, Y. Huang, S. Jung, J. M. Vohs, and R. J. Gorte, J. Electrochem. Soc., 153,
A2066 (2006).
29. H. J. Choi, K. Bae, D. Y. Jang, J. W. Kim, and J. H. Shim, J. Electrochem. Soc., 162,
F622–F626 (2015).
30. R. J. Gorte and J. M. Vohs, Annu. Rev. Chem. Biomol. Eng., 2, 9–30 (2011).
31. S. B. Adler, Chem. Rev., 104, 4791–4843 (2004).
32. C. Sun, R. Hui, and J. Roller, J. Solid State Electrochem., 14, 1125–1144 (2010).
33. R. Kungas, A. S. Yu, J. Levine, J. M. Vohs, and R. J. Gorte, J. Electrochem. Soc.,
160, F205–F211 (2012).
34. Y. Huang, J. M. Vohs, and R. J. Gorte, Electrochem. Solid-State Lett., 9, A237
(2006).
35. R. Kiebach et al., Fuel Cells, 16, 80-88 (2015).
36. S. Lee, G. Kim, J. M. Vohs, and R. J. Gorte, 1179–1183 (2008).
37. W. Wang, M. D. Gross, J. M. Vohs, and R. J. Gorte, J. Electrochem. Soc., 154, B439
(2007).
38. J. Ju, Y. Xie, Z. Wang, Y. Zhang, and C. Xia, J. Electrochem. Soc., 163, F393–F400
(2016).
21
40. D. Ding, X. Li, S. Y. Lai, K. Gerdes, and M. Liu, Energy Environ. Sci., 7, 552 (2014).
41. L. Zhang, T. Hong, Y. Li, and C. Xia, Int. J. Hydrogen Energy, 42, 17242–17250
22
Chapter 2. Manufacturing Methods
2.1 Fabrication Procedure for Preparing Electrochemical Cells
2.1.1 Principles of Tape Casting
Tape casting is been a well-established industrial method for mass production of
large-area, flat ceramic or metallic parts. An illustration of the tape-casting process is
shown in Figure 2.1. The key component of this method is a uniform slurry, which consists
of solvent, dispersant, binder, plasticizer, and metal-oxide powders [1]. The solvent is to
dissolve all the organic components and form the main body of the slurry. The dispersant
prevents the target particles in the slurry from agglomerating. The binder creates a polymer
matrix to trap the particles after the solvent is removed, and the plasticizer provides the
mechanical flexibility to the matrix. This uniform slurry is first poured into the reservoir.
On one side of this reservoir, a tunable doctor blade is set to leave a certain open space for
the slurry to exit. By drawing a mylar strip from under the doctor blade, a wet film of
well-defined thickness is prepared. The wet film will then be dried to eliminate the solvents
before the harvest of the dry tape. After this step, the dry tape can be cut into the desired
23
Figure 2.1: An illustration of the tape casting process.
2.1.2 Dense electrolyte manufacturing using tape casting method
A thin and dense electrolyte is crucial for high-performance SOFCs. The tape
casting method can be used to prepare thin ceramic films and for making layered structures;
therefore, it is ideal for manufacturing planar fuel cells [2–5]. In order to yield a dense
electrolyte, the powders for this application must be milled in order to produce uniformly
sized particles. Our lab uses TZ-8Y YSZ powders from TOSOH, which have crystallite
sizes of ~40 nm. However, since crystallites in these powders are often in the form
agglomerates, it is still necessary to mill them before use. The milling is performed while
the powders are mixed with an ethanol/xylene dual-solvent system, together with fish oil
24
poly(ethylene) glycol (both are plasticizers), so that the particles remain well separated.
The mixture was typically balled milled for 48 hours to yield a uniform slurry before
pouring into the reservoir for film manufacturing. The tape-casting procedure is described
in the previous segment. After a dry tape is harvested, it can be cut into round pieces and
then laminated with other tapes.
2.1.3 Porous electrode scaffold manufacturing using tape casting method
Most of the fuel cells used in my thesis used electrodes were prepared by infiltration.
The starting step in this process required preparation of porous-dense-porous structures
made from YSZ. The porous layers on either side of the dense electrolyte were used as
electrode scaffolds, into which the electrode material was infiltrated, as described in
Chapter 1. To prepare the porous-dense-porous structure, YSZ tapes with pore formers
included were laminated to the central tape that did not have pore formers.
The recipe for the porous tapes was similar to that used for the dense tapes, except
for the addition of pore formers. Several studies of pore formers were performed by earlier
students, and it was suggested that both pyrolyzable pore formers and NiO (followed by
acid etching) could be used to generate pores [6–9]. In our case, we chose to use 43 wt%
graphite powder to generate a 60-vol%, porous YSZ scaffold with pores of diameters
around 1~2 micron. The tape-casting recipe was otherwise the same as that used for dense
tapes and the slurry mixture was again ball milled for 48 hours to yield a uniform slurry
before again being cast into a tape as described in section 2.1.1. Circular pieces of the
25
2.1.4 Cell Lamination and Sintering
After preparing the porous and dense tapes, a tri-layer structure of the
porous-dense-porous tapes was made by lamination between two hot plates. It is important to keep
the plate temperature above the glass-transition temperature of the binders, but below that
which woudl cause thermal shock of the tape. The initial contact between layers was
induced by applying moderate pressure, avoiding too high a pressure which can lead to
undesired sticking or cracking. It is also recommended to use Mylar sheets in between the
tapes and the heating pads to avoid sticking.
The final step for manufacturing the tri-layer ceramic structure involves
high-temperature calcination. Due to the careful milling procedures used in our work, it was
usually sufficient to calcine the structure at 1673 K 4 h. During the sintering step, zirconia
plates were used to “sandwich” each sample in order to avoid contamination and curving.
For the present work, the final structures were 1.5 cm2 in area, with the porous electrode
scaffold part is 0.35 cm2 in area.
2.2 Impregnating Perovskite Materials via Infiltration Methods
A major advantage of electrodes prepared by infiltration of cathode components
into a porous scaffold of the electrolyte is that the porous scaffold can act as an
oxygen-ion conductor, so that oxygen oxygen-ions generated deep in the cathode can be conducted to the
electrolyte interface. However, the electrode must still be electronically conductive and be
26
materials must still be impregnated into the porous scaffolds. This is being done by
infiltration. In our case, a solution of the nitrate salts was first prepared. For example, if the
target material was to be LSCF, a saturated aqueous solution of La(NO3)36H2O,
Sr(NO3)24H2O, Fe(NO3)39H2O and Co(NO3)26H2O with desired molar ratio was
prepared. In each infiltration step, the scaffold was saturated with the solution at room
temperature, after which the excess solution on the surface was removed. After allowing
the cells to dry, they were heated to 873 K to decompose the nitrates. This procedure was
repeated for the desired number of infiltration cycles. After the final infiltration step, the
entire structure was heated to 1123 K to form the LSCF, perovskite phase.
The selection of calcination temperature is important for the infiltrated materials
since the surface morphology of the calcined nanomaterials are sensitive to the
preparation condition. In previous work, it was shown that the surface area of infiltrated
LSM changed as a function of calcination temperature, with the surface area decreasing
by a factor of four when the calcination temperature was increased from 1123 K to 1523
K [10]. In addition to surface area reduction, high temperature treatment can also cause the
solid-state reaction between the perovskites and the YSZ backbone, forming insulating
phases [11,12]. Therefore, it is important to avoid high-temperature calcination of the
infiltrated materials. However, if the calcination temperature is too low, the electronically
conductive perovskite phase will not be formed. Chelating agents, such as citric acid [13],
are often added with the infiltrating salt in order to promote formation of the perovskites
at lower temperatures. The chelating agents allow better mixing of the metal cations. For
most of the studies used in this work, the condition that we choose (1123 K), adding these
27
and LSCo prepared with the methods and conditions. The XRD results demonstrate that
one can form the perovskite phases without forming insulating phases. The surface area
28
Figure 2.2: XRD result of the porous YSZ cathode infiltrated with LSM (a), LSF
(b) and LSCo (c) after calcination at 1123 K. The perovskite phase peaks are labeled in
red asterisks and the fluorite YSZ peaks are labeled with green triangles.
LSCo O
29
2.3 Atomic Layer Deposition (ALD)
As discussed in section 1.7.2, it is useful to study the effect of surface composition
on the electrochemical performance of the infiltrated electrodes, independent of the surface
morphology. Therefore, ALD was chosen to modify the surface composition. The
home-built ALD setup is shown schematically in Figure 2.3. This setup was designed to allow
two different precursors to alternatively react with the sample surface, with intermittent
oxidizing steps.
Figure 2.3: An illustration of the in-house built ALD system. Heating system is
not shown in the figure.
We found that there are three key design factors that were important for our
process. First, it was important to be able to evacuate the sample so that we could use
30
pressures of the precursors used in most of our work were below a few torr, even at
elevated temperatures, this meant that the maximum base pressure for the sample
chamber was 200 millitorr.
To achieve a sufficient vapor pressure of the precursor, it was necessary to heat
the precursor. Furthermore, to avoid condensation, all of the tubing between the precursor
and the sample had to be heated as well. Because chemical vapor deposition will occur at
too high a temperature, there exists a temperature window for ALD [14,15]. Ideally, the
sample temperature should be high enough to allow oxidation of the adsorbed precursor.
Finally, to avoid diffusional limitations with low-vapor-pressure precursors, the
sample dimensions had to be sufficient small and the exposure times sufficiently long. As
suggested by Onn et al. [16], a higher precursor vapor pressure results in a larger driving
force. In most of our trials, we used between 30 s and 2 min for each dosing and
31
2.4 References
1. R. E. Mistler and Eric. R. Twiname, Tape Casting Theroty and Practice, The
American Ceramic Society, Westerville, (2000).
2. M. Han et al., J. Power Sources, 165, 757-763 (2007).
3. J. H. Myung, H. J. Ko, C. H. Im, J. Moon, and S. H. Hyun, Int. J. Hydrogen Energy,
39, 2313–2319 (2014).
4. Z. Wang, J. Qian, J. Cao, S. Wang, and T. Wen, J. Alloys Compd., 437, 264–268
(2007).
5. H. Moon, S. D. Kim, S. H. Hyun, and H. S. Kim, Int. J. Hydrogen Energy, 33, 1758–
1768 (2008).
6. C. S. Ni, J. M. Vohs, R. J. Gorte, and J. T. S. Irvine, J. Mater. Chem. A, 2, 19150–
19155 (2014).
7. M. Boaro, J. M. Vohs, and R. J. Gorte, J. Am. Ceram. Soc., 86, 395–400 (2003).
8. R. J. Gorte, S. Park, J. M. Vohs, and C. Wang, Adv. Mater., 12, 1465–1469 (2000)
9. H. Kim, C. da Rosa, M. Boaro, J. M. Vohs, and R. J. Gorte, J. Am. Ceram. Soc., 85,
1473–1476 (2002).
10. V. A. C. Haanappel et al., J. Power Sources, 141, 216–226 (2005).
11. H. He et al., J. Am. Ceram. Soc., 87, 331–336 (2004).
12. R. Küngas, F. Bidrawn, J. M. Vohs, and R. J. Gorte, Electrochem. Solid-State Lett.,
32
13. A. V. Call, J. G. Railsback, H. Wang, and S. A. Barnett, Phys. Chem. Chem. Phys.
(2016).
14. H. C. M. Knoops et al., Electrochem. Solid-State Lett., 12, G34 (2009).
15. E. Granneman, P. Fischer, D. Pierreux, H. Terhorst, and P. Zagwijn, Surf. Coatings
Technol., 201, 8899–8907 (2007).
33
Chapter 3. Preparation of SOFC Cathodes by Infiltration into
LSF-YSZ Composite Scaffolds*
Summary
Fabrication of SOFC cathodes by infiltration of La0.8Sr0.2Co0.2Fe0.8O3-δ (LSCF)
into porous scaffolds that were 50-wt% composites of La0.8Sr0.2FeO3-δ (LSF) and YSZ
were investigated for purposes of reducing the number of infiltration steps required to
make conductive electrodes. XRD patterns of porous, LSF-YSZ composites prepared by
tape casting and calcined to 1723 K showed only fluorite and perovskite phases and were
sufficiently conductive that 30-µm thick films attached to YSZ electrolytes did not
substantially contribute to the ohmic resistance in symmetric cells or SOFC. Non-ohmic
losses at 973 K were reduced from 1.4 Ωcm2 to 0.16 Ωcm2 by two infiltration cycles of
LSCF.
3.1 Introduction
As mentioned in Section 1.6, Solid Oxide Fuel Cell (SOFC) cathodes are
conventionally prepared from mixed powders of LSM and YSZ, often by screen printing
the mixture onto the dense electrolyte [1].The performance of these composite electrodes
is enhanced relative to that of the pure conductive ceramic because the ion-conducting
component provides channels for transporting oxygen ions from the electrolyte to the
______________
34
surface of the electrode [2]. However, manufacturing cathodes using infiltration method
brings in multiple advantages [3,4,5]. This method separates the calcination of the
backbone material and the catalytic material, thus avoids the solid-state reaction. In
addition to its initial intention, this non-random structure showed other advantages, such
as great mechanic property, CTE match, high surface area and high catalytic activity.
This allows the flexibility in infiltrated materials, including LSM, LSCo, LSF and LSCF.
A major issue with using infiltration methods to synthesize electrodes is that
many steps are usually required to achieve the necessary loading of the electronically
conductive phase [6]. For example, past work on electrodes prepared by infiltration of
La0.8Sr0.2FeO3 (LSF) into 65%-porous YSZ showed that the LSF loading needed to be at
least 35-wt% (20-vol%) in order for there to be sufficient electronic conductivity for the
ohmic resistance of the electrode to be negligible [7]. A simple calculation of the LSF
loading that can be theoretically achieved by filling the scaffold pores with a 1-M
solution of La, Sr, and Fe, in the appropriate molar ratios, shows that a single infiltration
step can only give 2.3-vol% LSF. Even using molten nitrate salts [8], the theoretical
loading per step is less than 5-vol%. It is important to notice that these calculations are
based on filling the entire pore volume of the scaffold with the infiltrating solution.
Because capillarity is a far greater driving force than evacuation, vacuum infiltration does
not increase the amount of fluid that enters the pores and does not affect the required
number of cycles, an observation that has also been verified experimentally [9]. Although
higher loadings could be achieved using a concentrated solution of oxide nanoparticles
[8], the ligands required to keep the nanoparticles suspended in solution are typically too
35
Because the need for high loadings of the infiltrated phase is required to achieve
electronic conductivity, it should be possible to obtain good performance with lower
loadings if the scaffold is conductive. This approach has been used in the preparation of
SOFC anodes by infiltration [10]. In that case, the porous scaffold was a composite of
La0.7Sr0.3TiO3 (LST) and YSZ, two oxides that can be co-fired to high temperatures
without causing solid-state reactions between the phases. Unfortunately, the conductivity
of the porous LST-YSZ scaffold, by itself, was insufficient for good electrode
performance. Enough conductivity could be achieved by infiltrating additional LST;
however, electrodes prepared from the composite scaffold were still not as good as those
obtained by simply infiltrating LST into a YSZ scaffold [11]. Because LST is not a good
ion conductor, it is likely that reduced ionic conductivity within the scaffold was
responsible for the decreased performance.
In the present work, we set out to investigate the possibility of preparing
infiltrated cathodes using a composite scaffold of LSF and YSZ. Previous reports have
shown that LSF and YSZ are relatively unreactive towards each other [12,13].
High-temperature sintering of LSF-YSZ mixtures has been reported to cause Zr to enter the
perovskite phase, as evidenced by a shift in the LSF/perovskite lattice parameter; but,
even after calcination of the mixtures to 1523 K, no additional phases were observed in
this past work. Doped LaFeO3 is also interesting because this material has a high ionic
conductivity in addition to its electronic conductivity. It is commonly used in ceramic
membranes as a Mixed Ionic and Electronic Conductor (MIEC) [14] and one recent study
reported that Ca-doped LaFeO3 (LCF) has an ionic conductivity that is 50% higher than
36
In confirmation of the hypothesis, we demonstrate here that an LSF-YSZ scaffold
can provide the electronic and ionic conductivity required for good cathode performance.
Catalyst addition is required to reduce the non-ohmic losses in the electrode but
reasonable performance can be achieved by using just one or two infiltration steps.
3.2 Experimental
The general scheme for making the cathodes used in the cells of this study has
been shown in Figure 3.1. A green tape containing mixtures of LSF and YSZ, together
with pore formers, was laminated onto a normal YSZ tape; and the two-layer structure
was sintered to a temperature high enough to form a dense YSZ electrolyte, as described
in Section 2.1. The porous LSF-YSZ scaffold was then infiltrated with aqueous solutions
of the nitrate salts of La, Sr, Co, and Fe to form the LSCF (La0.6Sr0.4Co0.2Fe0.8O3) phase
after calcination to 1123 K. For symmetric cells, composite electrodes were formed on
both sides of the YSZ electrolyte. For fuel-cell measurements, a porous YSZ scaffold was
37
Figure 3.1: Schematic of the process used in making the composite electrodes.
Although the anode part is not showing in this figure, it has been demonstrated that a
Ni-YSZ cermet anode can also be co-sintered with Ni-YSZ electrolyte.
The LSF powder used in the preparation of the composite scaffolds was
synthesized by sol-gel methods. The appropriate amounts of La(NO3)36H2O (Alfa Aesar,
99%), Sr(NO3)24H2O (Alfa Aesar, 99.0%), and Fe(NO3)39H2O (Alfa Aesar, 98.5%)
were dissolved in distilled water, along with the complexing agent, citric acid (Fisher
Scientific, 1:1 ratio with the metal cations). This solution was then dried at 373 K, and
the resulting gel was calcined in air at 1123 K to form the perovskite phase. YSZ was
purchased from Tosoh (8-YSZ, TZ-8Y). Tapes for the LSF-YSZ composite scaffolds
were prepared by mixing equal weights of LSF and YSZ, together with other components
introduced in Section 2.1, using a recipe that is described in detail elsewhere [16]. After