R E S E A R C H
Open Access
Equivalence of electronic and paper
administration of patient-reported outcome
measures: a systematic review and meta-analysis
of studies conducted between 2007 and 2013
Willie Muehlhausen
1*, Helen Doll
1, Nuz Quadri
1, Bethany Fordham
1, Paul O
’
Donohoe
2, Nijda Dogar
1and Diane J. Wild
1Abstract
Objective:To conduct a systematic review and meta-analysis of the equivalence between electronic and paper
administration of patient reported outcome measures (PROMs) in studies conducted subsequent to those included in Gwaltney et al’s 2008 review.
Methods:A systematic literature review of PROM equivalence studies conducted between 2007 and 2013 identified 1,997 records from which 72 studies met pre-defined inclusion/exclusion criteria. PRO data from each study were extracted, in terms of both correlation coefficients (ICCs, Spearman and Pearson correlations, Kappa statistics) and mean differences (standardized by the standard deviation, SD, and the response scale range). Pooled estimates of correlation and mean difference were estimated. The modifying effects of mode of administration, year of publication, study design, time interval between administrations, mean age of participants and publication type were examined.
Results:Four hundred thirty-five individual correlations were extracted, these correlations being highly variable (I2 = 93.8) but showing generally good equivalence, with ICCs ranging from 0.65 to 0.99 and the pooled correlation coefficient being 0.88 (95 % CI 0.87 to 0.88). Standardised mean differences for 307 studies were small and less variable (I2 = 33.5) with a pooled standardised mean difference of 0.037 (95 % CI 0.031 to 0.042). Average administration mode/platform-specific correlations from 56 studies (61 estimates) had a pooled estimate of 0.88 (95 % CI 0.86 to 0.90) and were still highly variable (I2 = 92.1). Similarly, average platform-specific ICCs from 39 studies (42 estimates) had a pooled estimate of 0.90 (95 % CI 0.88 to 0.92) with an I2 of 91.5. After excluding 20 studies with outlying correlation coefficients (≥3SD from the mean), the I2 was 54.4, with the equivalence still high, the overall pooled correlation coefficient being 0.88 (95 % CI 0.87 to 0.88). Agreement was found to be greater in more recent studies (p< 0.001), in randomized studies compared with non-randomised studies (p< 0.001), in studies with a shorter interval (<1 day) (p< 0.001), and in respondents of mean age 28 to 55 compared with those either younger or older (p< 0.001). In terms of mode/platform, paper vs Interactive Voice Response System (IVRS) comparisons had the lowest pooled agreement and paper vs tablet/touch screen the highest (p< 0.001).
(Continued on next page)
* Correspondence:[email protected] 1
ICON Clinical Research, 6th Floor Seacourt Tower, West Way, Oxford OX2 0JJ, UK
Full list of author information is available at the end of the article
© 2015 Muehlhausen et al.Open AccessThis article is distributed under the terms of the Creative Commons Attribution 4.0 International License (http://creativecommons.org/licenses/by/4.0/), which permits unrestricted use, distribution, and reproduction in any medium, provided you give appropriate credit to the original author(s) and the source, provide a link to the Creative Commons license, and indicate if changes were made. The Creative Commons Public Domain Dedication waiver (http://creativecommons.org/publicdomain/zero/1.0/) applies to the data made available in this article, unless otherwise stated. Muehlhausenet al. Health and Quality of Life Outcomes (2015) 13:167
(Continued from previous page)
Conclusion:The present study supports the conclusion of Gwaltney’s previous meta-analysis showing that PROMs administered on paper are quantitatively comparable with measures administered on an electronic device. It also confirms the ISPOR Taskforce´s conclusion that quantitative equivalence studies are not required for migrations with minor change only. This finding should be reassuring to investigators, regulators and sponsors using questionnaires on electronic devicesafter migration using best practices. Although there is data indicating that migrations with moderate changes produce equivalent instrument versions, hence do not require quantitative equivalence studies, additional work is necessary to establish this. Furthermore, there is the need to standardize migration practices and reporting practices (i.e. include copies of tested instrument versions and screenshots) so that clear recommendations regarding equivalence testing can be made in the future.raising questions about the necessity of conducting equivalence testing moving forward.
Keywords:Equivalence, Meta-analysis, Pen and paper, Web/computer platform, IVRS platform, Tablet/touchscreen platform, PDA/smartphone platform
Introduction
The implementation of electronic data capture (EDC) in clinical trial settings has become more commonplace as the use of electronic devices in everyday life has become more widespread. Tablets and smart phones are used universally across many age groups [1, 2] and prior experience is not a prerequisite for their use [3]. Smart phone subscription is expected to reach 5.6 billion by 2019 [4]. The advantages of using EDC for the adminis-tration of patient-reported outcome measures (PROMs) rather than paper-and-pencil administration have been well documented; these include reduction in administra-tive burden, automatic implementation of skip patterns and scoring, avoidance of secondary data entry errors, time and date stamped data, and fewer items of missing data [5].
The FDA states in its Final PRO Guidance document [6] that the migration of validated paper instruments to electronic platforms should be supported with evidence: “additional validation to support the development of a modified PRO instrument” is required, including when “an instrument’s data collection mode is altered”, with specific reference to “paper-and-pencil self-administered PRO administered by computer or other electronic device (e.g., computer adaptive testing, interactive voice response systems, web-based questionnaire administra-tion, computer)”(p.20-21).
There is, however, lack of clarity in the FDA guidance document on the type of evidence required to support PRO to ePRO migrations. As a consequence, the ISPOR ePRO Task Force, led by Stephen Coons, was established to address this issue [7]. This Task Force developed rec-ommendations on how to demonstrate measurement equivalence between electronic and paper-based PROMs, where measurement equivalence refers to the comparabil-ity of the conceptual and psychometric properties of the data obtained via the two administration modes [7]. In this
respect, the level of modification to the content and for-mat of the paper PROM to produce an electronic version (and, increasingly, between various electronic modes) de-termines how comparable the two versions are and thus the evidential requirements to demonstrate equivalence between versions.
Coons et al. [7] categorised the magnitude of the modification into three levels, whereby the potential effect on the content, meaning, or interpretation of the measure’s items and/or scales is assessed. If a paper-and-pencil questionnaire is simply placed into a text screen format without significantly altering item content, recall period or response options, this is considered a minor modification. Minor levels of modification also include going from multiple items per page to one item per screen, for example on a handheld device. The level of evidence required to show equivalence for a minor modification is cognitive interviewing and usability testing.
Where a modification is considered to be moderate, Coons et al. [7] suggest that the modification may result in changes to the (perceived) meaning of the assessment items. Examples of moderate changes include splitting an item into multiple screens (e.g., having a question and its responses on different screens), using a scroll bar to view all item text or responses, and changing the order of item presentation. Where such modifications are made, the level of evidence required would involve conducting quantitative equivalence testing, which eval-uates the comparability between PROM scores from the electronic mode of administration and the original mode. The intent is to ensure scores do not vary signifi-cantly between modes, barring measurement error. Us-ability testing is also recommended, to ensure prospective participants experience no issues with the usability of the device. The most common moderate change is from a text based to an interactive voice response system (IVRS). This
is considered to be a moderate change because of the difference in cognitive processes involved in responding to an item visually as opposed to aurally.
Substantial modifications occur when significant changes are made to the original assessment, such as changes to the wording or response options. Coons et al [7] suggest that this can fundamentally change the prop-erties of the original instrument and the migrated instru-ment should be treated as a brand new instruinstru-ment requiring full psychometric testing.
Prior to the Coons et al.’s [7] framework being estab-lished, Gwaltney et al. [8] performed a meta-analysis of equivalence studies (excluding those conducted with IVRS) that had been conducted up until 2006, including studies directly assessing the equivalence of paper and ‘computer’versions of PROMs used in clinical trials. As this meta-analysis was conducted before Coons et al.’s [7] recommendations were published, the rationale pro-vided for conducting equivalence testing is broad. The approach that Gwaltney et al. [8] supported, and thus the basis of conducting their meta-analysis, was to pro-vide epro-vidence on quantitative equivalence between modes of administration.
The present study was conducted to provide further evidence on the equivalence between questionnaire scores obtained from paper administration and after mi-gration onto one or more electronic platforms. In order to provide this evidence, a systematic review and meta-analysis was performed on equivalence studies con-ducted since 2007, i.e., since the conduct of Gwaltney et al’s [8] meta-analysis. It was expected that as a conse-quence of recent advances in technology, the electronic platforms to which the questionnaires are migrated, such as tablets, laptops and smart phones, will be more vari-able, but that they will be easier to use and will not require prior experience. Ease of use of electronic devices has been shown to result in better compliance and satisfaction [9], therefore reducing potential bias even if respondents are less technologically competent. Thus we hypothesised that the meta-analysis would again show high equivalence scores for instruments migrated to a different administration mode.
Studies that had migrated a questionnaire to an IVRS were also included in the present study; these studies had been excluded from Gwaltney et al’s 2008 analysis [8]. IVRS is frequently used in clinical research [10] and it is considered to be a more substantial change to mi-grate from paper to IVRS than, for example, to a tablet or smart phone [7], and so we sought to explore the equivalence of scores obtained using this platform.
The present study also explores potential publication bias in the literature. It is possible that studies which demonstrate a lack of equivalence are not submitted for publication, thus risking giving a false impression
of the success of migration to and between electronic platforms.
Methods
Searching
In order to conduct a refined search in this area of lit-erature, the papers that were included in the Gwaltney et al. [8] review were searched for the indexed terms used in three databases: Embase, Medline and PsycInfo. From this list of indexed terms, those terms that were appropriate to re-running the search were highlighted (e.g., questionnaires, microcomputers, mobile devices, crossover design). A list of terms was created under three headings: ‘PROMs’,‘equivalence’ and ‘technology’. Using appropriate Boolean operators, these terms were used in separate searches run in the three databases, with limits placed on the last 6 years (Jan 2007 - Dec 2013) and selecting human studies only.
Once the three searches had been run, the results were exported to Reference Manager to amalgamate the abstracts. The search was further refined by searching through the first 100 abstracts to identify any other rele-vant indexed terms. This refinement was conducted so that current terminology, which may not have shown up in Gwaltney et al. [8], could be used in the new search. After identifying additional search terms, the final search terms were produced and the searches rerun in the three databases. This search yielded 2,271 abstracts. Additional grey literature was examined by searching conference proceedings of relevant conferences (ISPOR and ISO-QOL), the clinical trials registry, and by searching secondary references of articles included in the main search. A further 318 records were identified using this approach.
Inclusion criteria
A number of criteria were specified to select appropriate studies for inclusion in the review and subsequent ana-lysis. To be included, abstracts and full-text papers/post-ers had to describe a study which (a) was based on the numeric equivalence of questionnaire scores and no other types of equivalence such as conceptual equiva-lence, (b) include two different modes of administration, (c) administer a PROM, and (d) provide a statistical result of the equivalence of two questionnaires’ scores (e.g., intra-class correlation coefficient (ICC), Pearson’s correlation, mean difference). The abstract review was conducted by one researcher, who then conferred with another researcher regarding the exclusion of an ab-stract. Full-text papers/posters were sought for abstracts meeting the criteria. If the abstract suggested that the study might be suitable, but it did not provide details of any of these four criteria, the full-text paper/poster was also sought to assess the study based on these same
criteria and to decide whether or not the study should be included. Each full-text paper/poster was then reviewed once by the first researcher, and then a second time by the other researcher, to determine whether or not the study met the inclusion criteria.
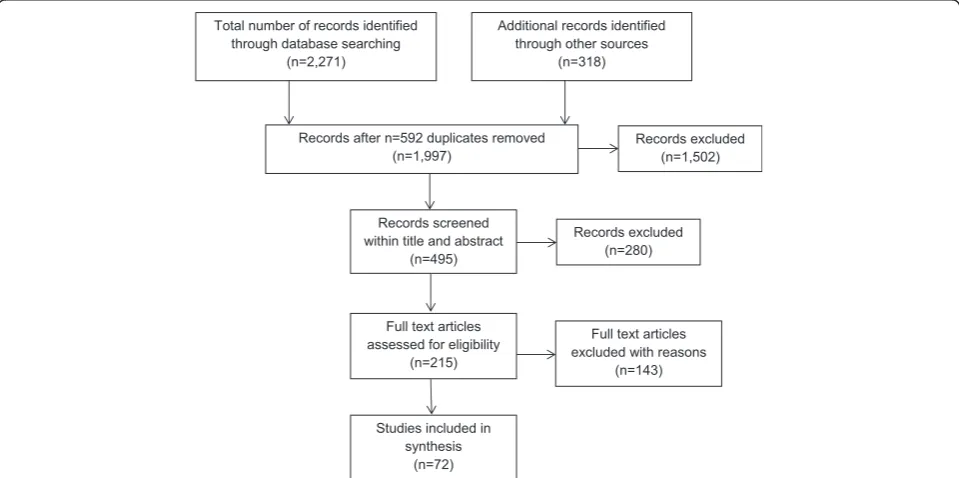
The total number of records identified using each of the database and grey literature approaches are shown in the study PRISMA diagram Fig. 1, along with the number of duplicates removed (n= 592), number of articles removed after title only analysis (n= 1502), the numbers of abstracts screened (n= 495) and, of these, the number excluded for one or more of the above reasons (n= 280); the number of full text papers assessed (n= 215) and, of these, the number excluded (n= 143) again for one or more of the above reasons; and the total number of studies meeting the criteria and included in the synthesis (n= 72).
Data analysis Data extraction
For all 72 studies that were included in the meta-analysis, the following data were extracted: (a) name and details of PROM, (b) disease area, (c) study design (parallel groups design or cross-over design), (d) the modes of administra-tion used and details of how these were implemented, (e) mean age and standard deviation (SD) of the participants, (f) the statistic used and the result, and (g) the administra-tion interval. Key features of each study were also identi-fied using a modiidenti-fied data extraction proforma guided by the Strengthening the Reporting of Observational Studies in Epidemiology (STROBE) statement [11]. This data
extraction process also served as a critical appraisal process of each study but was not used to exclude any studies from the analysis.
The mean (SD) age of participants was extracted where it was presented. If it was not, then the median age was extracted, or the mean age was calculated from either the presented frequency distribution (with SD also calculated) or the average of minimum and maximum age. Data on the equivalence between the administration modes was extracted for measures of correlation and mean difference. The data on the correlation between questionnaire administrations was extracted as an ICC, Pearson or Spearman correlation coefficient, or a Kappa statistic (weighted or unweighted). Data on mean differ-ences were extracted as a mean difference between administrations with either the presented instrument score standard deviation (SD), standard error (SE), or a 95 % confidence interval (CI), or as separate mean scores for each administration with their own SD, SE, or 95 % CI. The study-specific SD was calculated, where this was not provided, using the sample size and either the SE or 95 % CI. Since it was the magnitude of the difference between administration modes, rather than its direction that is of primary interest, the absolute differ-ence was used in the analysis. This approach also is con-servative since it does not allow for positive and negative differences cancelling each other out [8]. Where paired data were available these were used in preference to data from the separate administration groups. Each mean dif-ference was standardized by its extracted SD, meaning a standardized mean difference of 0.5 is a mean difference
Fig. 1Flow chart showing process of identification and selection of studies for synthesis
equivalent to 0.5 (half ) of a standard deviation. In addition, since not all studies provided data from which the SD could be calculated, the response scale of each instrument was also extracted (e.g., an instrument scored 0 to 10 has a response scale of 11) and each mean difference standardised by the response scale. Thus, if the mean difference was 2 points on a 100-scale instrument, the standardised mean difference was scored as 2.0 %. This allowed the differences to be measured in terms of scale point difference where information on SD was not available. This was the approach used to com-pare mean differences by Gwaltney et al. [8].
Data synthesis and meta-analysis
Syntheses were conducted first over all individual mea-sures of correlation and all mean differences calculated within each study (i.e., including multiple measures of agreement per study where these were available, such as for different scales within one instrument and different instruments). The main analyses, however, used only one (average) measure of agreement for each study: the average ICC alone; the average ICC, correlation and/or kappa coefficient in each study where multiple coeffi-cients were presented; and the average scaled mean difference. This ensured that no one study made a disproportionate contribution to the analysis. For all analyses, however, syntheses were achieved using a weighted linear combination of the study estimates so as to give more weight to studies of larger size.
The correlation and standardised mean difference data were synthesized using both the ‘metan’ command within Stata v12.1 [12] and Comprehensive Meta Analysis (CMA) v2 software [13] which allows multiple types of data (e.g., mean differences) to be synthesised within the same analysis. Fisher’s z transformations were applied to the correlations within both Stata and CMA. Standard meta-analytic techniques, however, could not be used for the scale-standardised mean differences, as for these no estimate of SD is provided. Instead, simple means and SDs across individual scale-standardised values were calculated to estimate the average scale-point standardised differ-ence. These estimates were calculated over all individual standardised values and over average standardised values calculated for each study.
The degree of heterogeneity between the study esti-mates was calculated using the I2statistic [14], a meas-ure describing the percentage of total variation across the studies that can be explained by heterogeneity rather than chance. Values of I2 lie between 0 % and 100 % with the larger the value the greater the heterogeneity; values of 25 %, 50 %, and 75 % have been proposed to indicate low, moderate, and high heterogeneity, respect-ively [15]. If values of I2> 0.75 were identified, random effects models were used to synthesise the individual
study estimates; fixed effect models were used otherwise (and to explore the effect of any potential moderating factors). Any potentially outlying studies were identified (those with an effect size more than 3.0 SDs away from the pooled effect) and the I2 values and pooled effect size recalculated. In exploring the effect of potential moderating variables, fixed effects models were used, with the potential moderating variable treated as a fixed effect. Potential moderating variables considered were, where appropriate: mode of administration/platform (paper vs PC, paper vs PDA, paper vs tablet, paper vs IVRS, PC vs IVRS, tablet vs PC); year of publication (2007, 2008–2010, 2011, 2012–2013; 2007–2010 vs 2011–2013); study design (two variables: randomised cross-over, non-randomised cross-over, within-patient study (a study not formally comparing administration/ platform but in which some patients completed more than one mode), parallel groups (for which only analysis of mean differences was possible); non-randomised vs randomised); time interval between administrations (<1 day, 1–5 days, 6–14 days, 15+ days; <1 day, 1–9 days, 10+ days; <1 day, 1+ days), mean age of partici-pants (<28, 28–46, 47–55, 56+ years), sample size (≤50, 51–100, >100 participants) and publication type (ab-stract/poster vs full-text paper). The modifying effect of these study characteristics on mean score differences and correlations was explored by calculation of pooled values for studies grouped by these factors (year of pub-lication, study design, mode of administration/platform, time interval between administrations, mean age, sample size and publication type). Analyses of variance, with cal-culation of QWand QBstatistics [15], where appropriate, were used to compare estimates between groups of studies.
The likelihood of publication bias was estimated with the use of funnel plots along with Duval and Tweedie’s Trim and Fill to estimate the likely number of missing studies (under both fixed and random effects models) and provide estimates of the overall effect after including any identified missing studies. Orwin’s fail-safe N was also used, as in Gwaltney et al. [8], to estimate the num-ber of studies required to bring the observed correlation below 0.75, taking the average correlation as the lowest observed individual study correlation.
Results
Study characteristics
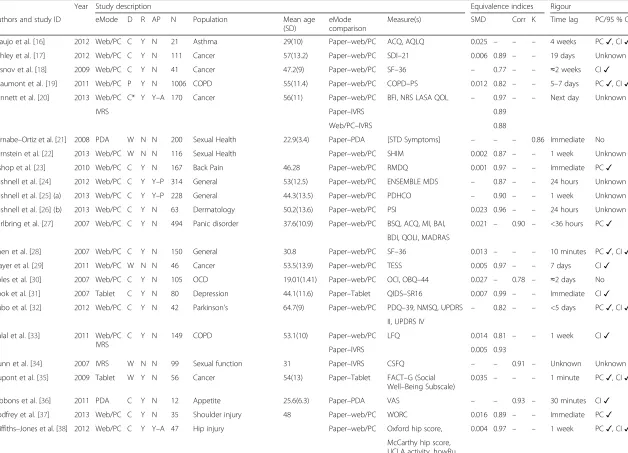
Characteristics of all 72 studies meeting the inclusion criteria and included in the meta-analysis are listed in Table 1. Data for four of these studies were available from conference posters and five from abstracts; the remainder from full-text publications. The number of PRO instruments assessed within each study ranged from one to ten, with the number of individual analyses
Table 1Characteristics of studies included in the meta–analysis
Year Study description Equivalence indices Rigour
Authors and study ID eMode D R AP N Population Mean age
(SD)
eMode comparison
Measure(s) SMD Corr K Time lag PC/95 % CIs
Araujo et al. [16] 2012 Web/PC C Y N 21 Asthma 29(10) Paper–web/PC ACQ, AQLQ 0.025 – – – 4 weeks PC✓, CI✓
Ashley et al. [17] 2012 Web/PC C Y N 111 Cancer 57(13.2) Paper–web/PC SDI–21 0.006 0.89 – – 19 days Unknown
Basnov et al. [18] 2009 Web/PC C Y N 41 Cancer 47.2(9) Paper–web/PC SF–36 – 0.77 – – ≈2 weeks CI✓
Beaumont et al. [19] 2011 Web/PC P Y N 1006 COPD 55(11.4) Paper–web/PC COPD–PS 0.012 0.82 – – 5–7 days PC✓, CI✓
Bennett et al. [20] 2013 Web/PC C* Y Y–A 170 Cancer 56(11) Paper–web/PC BFI, NRS LASA QOL – 0.97 – – Next day Unknown
IVRS Paper–IVRS 0.89
Web/PC–IVRS 0.88
Bernabe–Ortiz et al. [21] 2008 PDA W N N 200 Sexual Health 22.9(3.4) Paper–PDA [STD Symptoms] – – – 0.86 Immediate No
Bernstein et al. [22] 2013 Web/PC W N N 116 Sexual Health Paper–web/PC SHIM 0.002 0.87 – – 1 week Unknown
Bishop et al. [23] 2010 Web/PC C Y N 167 Back Pain 46.28 Paper–web/PC RMDQ 0.001 0.97 – – Immediate PC✓
Bushnell et al. [24] 2012 Web/PC C Y Y–P 314 General 53(12.5) Paper–web/PC ENSEMBLE MDS – 0.87 – – 24 hours Unknown
Bushnell et al. [25] (a) 2013 Web/PC C Y Y–P 228 General 44.3(13.5) Paper–web/PC PDHCO – 0.90 – – 1 week Unknown
Bushnell et al. [26] (b) 2013 Web/PC C Y N 63 Dermatology 50.2(13.6) Paper–web/PC PSI 0.023 0.96 – – 24 hours Unknown
Carlbring et al. [27] 2007 Web/PC C Y N 494 Panic disorder 37.6(10.9) Paper–web/PC BSQ, ACQ, MI, BAI, 0.021 – 0.90 – <36 hours PC✓
BDI, QOLI, MADRAS
Chen et al. [28] 2007 Web/PC C Y N 150 General 30.8 Paper–web/PC SF–36 0.013 – – – 10 minutes PC✓, CI✓
Clayer et al. [29] 2011 Web/PC W N N 46 Cancer 53.5(13.9) Paper–web/PC TESS 0.005 0.97 – – 7 days CI✓
Coles et al. [30] 2007 Web/PC C Y N 105 OCD 19.01(1.41) Paper–web/PC OCI, OBQ–44 0.027 – 0.78 – ≈2 days No
Cook et al. [31] 2007 Tablet C Y N 80 Depression 44.1(11.6) Paper–Tablet QIDS–SR16 0.007 0.99 – – Immediate CI✓
Cubo et al. [32] 2012 Web/PC C Y N 42 Parkinson’s 64.7(9) Paper–web/PC PDQ–39, NMSQ, UPDRS – 0.82 – – <5 days PC✓, CI✓
II, UPDRS IV
Dalal et al. [33] 2011 Web/PC IVRS
C Y N 149 COPD 53.1(10) Paper–web/PC LFQ 0.014 0.81 – – 1 week CI✓
Paper–IVRS 0.005 0.93
Dunn et al. [34] 2007 IVRS W N N 99 Sexual function 31 Paper–IVRS CSFQ – – 0.91 – Unknown Unknown
Dupont et al. [35] 2009 Tablet W Y N 56 Cancer 54(13) Paper–Tablet FACT–G (Social
Well–Being Subscale)
0.035 – – – 1 minute PC✓, CI✓
Gibbons et al. [36] 2011 PDA C Y N 12 Appetite 25.6(6.3) Paper–PDA VAS – – 0.93 – 30 minutes CI✓
Godfrey et al. [37] 2013 Web/PC C Y N 35 Shoulder injury 48 Paper–web/PC WORC 0.016 0.89 – – Immediate PC✓
Griffiths–Jones et al. [38] 2012 Web/PC C Y Y–A 47 Hip injury Paper–web/PC Oxford hip score, 0.004 0.97 – – 1 week PC✓, CI✓
McCarthy hip score, UCLA activity, howRu
Muehlhaus
en
et
al.
Health
and
Quality
of
Life
Outcomes
(2015) 13:167
Page
6
of
Table 1Characteristics of studies included in the meta–analysis(Continued)
Gudbergsen et al. [39] 2011 Tablet C Y N 20 Osteoarthritis 66.5(7) Paper–Tablet KOOS, VAS (pain, 0.024 0.95 – – 5 minutes PC✓, CI✓
function, global), SF–36, PainDirect
Handa et al. [40] 2008 Web/PC C Y N 43 Gynecology 52(13) Paper–web/PC PFDI–20, PFIQ–7 – 0.86 – – <6 weeks PC✓, CI✓
Heiberg et al. [41] 2007 PDA C N N 38 Rheumatology 58.4(12.9) Paper–PDA VAS, SF–36, m–HAQ 0.010 – – – 3 weeks Unknown
Hollandare et al. [42] 2010 Web/PC C Y N 87 Depression 41.1(13) Paper–web/PC MADRS–S, BDI–II 0.012 – 0.87 – ≈10 days No
Hollen et al. [43] 2013 PDA W N N 86 Cancer 67 Paper–PDA LCSS – 0.92 – – 15 minutes CI✓
Inman et al. [44] 2012 Web/PC W N Y–A 1439 Rheumatology 56.5(14) Paper–web/PC HAQ–II, Pain, GA, 0.006 – – – 6 months Unknown
Fatigue
Jaspan et al. [45] 2007 PDA C Y N 212 Sexual beh. 14.5(2.75) Paper–PDA Individual items 0.035 – 0.72 – 2 weeks CI✓
Jones et al. [46] 2008 Web/PC P N N 183 Mental health 20.1(2.6) Paper–web/PC PIQ, LSHS–R 0.016 – – – N/A No
Juniper et al. [47] 2007 PDA C Y N 70 Rhino–conjunctivitis 41 Paper–PDA RQLQ 0.014 0.90 – – 2 hours No
Juniper et al. [48] 2009 PDA C Y N 68, 27
Asthma & Rhino– conjunctivitis
41 Paper–PDA AQLQ(S), ACQ, RQLQ(S) – 0.89 0.89 – 2 hours CI✓
Junker et al. [49] 2008 PDA C Y N 200 Chronic pain 57 Paper–PDA Average, present,
worst pain & PainDetect
0.026 – – – <1 day PC✓, CI✓
Kajander et al. [50] 2007 PDA W N Y–A 15 IBS 42 Paper–PDA IBS 0.008 0.96 – – Unknown CI✓
Koolen et al. [51] 2011 Web/PC C* Y N 156 Asthma 11.25(1.9) Paper–web/PC C–ACT, ACT – 0.83 – – <5 days PC✓, CI✓
Lam et al. [52] 2009 IVRS C Y N 64 IBD 43.1(13.8) Paper–IVRS SIBDQ 0.013 – 0.89 – ≈7 days No
Lee et al. [53] 2009 Tablet C Y N 261 Asthma 40.8(12.1) Paper–Tablet A–QOL – – – 0.85 Unknown Unknown
Luce et al. [54] 2007 Web/PC C* Y N 74 Eating disorders 15.4(0.3) Paper–web/PC risk for eating disorders 0.025 – – 0.74 1 week Unknown
Lundy and Coons [55] 2011 IVRS C Y N 113 General 61.5 Paper–IVRS EQ–5D index & VAS 0.018 0.89 – 0.71 3 days Unknown
Lundy et al. [56] 2013 IVRS C Y N 139 Cancer 61.5 Paper–IVRS QLQ–C30 0.015 0.82 – – 2 days PC✓, CI✓
Mackenzie et al. [57] 2011 Web/PC C Y N 56– 63
Psoriatic 53 Paper–web/PC HAQ, SF–36, mFSS, 0.003 0.95 – – Consecutive CI✓
Arthritis FACIT–F, DLQI, BASDAI,
BASFI, BASG, BASQoL, EQ–5D
Marceau et al. [58] 2007 PDA C Y N 36 Chronic Pain 48 (8) Paper–PDA Pain diary 0.020 2 weeks No
Matthew et al. [59] 2007 PDA C* Y N 39– 53
Cancer 67.2(10.3) Paper–PDA IPSS 0.042 0.85 30 minutes No
McCarrier et al. (a) [60] 2011 Web/PC C* Y Y–A 258 Mental Health 48.6(13.5) Paper–web/PC PHQ–4 – 0.86 – – 1 week Unknown
McCarrier et al. (b) [61] 2011 Web/PC C* Y Y–P 256 General 48.6(13.5) Paper–web/PC MOS–SSS – 0.89 – – 1 week Unknown
McCarrier et al. [62] 2013 Web/PC C* Y Y–P 230 Multiple 44.3(13.5) Paper–web/PC DBS 0.020 0.88 – – 24 hours PC✓, CI✓
Mundt et al. [63] 2010 IVRS W N N 62 Mental health Paper–IVRS DAS–A 0.019 0.87 0.89 – 24 hours Unknown
Parnell et al. [64] 2011 Web/PC C Y N 50 Pelvic floor 50.4(11.6) Paper–web/PC PISQ–12 0.008 0.88 – – 2 weeks PC✓, CI✓
Muehlhaus
en
et
al.
Health
and
Quality
of
Life
Outcomes
(2015) 13:167
Page
7
of
Table 1Characteristics of studies included in the meta–analysis(Continued)
Raat et al. (a) [65] 2007 Web/PC P Y N 933 Child health 14.7(0.68) Paper–web/PC CHQ 0.010 – – – – Unknown
Raat et al. (b) [66] 2007 Web/PC P Y N 933 Asthma 14.7(0.68) Paper–web/PC ISAAC 0.008 – – – N/A PC✓
Ramachandran et al. [67] 2008 Tablet C Y N 314 General 35.5(14) Paper–Tablet EQ VAS 0.014 0.75 – – Unknown Unknown
Read et al. [68] 2009 Web/PC C N N 38 Trauma 19.6(1.5) Paper–web/PC TLEQ, PCL–C 0.058 – 0.69 – 1 week No
Richardson et al. [69] 2009 Web/PC P N N 354 Smoking Dx 16(1.55) Paper–web/PC Social and emotional dependence, physical and sensory
0.052 – – – N/A No
Richter et al. [70] 2008 Tablet C Y N 153 Rheumatology 45.7(14.4) Paper–Tablet FFbH. HAQ. BASDAI, SF–36
0.001 – 0.97 – Unknown Unknown
Salaffi et al. [71] 2009 Tablet C Y N 87 Rheumatology 65 Paper–Tablet VAS–GH/Pain/PGA, ROAD, TJC
0.008 0.92 – – 60 minutes CI✓
Saunders et al. [72] 2007 Web/PC C* N N 50 Hearing loss 65.6(8.9) Paper–web/PC ALHQ – – 0.74 – 9–10 days CI✓
Shervin et al. [73] 2011 Web/PC W N N 61 Osteoarthritisa 63 Paper–web/PC The Harris hip score, 0.017 – 0.85 – Immediate PC✓
Tablet Others Paper–Tablet WOMAC, SF–36, EQ– 0.005 0.84
Tablet–web/PC 5D, UCLA activity score 0.013 0.90
Swartz et al. [74] 2007 PDA C Y N 756 Mental Health 55(13) Paper–PDA CES–D 0.023 – – – Immediate Unknown
Thoren et al. [75] 2012 Web/PC C Y N 53 Hearing loss 68.3(11.3) Paper–web/PC HHIE, IOI–HA, SADL, HADS
0.016 – 0.73 – 3 weeks No
Tiplady et al. [76] 2010 PDA C Y N 43 Rheumatoid Arthritis 57 Paper–PDA HAQ–DI, EQ–5D, BPI, MPQ–SF, FACIT–F, SF–36, SARA
0.009 0.88 – – 1 hour CI✓
Turvey et al. [77] 2012 IVRS W N N 51 Mental Health 68(8) Paper–IVRS PHQ–9 0.036 0.65 – – 1 week No
Vallejo et al. [78] 2007 Web/PC W N N 185 Mental Health 27.4(10.0) Paper–web/PC GHQ–28, SCL–90–R 0.020 – 0.69 – ≈17 days No
Vallejo et al. [79] 2008 Web/PC C Y N 40 Mental Health 22.2 Paper–web/PC GHQ–28,
SCL–90(Spanish) – –
0.84 – <1 week No
Varni et al. [80] 2008 Web/PC C Y N 92 Diabetes 13.2(3.42) Paper–web/PC PedsQL 4.0 0.007 0.89 <5 minutes No
Vinney et al. [81] 2011 PDA C Y N 19 Speech 9.58(1.22) Paper–PDA PedsQL 4.0. 0.008 0.86 – – 3 weeks PC✓
Whitehead et al. [82] 2011 Web/PC P Y N 1034 Mental Health 24.07(8.5) Paper–web/PC HADS, SF–36v2, FSI and Fatigue item
0.012 – – – N/A CI✓
Wijndaele et al. [83] 2007 Web/PC W N N 130 Mental health 46.5 Paper–web/PC GHQ–12, SCL–90–R, MOS–SSS, PSS, UCL –
0.76 – – 1 week No
Wu et al. [84] 2009 Web/PC C Y N 34 Heart failure 49(14.2) Paper–web/PC KCCQ, MLHFQ, SCHFI 0.027 – – – 2 weeks CI✓
Muehlhaus
en
et
al.
Health
and
Quality
of
Life
Outcomes
(2015) 13:167
Page
8
of
Table 1Characteristics of studies included in the meta–analysis(Continued)
Young et al. [85] 2009 Web/PC C Y N 69 Child health 11(1.55) Paper–web/PC ASK, PedsQL 0.013 0.81 – – 2 weeks CI✓
Yu and Yu, 2007 [86] 2007 Web/PC P Y N 1171 Mental health Paper–web/PC CES–D Chinese 0.019 – – – N/A No
Zimmerman & Martinez [87]
2012 Web/PC W N N 53 Mental health 45.1(12.3) Paper–web/PC CUDOS 0.009 0.96 – – <2 days No
Ccrossover, C* 3/4–group crossover,Pparallel,Wwithin subjects,Ddesign,Rrandomisation,APabstract/poster,Kkappa (weighted or unweighted),SMDscaled mean difference (study average),Time lagtime between administrations,PC/95 % CIspower calculation or precise 95 % confidence intervals,Dxdiseases
ACQAgoraphobic Cognitions Questionnaire,ACTAsthma Control Test,ALHQThe Attitudes towards Loss of Hearing Questionnaire,AQAAsthma Control Questionnaire,AQLQ(S)Asthma Quality of Life Questionnaire,
ASKActivities Scale for Kids,A–QOLAsthma–specific Quality of Life,BAIBeck Anxiety Inventory (BAI),BASDAIBath Ankylosing Spondylitis Disease Activity Index,BASFIBath Ankylosing Spondylitis Functional Index,BASG
Bath Ankylosing Spondylitis Global Score,BASQoLAnkylosing Spondylitis Quality of Life Instrument,BDIBeck Depression Inventory,BFIBowel Function Instrument,BPIBrief Pain Inventory,BSQBody Sensations Questionnaire,C–ACChildhood Asthma Control Test,CES–DCenter for Epidemiologic Studies Depression,CHQChild Health Questionnaire,COPDChronic Obstructive Pulmonary Disease,COPD–PSCOPD Population Screener,CSFQChanges in Sexual Functioning Questionnaire,CUDOSClinically Useful Depression Outcome Scale,DAS–AAssessment Scale for Anxiety,DBS4 item Disease Burden Scale,DLQI
Dermatology Life Quality Index,ENSEMBLE MDSa battery of phenotypic patient–reported instruments administered at baseline in clinical studies,EQ–5DEuroQOL–5 Dimensions,EQ VASEuroQOL Visual Analog Scale,FACTFunctional Assessment of Cancer Therapy,FACIT–FThe Functional Assessment of Chronic Illness Therapy Fatigue,FFbHHannover Functional Ability Questionnaire,FSIFatigue Symptom Inventory,GAGlobal Assessment,GHQ–12General Health Questionnaire–12 items,GHQ–28General Health Questionnaire–28 items,HAQ–IIHealth Assessment Questionnaire II,HAQ–DIHealth Assessment Questionnaire Disability Index,HHIEHearing Handicap Inventory for the Elderly,howRUa short generic tool for measuring patient–reported outcomes,IBDIrritable Bowel Disease,IBSIrritable Bowel Syndrome,IOI–HAInternational Outcome Inventory for Hearing Aids,IPSSInternational Prostate Symptom Score,ISSACEight items from the International Study of Asthma and Allergies in Childhood,KCCQ
Kansas City Cardiomyopathy Questionnaire,KOOSKnee injury and Osteoarthritis Outcome Score,LCSSLung Cancer Symptom Scale,LFQLung Function Questionnaire,LSHS–RThe revised Launay–Slade Hallucination Scale,MADRASMontgomery Asberg Depression Rating Scale,MADRS–SMontgomery Asberg Depression Rating Scale,m–FSSThe modified Fatigue Severity Scale,m–HAQModified Health Assessment Questionnaire,MIMobility Inventory,MLHFQMinnesota Living with Heart Failure Questionnaire,MOS–SSSMedical Outcomes Study Social Support Scale,MPQ–SFMcGill Pain Questionnaire,
NMSQNon–Motor Symptoms Questionnaire;NRS LASA QoLNumerical Rating Scale Linear Analogue Self–Assessment of Quality of Life,OBQ–44Obsessive Beliefs Questionnaire–44,OCIObsessive Compulsive Inventory,PCL–C Posttraumatic Stress Disorder Checklist–Civilian Version,PDHCOThe Provider–Dependent Health Care Orientation,PDQ–39Parkinson´s Disease Questionnaire,PedsQL 4.0Pediatric Quality of Life Inventory,PFDI–20Pelvic Floor Distress Inventory–20,PFIQ–7Pelvic Floor Impact Questionnaire–7,PHQ–4Patient Health Questionnaire,PHQ–9Patient Health Questionnaire,PIQThe Persecutory Ideation Questionnaire,PISQ–12Pelvic Organ Prolapse/ Urinary Incontinence Sexual Function Questionnaire,PSIPsoriasis Symptom Inventory,PSSPerceived Stress Scale,QLQ–C30Quality of Life Questionnaire–Cancer 30 items,QOLIQuality Of Life Inventory,QUIDS–SR1616–item Quick Inventory of Depressive Symptomatology Self–Rated,RMDQRoland Morris Disability Questionnaire,ROADRecent–Onset Arthritis Disability questionnaire,RQLQ(S)Rhinoconjunctivitis Quality of Life Questionnaire,SADL
Satisfaction with Amplification in Daily Life,SARASubjects Assessment of Rheumatoid Arthritis,SCHFISelf–Care of Heart Failure Index,SCL–90–RSymptoms Check–List–90–Revised,SDI–21Social Difficulties Inventory,SF–36 Short Form Survey 36 items,SHIMSexual Health Inventory for Men,SIBDQThe Short Inflammatory Bowel Disease Questionnaire,TESSToronto Extremity Salvage Score,SS–5Perceived Social Support,TESSThe Toronto Extremity Salvage Score,TIBITotal Illness Burden Index Truncated Questionnaire,TJCTender Joint Count,TLEQTraumatic Life Events Questionnaire,UCLA–AUniversity of California at Los Angeles activity score,UCLA–AUtrecht Coping List,UPDRS IIUnified Parkinson's Disease Rating Scale II,UPDRS IVUnified Parkinson's Disease Rating scale IV,VASVisual Analog Scale,VAS–GHVisual Analog Scale–General Health,WOMACWestern Ontario and McMaster Universities Osteoarthritis Index,WORCThe Western Ontario Rotator Cuff Index
a
When reported as≥0.85 this is recorded as 0.85
Muehlhaus
en
et
al.
Health
and
Quality
of
Life
Outcomes
(2015) 13:167
Page
9
of
within each study ranging from one to 60. These instru-ments included generic measures such as the Short Form 36 Health Survey (SF-36) and condition specific measures such as the Rhino-conjunctivitis Quality of Life Questionnaire (RQLQ); for a full list of the instru-ments included see Table 1. Studies were conducted in over 23 different population types, with the most fre-quent population being mental health (n= 15 studies). The studies included data collected from four different electronic platforms [PC, handheld (PDA/smartphone), IVRS, tablet/touch screen], the most commonly used platform being PC (used in n= 43 studies), followed by PDA (n= 14 studies), tablet/touch screen (n= 8 studies) and IVRS (n= 7 studies). The average age of the partici-pants in the studies ranged from 9.58 to 68.3 years, with an overall mean age of 42.9 (SD 17.1) years.
Overall relationship between paper and electronic assessments
Mean differences
There were 307 individual estimates of group mean dif-ference (independent group difdif-ferences or, in predif-ference, paired differences) either with a standard deviation (SD) or with data from which a standard deviation could be calculated. These estimates had low variability with an I2 of 33.47; the fixed effects pooled estimate of absolute mean difference was 0.037 (95 % CI 0.031 to 0.042).
There were 355 individual estimates of group mean differences which could be standardised by the scale score. The mean scale-standardised difference was 0.0180 scale points, i.e., 1.80 % of the score range, (range = 0.00 to 0.13, 0 to 13 %; SD = 0.021) with the upper bound of the 95 % CI (0.015 to 0.020) indicating that the difference in absolute scores between platforms is likely to be at most 2.0 %. The mean difference was within 5 % of the scale score in 93 % of estimates. For the scale-standardised scores averaged over 54 studies with data on mean differences, the mean scale-standardised difference was slightly smaller at 0.0167 scale units (range = 0.001 to 0.058; SD = 0.012), with 95 % CI 0.013 to 0.020. Two of these studies [33, 72] had data on different platform comparisons, giving 57 mean differences by study and platform in total (platform-specific comparisons), with a mean of 0.0163 (range 0.001 to 0.057; SD = 0.012), with 95 % CI 0.013 to 0.019, and 97 % having a value within 5 % of the scale score.
Correlations
435 individual correlations were extracted from all 72 studies, these being highly variable, with an I2 of 93.75 %. The random effects pooled correlation coeffi-cient was 0.875 (95 % CI 0.867 to 0.884). Correlations averaged over the values in each of 56 studies with
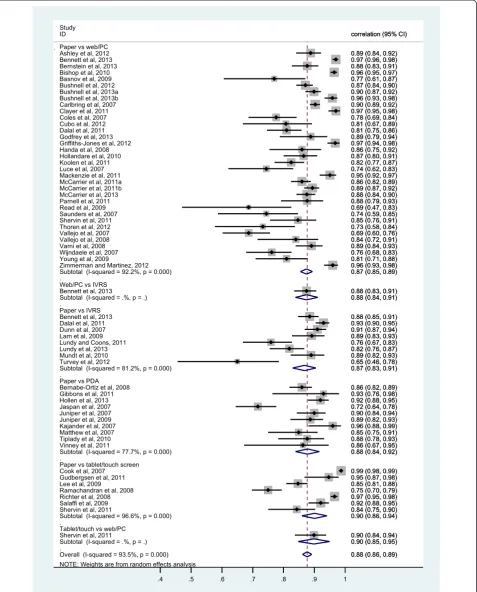
available data (one study providing values for two differ-ent platform comparisons [33] and two studies three dif-ferent comparisons [20, 72]; i.e., 61 platform-specific values in total) are shown in Fig. 2, grouped by platform comparison. There was a high degree of variability among the studies, with an I2 of 93.5. The random ef-fects pooled estimate was 0.884 (95 % CI 0.863 to 0.901). Similarly, average ICCs alone extracted from 39 studies (42 estimates) had an overall random effects pooled esti-mate of 0.900 (95 % CI 0.878 to 0.918) and an I2of 91.5.
Examination of the standardised residuals for each of the 61 (study and platform specific) estimates, with step-wise exclusion of studies with standardised residuals≥ |3.0| [full details available from the authors], led to 20 studies being excluded [20a, 23, 26, 27, 29, 30, 31, 33b, 38, 45, 54, 55, 57, 67, 68, 69, 77, 78, 83, 87] with the remaining 41 values having a moderate [15] I2value of 54.39, with a random effects pooled value of 0.874 (95 % CI 0.862 to 0.885) and fixed effects pooled value of 0.875 (95 % CI 0.867 to 0.882).
Analysis of moderator variables Mean differences
In terms of factors which might explain the observed heterogeneity, for the 307 individual standardised mean differences (data shown in Table 2), while there was no overall difference in the values from studies published in 2011–2013 and those published in 2007–2010, agree-ment was greater (i.e., pooled standardised mean differ-ences smaller) in the values from studies published in 2008–2010 and 2011, compared with those from studies published in 2007 and 2012–2013 (p< 0.001).
Values from studies comparing paper with tablet devices appeared to have the greatest level of agreement (p< 0.001).
In terms of study design, agreement was greater in the 256 values from randomised studies compared with the 51 values from non-randomised studies and in cross-over studies compared with within-patient and parallel group studies (p< 0.001). Studies with a longer interval between administrations and 56 or fewer participants had lower levels of agreement (p= 0.077). In terms of participant age, the 84 values from studies with a mean of <28 years had the lowest agreement, and the 40 values from studies with a mean of 28–46 years the greatest,
p< 0.001. There was no significant association with publication type (Table 2).
Using the 57 scale-standardised mean differences aver-aged across each study and platform, mean(SE) differ-ences were significantly lower (i.e., agreement greater) in the 25 studies published from 2011–2013 than in the 32 from 2007–2010 [0.0128(0.008) vs 0.019(0.013), respect-ively;p= 0.045]. There were no other statistically signifi-cant differences in terms of study design, platform, time
Fig. 2Forest plot of the 61 correlation coefficients averaged over each study and platform
interval, mean age of participants, study size, and publica-tion type, although the mean(SE) differences in the 3 values from non-randomised cross-over studies [0.023(0.030)] and the 7 from parallel group studies [0.0183(0.015)] were non-significantly larger than those from the 35 randomised cross-over studies [0.0155(0.010)] and the 12 within-patient studies [0.016(0.011)], p= 0.702. Similarly, the 20 studies with an interval between administrations of <1 day had smaller mean(SE) differences than the 37 with an interval of 1+ days [0.014(0.011) vs 0.017(0.012), respect-ively; p= 0.356]; and the 12 studies with a mean partici-pant age of <28 years had the largest mean(SE) difference, and the 12 with a mean age of 28–46 years the smallest [0.022(0.017) vs 0.012(0.007), re-spectively; p= 0.068].
Correlations
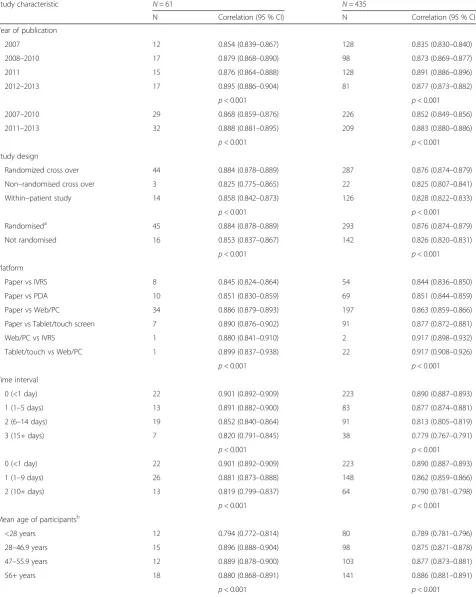
Using the 61 correlations averaged across each study and platform (data shown in Table 3), there was a differ-ence in pooled correlation estimates between studies grouped by publication year, with agreement in earlier years, particularly in 2007, being lower (fixed effectsp< 0.001). The design of the studies was also significantly associated with the degree of correlation, with the high-est agreement being observed in randomized studies and the lowest in non-randomised studies (p< 0.001). In terms of platform, 8 studies compared a paper with an IVRS measure, 34 a paper with a PC measure, 10 a paper with a PDA measure, and 7 a paper with a tablet/ touch screen measure. The paper vs IVRS comparisons had the lowest pooled agreement and the paper vs tablet the highest. In terms of the time period between admin-istrations, agreement decreased as the time interval increased (p< 0.001). The age of the participants also had a significant association with agreement, with the
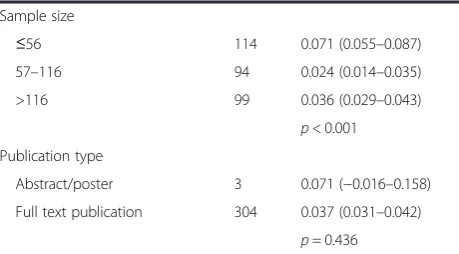
Table 2Pooled fixed effects (standardised mean differences) by year of publication, study design, platform, time interval between administrations, age, sample size and publication type for the 307 available standardised mean differences
Study characteristic N= 307
N Mean difference (95 % CI)
Year of publication
2007 98 0.051 (0.040–0.062)
2008–2010 76 0.022 (0.011–0.033)
2011 69 0.031 (0.020–0.041)
2012–2013 64 0.047 (0.035–0.058)
p< 0.001 2007–2010 174 0.036 (0.028–0.043)
2011–2013 133 0.038 (0.030–0.045)
p= 0.709 Study design
Randomized cross over 232 0.030 (0.023–0.036)
Non–randomised crossover 12 0.033 (−0.003–0.068)
Within–patient study 40 0.099 (0.077–0.122)
Parallel group study 23 0.046 (0.033–0.060)
p< 0.001 Randomiseda 256 0.034 (0.028–0.040)
Not randomised 51 0.065 (0.046–0.084)
p= 0.002 Platform
Paper vs IVRS 40 0.053 (0.038–0.069)
Paper vs PDA 60 0.106 (0.070–0.142)
Paper vs Web/PC 152 0.038 (0.031–0.045)
Paper vs Tablet/touch screen 51 0.020 (0.009–0.031)
Tablet/touch vs Web/PC 4 0.044 (−0.113–0.221)
p< 0.001 Time interval
0 (<1 day) 159 0.036 (0.028–0.044)
1 (1–5 days) 61 0.034 (0.024–0.044)
2 (6–14 days) 50 0.036 (0.022–0.051)
3 (15+ days) 37 0.051 (0.032–0.069)
p= 0.460 0 (<1 day) 159 0.036 (0.028–0.044)
1 (1–9 days) 85 0.033 (0.025–0.041)
2 (10+ days) 63 0.055 (0.038–0.072)
p= 0.077 Mean age of participantsb
<28 years 86 0.064 (0.051–0.077)
28–46.9 years 37 0.019 (0.009–0.029)
47–55.9 years 51 0.028 (0.017–0.039)
56+ years 125 0.049 (0.038–0.061)
p< 0.001
Table 2Pooled fixed effects (standardised mean differences) by year of publication, study design, platform, time interval between administrations, age, sample size and publication type for the 307 available standardised mean differences(Continued)
Sample size
≤56 114 0.071 (0.055–0.087)
57–116 94 0.024 (0.014–0.035)
>116 99 0.036 (0.029–0.043)
p< 0.001 Publication type
Abstract/poster 3 0.071 (−0.016–0.158)
Full text publication 304 0.037 (0.031–0.042)
p= 0.436
a
Patients in 1 within–patient study [20] were randomly assigned to complete 2 versions of 1 of 4 instruments
b
Four studies [7,23,48,71] did not provide information on the age of their participants
Table 3Pooled fixed effects (correlations) by year of publication, study design, platform, time interval between administrations, age, sample size and publication type for the 435 available correlations and 61 correlations averaged over each study/platform
Study characteristic N= 61 N= 435
N Correlation (95 % CI) N Correlation (95 % CI)
Year of publication
2007 12 0.854 (0.839–0.867) 128 0.835 (0.830–0.840)
2008–2010 17 0.879 (0.868–0.890) 98 0.873 (0.869–0.877)
2011 15 0.876 (0.864–0.888) 128 0.891 (0.886–0.896)
2012–2013 17 0.895 (0.886–0.904) 81 0.877 (0.873–0.882)
p< 0.001 p< 0.001
2007–2010 29 0.868 (0.859–0.876) 226 0.852 (0.849–0.856)
2011–2013 32 0.888 (0.881–0.895) 209 0.883 (0.880–0.886)
p< 0.001 p< 0.001
Study design
Randomized cross over 44 0.884 (0.878–0.889) 287 0.876 (0.874–0.879)
Non–randomised cross over 3 0.825 (0.775–0.865) 22 0.825 (0.807–0.841)
Within–patient study 14 0.858 (0.842–0.873) 126 0.828 (0.822–0.833)
p< 0.001 p< 0.001
Randomiseda 45 0.884 (0.878–0.889) 293 0.876 (0.874–0.879)
Not randomised 16 0.853 (0.837–0.867) 142 0.826 (0.820–0.831)
p< 0.001 p< 0.001
Platform
Paper vs IVRS 8 0.845 (0.824–0.864) 54 0.844 (0.836–0.850)
Paper vs PDA 10 0.851 (0.830–0.859) 69 0.851 (0.844–0.859)
Paper vs Web/PC 34 0.886 (0.879–0.893) 197 0.863 (0.859–0.866)
Paper vs Tablet/touch screen 7 0.890 (0.876–0.902) 91 0.877 (0.872–0.881)
Web/PC vs IVRS 1 0.880 (0.841–0.910) 2 0.917 (0.898–0.932)
Tablet/touch vs Web/PC 1 0.899 (0.837–0.938) 22 0.917 (0.908–0.926)
p< 0.001 p< 0.001
Time interval
0 (<1 day) 22 0.901 (0.892–0.909) 223 0.890 (0.887–0.893)
1 (1–5 days) 13 0.891 (0.882–0.900) 83 0.877 (0.874–0.881)
2 (6–14 days) 19 0.852 (0.840–0.864) 91 0.813 (0.805–0.819)
3 (15+ days) 7 0.820 (0.791–0.845) 38 0.779 (0.767–0.791)
p< 0.001 p< 0.001
0 (<1 day) 22 0.901 (0.892–0.909) 223 0.890 (0.887–0.893)
1 (1–9 days) 26 0.881 (0.873–0.888) 148 0.862 (0.859–0.866)
2 (10+ days) 13 0.819 (0.799–0.837) 64 0.790 (0.781–0.798)
p< 0.001 p< 0.001
Mean age of participantsb
<28 years 12 0.794 (0.772–0.814) 80 0.789 (0.781–0.796)
28–46.9 years 15 0.896 (0.888–0.904) 98 0.875 (0.871–0.878)
47–55.9 years 12 0.889 (0.878–0.900) 103 0.877 (0.873–0.881)
56+ years 18 0.880 (0.868–0.891) 141 0.886 (0.881–0.891)
p< 0.001 p< 0.001
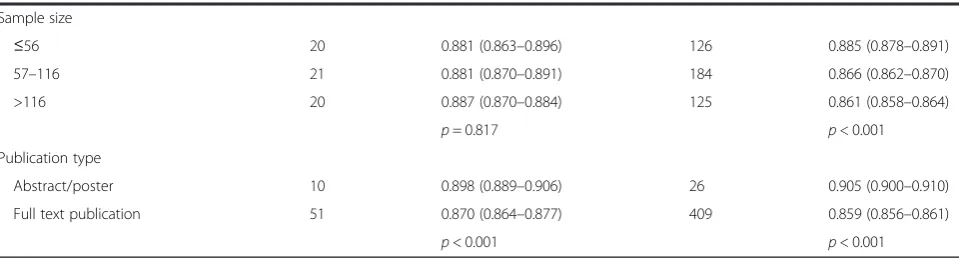
youngest participants (those aged <28 years on average) having the lowest agreement but other age groups gener-ally having comparable levels of agreement. While study size had no significant association with agreement, there was a significant association with publication type, with data extracted from 51 full-text publications having lower levels of agreement than data extracted from 10 abstracts/posters (p< 0.001). Relationships assessed using all available 435 correlations were similar, although the association with sample size, with smaller studies having greater agreement, was statistically significant (Table 3).
Assessment of publication bias
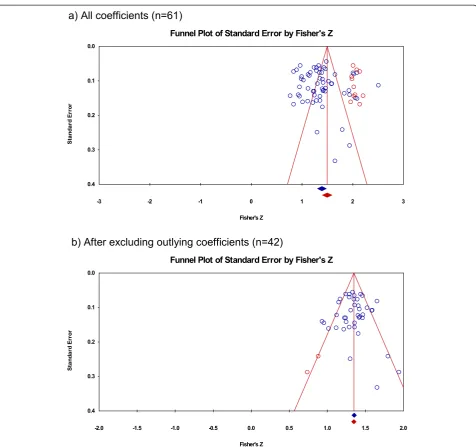
Among the total 61 averaged correlations, there was generally little evidence of publication bias (Egger’s re-gression intercept = 0.886, SE = 1.220,p= 0.235; Kendall’s Tau b = 0.070, p= 0.211), with no studies estimated as missing using Duval and Tweedie’s trim and fill test under a fixed effects model. Under a random effects model, however, 11 studies were identified as potentially missing to the right of the mean (i.e., studies with a greater degree of agreement; Fig. 3a), their inclusion raising the random effects pooled correlation to 0.904 (95 % CI 0.886 to 0.920). The results were similar after excluding the 10 studies in abstract/poster form: there was little evidence of publication bias among the 51 full text publications (Egger’s regression intercept = 1.006, SE = 1.375, p= 0.468; Kendall’s Tau b = 0.061, p= 0.521) but with 10 studies (the same number as those excluded) identified as potentially missing to the right of the mean, their inclusion raising the random effects pooled correl-ation to 0.899 (95 % CI 0.894 to 0.904).
After excluding the 20 outlying valuesthere was gener-ally little evidence of publication bias (Egger’s regression intercept = 0.061, SE = 0.626, p= 0.462; Kendall’s Tau b =−0.011, p= 0.460), with one study estimated as missing using Duval and Tweedie’s trim and fill test under a fixed effects model and two under a random
effects model, both to the left of the mean (i.e., studies with a lesser degree of agreement; Fig. 3b). After including these two studies, the random effects pooled correlation coefficient reduced slightly from 0.874 to 0.872 (95 % CI 0.860 to 0.884) and the fixed effects pooled correlation coefficient from 0.875 to 0.874 (95 % CI 0.866 to 0.881).
Using an average correlation of 0.65 for potentially missing studies, this being the lowest ICC extracted [77], Orwin’s fail-safe N test estimated that 123 missing studies additional to the 61 (79 for the 42 estimates after excluding the outliers) would be needed to bring the observed pooled estimate to <0.75.
Discussion
The results summarised here indicate that electronic and paper PROMs and different modes of electronic administration produce equivalent scores across a wide range of scenarios (medical conditions and platforms), suggesting that electronic measures can generally be assumed to be equivalent to pen and paper measures. In particular, given the generally high level of agreement across all studies included in this review, there is no evi-dence that equivalence is compromised by the nature of the condition under investigation, even when the informa-tion collected is of a sensitive nature, such as of sexual function [34], sexual health [21, 22], sexual behaviour [45], IBS [50] and IBD [52]. Further analyses exploring the role of measurement domain (e.g. physical or mental health) will be reported in another paper. Of particular note is the fact that, based on the ICCs and the numerically small mean score differences, pen-and-paper scores are equiva-lent to scores obtained from a variety of electronic platforms–IVRS, handheld, PC, and tablet. While equiva-lence between paper and IVRS measures appears to be slightly lower than with most other forms of electronic measure (pooled correlation coefficient 0.85 vs 0.89 for paper vs tablet; pooled standardised mean difference 0.053 vs 0.020), the data suggest that the likely true agreement Table 3Pooled fixed effects (correlations) by year of publication, study design, platform, time interval between administrations, age, sample size and publication type for the 435 available correlations and 61 correlations averaged over each study/platform
(Continued)
Sample size
≤56 20 0.881 (0.863–0.896) 126 0.885 (0.878–0.891)
57–116 21 0.881 (0.870–0.891) 184 0.866 (0.862–0.870)
>116 20 0.887 (0.870–0.884) 125 0.861 (0.858–0.864)
p= 0.817 p< 0.001
Publication type
Abstract/poster 10 0.898 (0.889–0.906) 26 0.905 (0.900–0.910)
Full text publication 51 0.870 (0.864–0.877) 409 0.859 (0.856–0.861)
p< 0.001 p< 0.001
a
Patients in 1 within–patient study [20] were randomly assigned to complete 2 versions of 1 of 4 instruments
b
Four studies [7,23,48,71] did not provide information on the age of their participants
(lower 95 % CI) between paper and IVRS measures is at least 0.82 and thus that there is at least good agreement between data obtained from IVRS and pen and paper measures. This is reassuring given that migration from paper to an IVRS is considered to be a moderate change because of the difference in cognitive processes involved in responding to an item aurally as opposed to visually. These results are also consistent with the results from a recent large study (N= 923 adult participants) of the ef-fects of method of administration (paper, PDA, PC, IVRS) on the measurement characteristics of items developed in the Patient-Reported Outcomes Measurement Informa-tion System (PROMIS) which strongly supported meas-urement equivalence across all platforms [88].
The observed mean differences in PROM scores between administration types were small. Taking all mean differences as positive differences, the fixed effects pooled standardized mean difference (mean difference standardised by the SD) of the 307 estimates was 0.037 (95 % CI 0.03 to 0.04). These estimates were also of low variability, with an I2of 33.5. In other words, the average mean difference in scores between electronic and paper measures was small at approximately 0.04 SDs. No com-parison with earlier data is possible as Gwaltney et al. [8] did not report on standardised mean differences. Stan-dardising the mean differences by the scale range (rather than the score SD), this difference was equivalent to a scale-standardised mean score difference of 1.8 % or, Fig. 3Assessment of publication bias among correlation coefficients averaged over study/platform under a random effects model
from the upper bound of the 95 % CI, a difference of at most 2 %. This is consistent with, or slightly smaller than, the 2 % mean scale-standardised difference reported by Gwaltney et al. [8]. Similarly, 93 % of all mean differences in this study were within 5 % of the scale score, exactly the same percentage as reported by Gwaltney et al. [8]. The values were similar when study and platform averaged scale-standardised estimates were used: the 57 values had a mean of 0.0163, with 95 % CI 0.013 to 0.019, and 97 % having a value within 5 % of the scale score.
In terms of ICCs and correlation coefficients, agreement was again high, with a pooled ICC over 42 study-specific estimates of 0.90 (95 % CI 0.88 to 0.92), and a pooled cor-relation coefficient (all measures of corcor-relation) over 61 study-specific estimates of 0.88 (95 % CI 0.86 to 0.90) and of 0.88 (95 % CI 0.0.87 to 0.88) over all 435 individual esti-mates. These values are consistent with the pooled sum-mary correlation of 0.90 (95 % CI 0.87 to 0.92) reported by Gwaltney et al. [8], an estimate which was the same irrespective of the specific measure of correlation. There is thus little evidence from both the present study and the earlier one [8] that the measure of correlation used has any influence on the degree of equivalence obtained. This is reassuring given the number of studies not employing the ICC in their assessment of equivalence. The ICC is the statistically correct measure of equivalence when agree-ment is assessed within (i.e., intra) measures sharing the same metric (i.e., mean and standard deviation); the Pearson correlation (an interclass correlation) is appropri-ate only when the measures are of a different class and not sharing the same metric [89]. It is also worth noting that not all studies identified in this review employing the ICC, stated which of the six possible ICCs, as described by Shrout and Fleiss in 1979 [90], was employed: whether the model was one-way or two-way, random or mixed, applying to single or average measures, or measuring consistency or absolute agreement. The value of the ICC obtained will depend on the specific model chosen. A full description of the nature of different ICCs is provided by McGraw and Wong, 1996 [89].
The correlation estimates were highly variable in both the current study and Gwaltney et al. [8], with the I2in the current study being >90 %. After excluding outliers, however, the pooled estimates were essentially unchanged. In terms of factors which might explain the observed het-erogeneity, agreement was greater in studies reported most recently (2011–2013 vs 2007–1010), in randomised as opposed to non-randomised studies, in studies with an interval between administrations of <1 day (and, overall, the greater the interval the lesser the agreement), and in studies of larger size. In addition, studies including very young children were associated with lower levels of agreement. While these associations were generally of
high statistical significance (p< 0.001), they were small in magnitude indicating that these factors have only small, albeit precise, effects; agreement is generally high even in those studies with the lowest agreement. Nevertheless, the patterns observed highlight the import-ance of appropriate study design when assessing equiva-lence: randomised studies and those with a shorter interval between administrations were associated with greater equivalence, this effect greatest in studies with an interval of fewer than 10 days between administrations. The lower levels of agreement observed in younger indi-viduals (<28 years) may to some extent reflect this effect: four [45, 54, 68, 78] of the five studies [30, 45, 54, 68, 78] conducted in younger individuals with the lowest level of agreement (ICC < 0.80) had intervals between administra-tions of one week or more.
The same was true of mean differences: average scale-standardised mean differences were lower (agreement higher) in more recent years (2011–2013) compared with earlier years (2007–2010), and randomised studies were associated with greater agreement than non-randomised studies, with the pooled standardised mean difference being 0.035 (95 % CI 0.030 to 0.041) vs 0.065 (95 % CI 0.046 to 0.084),p= 0.003. Other design features associated with agreement were the interval between administrations, with agreement being better (mean dif-ference lower and correlation higher) in studies with an interval of <1 day; and mean age of participants, with agreement being better in studies with participants of mean age between 28 and 55 years. Studies in either youn-ger (some studies having participants of mean age <13) or older participants tended to have lower levels of agree-ment, this consistent with lower levels of familiarity with EDC platforms in the older age group, and perhaps some unreliability in the responses in general from very young children. By definition, correlation coefficients cannot be obtained from parallel group studies; for the 7 estimates from parallel group studies the scale-standardised mean difference was 1.83 % compared with 1.55 % for the 35 estimates from randomised cross-over designs.
Gwaltney et al. [8] also found substantial heterogeneity in their extracted estimates of equivalence and were unable to explain the variability with analysis of the moderating factors (age and computer familiarity). Nevertheless, in this study only 9 of the studies in this analysis reported a correlation that was less than 0.80. Furthermore, this study found little evidence of publica-tion bias; no studies with correlapublica-tions less than the pooled mean were identified as missing. The identifica-tion of 11 possible missing studies with correlaidentifica-tions greater than the pooled mean may simply be a reflection of heterogeneity in the data. Finally, as many as 123 studies with a correlation of <0.75 would need to have been conducted and not published in order for the
overall effect to have been <0.75. This figure of 123 was greater than the 95 studies similarly estimated by Gwaltney et al. [8] suggesting that the more recent studies are more robust than those identified in the earlier review. There is thus no reason to believe that heterogeneity, and any possible publication bias, should temper the conclusions drawn from this meta-analysis.
In terms of study design, the general critical appraisal process of each study identified some issues which should be taken into account in future studies. For ex-ample, only a small proportion of studies (n= 18, 25 %) reported on the use of a power calculation when planning the study size and fewer than half used 95 % CIs (n= 29, 40 %) in result reporting. These is-sues relate to the importance of ensuring that the study is large enough to have sufficient power so that the estimated equivalence effect is estimated with suf-ficient precision so that possible lack of equivalence can be ruled out (i.e., by the 95 % CI excluding all values indicating measurement non-equivalence). Similarly, while it is encouraging to note that parallel studies assessing measurement equivalence are becoming less frequent (of the 7 parallel group studies, 4 (57 %) were reported in the two years from 2007 to 2008, see Table 1), and while the majority of studies identified (n= 51, 70.8 %) were randomised cross-over studies, in which participants completed both versions of the PROM in ran-domly allocated order, only 8 of these [20, 51, 54, 59–62, 72] undertook the equivalence assessment in the context of a full, or almost full, factorial assessment of instrument equivalence. Such full assessment requires the comparison of scores among four groups of respondent: those completing electronic first and then paper (E-P), those completing paper first and then electronic (P-E), those completing two paper versions (P-P), and those complet-ing two electronic versions (E-E). Such assessment, with appropriate statistical analysis (the formal statistical ana-lysis of these 8 studies generally did not, however, capital-ise on the study design) allows the expected variability in scores between measures completed on the same platform on two occasions (i.e., test-retest reliability) to be ‘ sub-tracted’, in the context of an analysis of variance, from the variability observed between measures completed on dif-ferent platforms. This reflects the fact that it is clearly nonsensical to require a greater degree of measurement equivalence between measures on different platforms than is required between one measure on the same platform in the context of the assessment of test-retest reliability: at best the same degree of equivalence should be required.
Such considerations also raise questions about the in-herent expectation of equivalence built into such studies. With the documented strengths of electronic modes of administration over paper [5] one might rightly antici-pate a quantitative difference in the data captured on
different modes of the same questionnaire due to the simple fact that there is better quality data being captured on the electronic system (e.g., fewer items of missing data, no out of range data). The current approach to equiva-lence studies seems to demand comparability between superior (electronic) and inferior (paper) modes of data capture which risks undermining the true advantages EDC bring to an actual clinical trial over the necessarily artificial setting of the equivalence study.
Conclusion
The present study strongly supports the conclusion of Gwaltney et al. [8] that PROM data obtained from elec-tronic platforms are comparable to that obtained from paper administration, as well as providing data on the equivalence of PROMs migrated to an IVRS platform, data not included in the earlier Gwaltney et al. study [8]. The high level of agreement seen in this review as well as in the Gwaltney et al review [8] should be reassuring to investigators, authorities and sponsors using elec-tronic devices to collect PROM data, having implications for the use of electronic measures generally and in clin-ical trials in particular.
Given the weight of the evidence for the equivalence between paper and electronic versions, we propose that equivalence studies should not be necessary to demon-strate the equivalence of validity of a measure that has been migrated to an electronic platform following best practices [7] with minor changes as defined in the ISPOR Taskforce report [7]. These results also suggest that a migration following best practices [7] to an IVRS may not need an equivalence study. Further research into migration principles and standards for IVRS may be needed to support our findings.
This conclusion stands even when estimates of pos-sible unpublished studies are included in our analysis, highlighting the robust nature of instruments migrated from paper onto electronic platforms. We further rec-ommend that common best practices are established among the vendor community (i.e. via the ePRO consor-tium) to standardize migration principles (i.e. number of items per screen, scrolling through answer options) as well as to define a standard framework for the conduct and publication of equivalence studies.
Competing interests
The authors declare that they have no competing interests.
Authors’contributions
WM developed the idea and design of the study; NQ and ND developed the search strategy, conducted the search and the data extraction. HD extracted data and conducted the meta-analysis. NQ, HD and DW drafted the manuscript; PD contributed to the introduction, search strategy and discussion. BF assisted with analysis and presentation of data. All authors read and approved the final manuscript.