http://www.sciencepublishinggroup.com/j/se doi: 10.11648/j.se.20170505.11
ISSN: 2376-8029 (Print); ISSN: 2376-8037 (Online)
Correction of Terminal Velocity Prediction Model for
CO
2
-Kerosene and Air-Kerosene Systems by Artificial
Intelligence
Sadra Mahmoudi, Bahram Hashemi Shahraki, Masoud Aghajani
*Department of Gas Engineering, Ahwaz Faculty of Petroleum, Petroleum University of Technology, Ahwaz, Iran
Email address:
[email protected] (M. Aghajani)
*Corresponding author
To cite this article:
Sadra Mahmoudi, Bahram Hashemi Shahraki, Masoud Aghajani. Correction of Terminal Velocity Prediction Model for CO2-Kerosene and
Air-Kerosene Systems by Artificial Intelligence. Software Engineering. Vol. 5, No. 5, 2017, pp. 65-71. doi: 10.11648/j.se.20170505.11 Received: November 28, 2017; Accepted: December 7, 2017; Published: January 2, 2018
Abstract:
In this study the essential factors of rising air and CO2 bubbles in distillated water and kerosene investigate withthe experimental and theoretical attitude. Many formulas developed by pervious investigators for bubble terminal velocity prediction in air-water system. By using PSO (particle swarm optimization) algorithm and plotting experimental data of terminal velocity against the size of gas bubbles, suitable was chosen. Results showed that Jamialahmadi model is more practical for air-water and CO2-water system. The main aim of this paper is to validate and correct Jamialahmadi model for
predicting of bubble’s terminal velocities in air-kerosene and CO2-kerosene systems. Jamialahmadi model requires a
modification to be utilized for air-kerosene and CO2-kerosene system. The developed PSO algorithm model is accurate for
prediction of experimental data with an average R2 value of 0.976.
Keywords: PSO Algorithm, Kerosene, Distillated Water, Carbon Dioxide, Bubble Column
1. Introduction
In chemical industries, contacting of liquid and gas phases is very essential and usual [1]. The phenomenon is useful in lots of industrial liquid-gas contactors such as bubble columns, absorbers and flotation tanks [2]. Ascending velocity of the bubbles controls the operation time. Hence, it is essential for reinforcing the overall performance of the equipment [3]. Rising velocity of the bubbles can be gained by considering the driving force for climbing and the opposing forces [4]. The form and terminal rising velocity of single bubbles change as the bubble size varies, based on the following regimes [4]: 1) Viscosity dominant region 2) Intermediate region in which surface tension, viscous and inertial effect on this regime must be considered. 3) Inertia dominant region. Among these three areas, the middle area is the most important regime calls for more attention because different forces affect the velocity of the bubble, while the effect of each one is still not well understood [4, 5]. In this study, the best model would be chosen by comparison of experimental data and mathematical models.
1.1. Approach of Terminal Velocity Calculation
Here, the approaches of terminal velocity calculation are presented:
Force balance: The basis of this approach is balancing between different forces such as drag, buoyancy and gravity forces. This approach is suitable for small bubbles, just in the area where the viscosity forces prevail. One of the oldest studies shows that for bubbles with small diameters, the Stokes rule can be obtained by calculating and combining the drag and buoyancy force[6].
= (1)
Dimensional analysis: Dimensionless groups are made up by combining variables that determine the motion of bubbles. After making up the dimensionless groups and propose a functional relation between them, adjustable constant fit with experimental data [7, 8].
motion in continuous liquid. One of the first and most innovative research in this field was done by Mendelson [9] that is as follow:
= . (2)
1.2. Rise Velocity Correlation
Several different formulas have been proposed for certain range of diameter. Jamialahmadi model which is one of the most important formula is presented here that is also used by other researchers [6, 10, 11].
=
! " !
(3)
Equation (3) have been suggested by Jamialahmadi for air bubble ascending in distillated water. Vt1 and Vt2 related to
the velocity of the bubble in the viscous and inertia regions. Jamialahmadi [12] offered Mendelson [9] and Hadamard [13] models to achieve Vt2 and Vt1. However, Mendelson and
Hadamard equations do not seem to be appropriate [4, 14]. For calculate Vt1 and Vt2, rodriguez[15] offered moore [16]
and lehrer [17] equations. The equation that proposed by moore [18] is as follow:
6$%&'( 1 * (.+., =-$ '(/∆1 (4)
By solving above equation, the ascending velocity is displayed as follows:
2!345+., 6 789+., :
* 2!345+.,
6 789+.,
. * 0.36833 = 0 (5)
Utilizing Taylor series, final and modified equation is as follows:
= >? @1 0.736676 789
+.,
2!345 B
.
(6)
>? =/-∆ 78 (7)
Equation (6) is suitable for viscose forces dominant region. Lehrer [17] equation proposed for large bubble in the inertia region as below:
-$'(/ 1&C = D$'( -$'(/∆1 '( (8)
By assume that the acceleration is identical throughout the movement; the result is as follow:
= /E78 78∆ . (9)
By combining the above equations, bubbles ascending speed can be calculated for intermediate region. It is worth noting, however, equations such as the Jamialahmadi equation are presented by other researchers, but the accuracy of this equation for various liquid and gas should be examined.
2. Experimental Setup and Materials
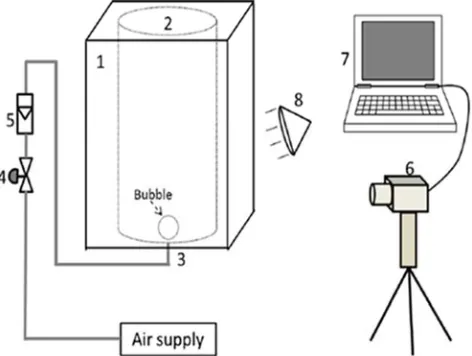
Experimental apparatus and their connections detail are shown in Figure 1. The tests were done in a large bath (1.5m height and 15 x 15 cm cross section) at the fixed temperature (300k) and pressure (1atm). At the bottom of the bubble column, bubbles were created by an orifice which its diameter was changeable. The orifice introduced CO2 and air
to the bulk of liquid. After bubble detachment from the orifice, the velocity and bubble path was completely recorded by camera. Table 1 gives useful information about the properties of experimental materials that have been used in this study.
Figure 1. Experimental equipment diagram. 1-square column; 2-cylindrical vessel; 3- nozzle; 4- valve and flow meter; 5-rotameter; 6-high speed camera; 7-computer; 8-Spotlight.
Table 1. Material property.
Substance Property
Water 1F= 995.7I
J/, %F= 0.719 LM
Kerosene 1F= 780I
J/, %F= 1.4 LM
CO2 1 = 1.97I
J/,DOPQR *LS2= 0.04 UJ,DIR VWRXR*LS2= 0.0162 UJ
Air 1 = 1.29Y
Z:,DOPQR *P[ = 0.0712UJ
,
DY( ? (\( ]^ = 0.0209_ Z
3. Results and Discussion
3.1. Air-Water System
diameter. In Figure 2, it is seen that the trend of terminal velocity variations and the experimental data reported by others for air-distillated water system are consistent with our works that confirm the validity of our results. This work only covers experimental data in the vicinity of intermediate
region because a general equation for intermediate regime (zone 2) is required. Because of larger error of other equation for viscose region, equation (3) would be considered as the more reliable equation in the wide range of diameter.
Figure 2. Experimental data and theoretical data comparison for air bubble rising through distillated water.
3.2. Carbon Dioxide–Water System
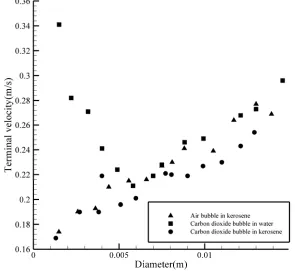
In this section, information on the rise of carbon dioxide bubbles in water is presented. As Figure 3 shows, the behavior of carbon dioxide bubbles is very similar to air bubbles, which is due to the close densities of these two gases. For this system two different zones are visible. For 1.5 to 6 mm interval, as the size of bubbles becomes greater than 1.5 mm, their terminal velocity decrease with their sizes. In this zone, the bubble oscillates and raise upward in a zig-zag path. In the next zone, the shape of bubble is not further spherical. It is like a doughnut. Terminal velocity from experimental data and equation (3) for both zones are in acceptable accordance that shows equation (3) can predict terminal velocity for CO2-water system too.
3.3. Air-Kerosene System
As it is expected, due to higher kerosene viscosity, kerosene create greater resistance to the motion of bubbles. Terminal velocity of same bubbles in kerosene is less than their speed in water. In Figure 3, laboratory data related to the movement of air bubbles in the kerosene bed has been presented. As it is evident in this figure, in 1mm to 15mm interval, terminal velocity of air bubble continuously increases by increasing in bubble size. For this interval, the bubbles move through a direct path rather than zig-zag route.
Experimental data and prediction value obtained by equation (3) is not in acceptable accordance, hence, a modification would be accomplished for this system.
3.4. Carbon Dioxide-Kerosene System
In Figure 3, laboratory data related to the movement of CO2 bubbles in the kerosene bed has been presented.
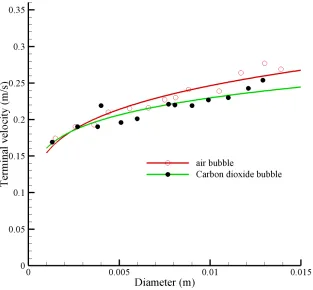
Obviously, the way that carbon dioxide bubble moves in kerosene is quite similar to the motion of air bubbles in kerosene. In Figure 4, the comparison of air and CO2 bubble
behaviors in kerosene is shown. According to experimental data, the only difference between the behavior of carbon dioxide and air bubbles is in their speed value. By comparison of experimental data and prediction data from equation (3), it is clearly evident that Equation (3) can predict terminal velocity, additionally, it needs a modification in order to improving the accuracy of prediction. Figure 5 compares the behavior of air bubbles in water and kerosene. The different behavior of the air bubble in these two environments is quite evident. Therefore, it can be noted that bubble movement inside the liquid depends on the type of liquid rather than the gas type. The gas content only affects the amount of speed, but the fluid species affects both the speed and type of movement.
Figure 5. Air bubble ascending through various liquid.
4. Equation Modification by PSO
Algorithm
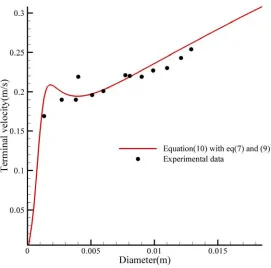
Equation (3) has a suitable accordance with experimental data for gas-water system. Hence, to archiving acceptable accuracy for gas-kerosene system, equation (3) should be corrected by PSO algorithm. Due to the similar behavior of air and carbon dioxide in kerosene, the same correction should be accomplished for gas bubble rising through kerosene.
( Z^\]&= .
-` " a+., bc
(10)
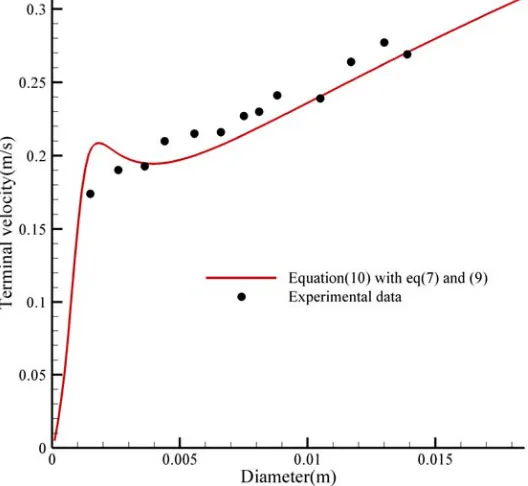
Regarding to Figure 6 and 7, it is clear that the modified equations can predict terminal velocity for mentioned systems with more accuracy than equation (3). Two statistical parameters, were also taken into consideration to further validate the predictions of developed model. This model exhibits relatively 0.976 R2 average value for system and 0.0127 average value of RMSE.
Figure 2. Experimental and theoretical data comparison for CO2-kerosene system.
5. Conclusions
Jamialahmadi model is suitable for terminal velocity prediction in gas-water systems but for gas-kerosene systems, it needs a modification to being more appropriate. As experimental data show, the overall behavior of a gas bubble inside a continuous liquid environment is more liquid-dependent than gaseous. By a fixed size Orifice, the bubbles produced in a liquid with a lower surface tension are smaller. The behavior of two types of gas bubbles in the water is quite similar, and their only difference is in their amount. The behavior of a gas in different liquid is quite different, both in terms of value of velocity and Reverse area (the area that terminal velocity decrease by increasing of diameter) length. In liquids with less viscosity, the length of the reverse area is greater and occurs in higher quantities of bubble size. In fact, it turns out that the length of the inverted area is determined by the liquid viscosity, which decreases the length of the area by increasing the viscosity of the liquid. According to the figures that compare the data for each gases in both liquids, in vicinity of 6mm for air and 7mm for CO2 bubble diameter,
the impact of liquid type lose it influence and the behavior of the bubbles are independent of the type of liquid.
References
[1] Hayashi, K., Kurimoto, R. and Tomiyama, A., 2011. "Terminal velocity of a Taylor drop in a vertical pipe". International Journal of Multiphase Flow, 37 (3), pp. 241-251.
[2] Kurimoto, R., Hayashi, K. and Tomiyama, A., 2013. "Terminal velocities of clean and fully-contaminated drops in vertical pipes". International Journal of Multiphase Flow, 49,
pp. 8-23.
[3] Kulkarni, A., 2005. "Effect of sparger design on the local flow field in a bubble column: Analysis using LDA". Chemical Engineering Research and Design, 83 (1), pp. 59-66.
[4] Tomiyama, A., Celata, G., Hosokawa, S. and Yoshida, S., 2002. "Terminal velocity of single bubbles in surface tension force dominant regime". International Journal of Multiphase Flow, 28 (9), pp. 1497-1519.
[5] Celata, G. P., D’Annibale, F., Di Marco, P., Memoli, G. and Tomiyama, A., 2007. "Measurements of rising velocity of a small bubble in a stagnant fluid in one-and two-component systems". Experimental Thermal and Fluid Science, 31 (6), pp. 609-623.
[6] Kulkarni, A. A. and Joshi, J. B., 2005. "Bubble formation and bubble rise velocity in gas− liquid systems: a review".
Industrial & Engineering Chemistry Research, 44 (16), pp. 5873-5931.
[7] Abou-El-Hassan, M., 1983. "A generalized bubble rise velocity correlation". Chemical Engineering Communications, 22 (3-4), pp. 243-250.
[8] Rodrigue, D., 2004. "A general correlation for the rise velocity of single gas bubbles". The Canadian Journal of Chemical Engineering, 82 (2), pp. 382-386.
[9] Mendelson, H. D., 1967. "The prediction of bubble terminal velocities from wave theory". AIChE Journal, 13 (2), pp. 250-253.
[10] Duangsuwan, W., Tuzun, U. and Sermon, P., 2011. "The dynamics of single air bubbles and alcohol drops in sunflower oil at various temperatures". AIChE journal, 57 (4), pp. 897-910.
[12] Jamialahmadi, M., Branch, C. and Müller-Steinhagen, H., 1994. "Terminal bubble rise velocity in liquids". Chemical engineering research & design, 72 (1), pp. 119-122.
[13] Hadamard, J. S., 1911. "Movement permanent lent d’une sph`ere liquide et visqueuse dans un liquide visqueux.".
Comptes Rendus Hebdomadaires des Seances de V Academie des Sciences (Paris).
[14] Bozzano, G. and Dente, M., 2001. "Shape and terminal velocity of single bubble motion: a novel approach".
Computers & chemical engineering, 25 (4), pp. 571-576. [15] Baz-Rodriguez, S., Aguilar-Corona, A. and Soria, A., 2012.
"Rising velocity for single bubbles in pure liquids". Revista mexicana de ingeniería química, 11 (2).
[16] Moore, D., 1965. "The velocity of rise of distorted gas bubbles in a liquid of small viscosity". Journal of Fluid Mechanics, 23 (4), pp. 749-766.
[17] Lehrer, I. H., 1976. "A rational terminal velocity equation for bubbles and drops at intermediate and high Reynolds numbers". Journal of Chemical Engineering of Japan, 9 (3), pp. 237-240.