Machine learning–XGBoost analysis of language networks
to classify patients with epilepsy
L. Torlay.M. Perrone-Bertolotti .E. Thomas. M. Baciu
Received: 21 February 2017 / Accepted: 13 April 2017 / Published online: 22 April 2017 The Author(s) 2017. This article is an open access publication
Abstract Our goal was to apply a statistical approach to allow the identification of atypical language patterns and to differentiate patients with epilepsy from healthy subjects, based on their cerebral activity, as assessed by functional MRI (fMRI). Patients with focal epilepsy show reorgani-zation or plasticity of brain networks involved in cognitive functions, inducing ‘atypical’ (compared to ‘typical’ in healthy people) brain profiles. Moreover, some of these patients suffer from drug-resistant epilepsy, and they undergo surgery to stop seizures. The neurosurgeon should only remove the zone generating seizures and must pre-serve cognitive functions to avoid deficits. To prepre-serve functions, one should know how they are represented in the patient’s brain, which is in general different from that of healthy subjects. For this purpose, in the pre-surgical stage, robust and efficient methods are required to identify atyp-ical from typatyp-ical representations. Given the frequent loca-tion of regions generating seizures in the vicinity of language networks, one important function to be consid-ered is language. The risk of language impairment after
surgery is determined pre-surgically by mapping language networks. In clinical settings, cognitive mapping is classi-cally performed with fMRI. The fMRI analyses allowing the identification of atypical patterns of language networks in patients are not sufficiently robust and require additional statistic approaches. In this study, we report the use of a statistical nonlinear machine learning classification, the Extreme Gradient Boosting (XGBoost) algorithm, to identify atypical patterns and classify 55 participants as healthy subjects or patients with epilepsy. XGBoost anal-yses were based on neurophysiological features in five language regions (three frontal and two temporal) in both hemispheres and activated with fMRI for a phonological (PHONO) and a semantic (SEM) language task. These features were combined into 135 cognitively plausible subsets and further submitted to selection and binary classification. Classification performance was scored with the Area Under the receiver operating characteristic curve (AUC). Our results showed that the subset SEM_LH BA_47-21 (left fronto-temporal activation induced by the SEM task) provided the best discrimination between the two groups (AUC of 91±5%). The results are discussed in the framework of the current debates of language reor-ganization in focal epilepsy.
Keywords LanguageEpilepsyAtypicalMachine learningML Extreme Gradient BoostingXGBoost
1 Introduction
Focal epilepsy is characterized by symptoms induced by lesion or dysfunction of a specific cerebral region, the ‘epileptic zone’ (EZ) [1]. Given the location of the EZ
Electronic supplementary material The online version of this article (doi:10.1007/s40708-017-0065-7) contains supplementary material, which is available to authorized users.
L. TorlayM. Perrone-BertolottiM. Baciu CNRS LPNC UMR 5105, Univ. Grenoble Alpes, 380000 Grenoble, France
E. Thomas
Laboratoire INSERM U1093, Universite´ de Bourgogne, 21000 Dijon, France
M. Baciu (&)
LPNC, UMR CNRS 5105, BSHM, Universite´ Pierre Mende`s-France, BP 47, 38040 Grenoble Cedex 09, France e-mail: [email protected]
within or in the vicinity of language networks, patients are more or less impaired for language abilities but they clearly show reorganization of language networks based on func-tional plasticity [2,3]. Compared to typical left hemisphere representation of language observed in the majority of healthy subjects [4], patients with epilepsy show a higher frequency of atypical language representation, with both inter- and intra-hemispheric reorganization (see [3] for a review). In addition, an important percentage of patients with epilepsy become resistant to anti-epileptic medication and surgery is undertaken to remove the EZ and stop sei-zures [5,6]. In the pre-surgical phase, language mapping is required to identify language regions that must be pre-served during surgery to avoid cognitive deficit. Mapping provides information in terms of language specialization, either at a hemispheric or at a regional level, as both levels provide specific patterns of reorganization. The global hemispheric specialization for language (and other cogni-tive functions) is clinically assessed with the Wada test [7,8], while language networks are generally defined at an inter- and intra-hemispheric level with noninvasive meth-ods such as functional MRI. Functional MRI maps lan-guage in patients with epilepsy by using a large variety of tasks and protocols [9–17] even if there is no clear con-sensus on the most appropriate task or panel of tasks to be used. In clinical practice, phonological and lexico-semantic tasks are generally used to maximize the amount of rele-vant information for language network activity. The iden-tification of language patterns, mostly atypical in patients, requires precision (in terms of language tasks and analysis of data) to correctly describe the reorganized networks and to avoid deficits after surgery.
In terms of data analysis, we generally determine (qualitatively/inspection or quantitatively/statistically) for a given task and a given patient, the language network and its functional hemispheric or regional lateralization [17]. This individual analysis has inherent limits linked to the high intra- and inter-patient variability of activation, giving rise to poor statistical power and subjective interpretation [18,19]. These limits are particularly important in the case of patients who need surgery and show a high risk of postsurgical sequels if the region responsible for seizures is located in the vicinity of reorganized language networks, which are not correctly identified before surgery. In sum, there is a strong need to develop robust statistical and objective approaches to identify language networks in patients with epilepsy. Functional MRI is a very helpful tool to highlight activated regions but the information on this activation is not sufficient [20]. Specifically, this activation needs to be further processed and included into more robust statistical analyses, to obtain robust results allowing for a clearer distinction between patients with reorganized cognitive networks and healthy subjects with
typical representations of cognitive functions. Due to the lack of statistical power when trying to validate differences between single-patient fMRI measures and a group of heathy subjects, robust statistical methods should be involved.
The main objective of this study is to evaluate an objective method to distinguish patients and healthy peo-ple, based on language networks mapped with fMRI, and by using a machine learning (ML) approach. Previous results from a range of cognitive studies [21–24] showed successful use of ML classification. In patients with epi-lepsy, an ML approach based on a probabilistic regression method was used on fMRI data to evaluate the hemispheric specialization for language before surgery [18]. The authors showed successful classification (96%) with dis-sociation between typical (i.e., left hemisphere predomi-nance) and atypical patterns of lateralization. Moreover, patients with atypical patterns (i.e., right hemisphere dominant or bilateral representation) were successfully identified (82%). An important advantage of the ML approach is that predetermined parameters (a priori threshold value settings as classically used in fMRI anal-ysis) are not necessary, removing the subjective dimension of analyses and interpretations. Other authors have used ML on data concerning the integrity of white matter fibers to predict the surgical outcome in patients with epilepsy [25]. This approach was able to distinguish patients with epilepsy from normal controls with 80% accuracy, and predict the surgical outcome for patients, with 70% accu-racy. ML classification requires input features or dimen-sions. In fMRI, these features are represented by the amount of the blood oxygen level-dependent (BOLD) signals in regions of interest or by lateralization indices, as used by [18]. The latter are calculated with BOLD signal values measured in homologues (right and left hemisphere) regions of interest. fMRI activity and BOLD signals strongly depend on psycholinguistic features such as lan-guage operation (phonology and semantic) and tasks used during fMRI assessment. Ideally, a fine-grained represen-tation of language networks in patients implies the use of a panel of language tasks. This is difficult to apply in clinical practice due to practical reasons (short duration of the fMRI protocol, tasks should be easy to perform by patients). Consequently, a compromise has to be found between the amount of information in terms of language networks and pragmatic criteria inherent to work with patients. In this framework, it is accepted that the essential information concerning language networks in patients with epilepsy is obtained by using a phonological and semantic task (see, for instance, [3] and [15]).
In this current study, we applied a ML classifier, the
healthy subjects. This particular method was chosen due to its significant advantages: (a) dealing with missing values, (b) requiring data scaling, (c) implying a computationally efficient variant of gradient boosting algorithm [27], (d) providing satisfactory results in ML competitions [28] and was successfully used in other studies and domains (see [29, 30]). Using XGBoost, we expected to identify robust patterns of language representation which are able to distinguish patients and healthy people. To our knowledge, there are no studies using XGBoost to objectively classify two populations based on their neurophysiological features. Specifically, we examined 55 participants who underwent fMRI and performed two language tasks—a semantic and phonological one, which activate classical language regions [15, 16, 31–33]. Based on the activation, we defined 20 features, as follows: five fronto-temporal (FT) regions (BA, Brodmann Area; BA21, BA 22, BA 44, BA 45 and BA 47), delineated in each (left, LH; right, RH) or both (bilateral; LH-RH) hemispheres, and for each lan-guage task (SEM, PHONO). We expect that differences between healthy subjects and patients with epilepsy would reveal atypical patterns of language representation in the damaged brains of patients. The atypical patterns might also reflect ‘sensitive-to-surgery’ regions that must be preserved during surgery to avoid language deficits.
2 Material and methods
2.1 Participants
We examined 55 participants: 16 patients with focal epi-lepsy and 39 healthy controls. Patients showed various anatomical locations of the EZ, and as indicated in Table1, they were right- and left-handed. All were native French speakers and had normal or corrected-to-normal vision. Healthy volunteers had no history of neurological or psy-chiatric disorders. Participants gave informed written consent, and the study was approved by the local ethics committee (CPP no 09-CHUG-14, 04/06/2009).
2.2 Stimuli and tasks
The experimental protocol used during fMRI examination is described in detail in [15]. Two language tasks were used in two separate runs, a phonological (PHONO) and a semantic (SEM) task, each one also including a control visual condition (without language demands). Each task comprised ‘language’ and ‘control’ conditions. The PHONO language condition was performed with pseudo-words. Participants were instructed to detect a target pho-neme (phopho-neme detection task). The SEM language con-dition of SEM run was performed using words with participants being instructed to judge whether items des-ignated living or non-living entities (categorization task). The control condition was identical for the two runs and was performed using unreadable words (font Karalyn Patterson) with participants being instructed to judge the height of characters (visual detection task). Stimuli gen-erated by the E-Prime software (E-prime Psychology Software Tools Inc., Pittsburgh, USA) were written in white ‘Courier New’ font size 40, centered on the middle of a black screen and lasted 2.5 s each.
2.3 Functional MRI paradigm
A pseudo-randomized event-related fMRI paradigm was optimized [34] for 60 events, and 35 additional null events were used for each run (PHONO and SEM runs). The null events were added in order to provide an appropriate baseline measure [1] and consisted of a white fixation cross-displayed in the center of the black screen. The inter-stimulus interval was 2.5 s. The run duration was 8 min 40 s.
2.4 MR acquisition
The experiment was performed in a whole-body 3T MR scanner (Bruker MedSpec S300) with 40 mT/m gradient strength at MR facility. For functional runs, the manufac-turer-provided gradient-echo/T2*-weighted EPI method was used. Thirty-nine adjacent axial slices parallel to the bi-commissural plane were acquired in an interleaved mode. Slice thickness was 3.5 mm. During each run, the cerebral volume was measured 150 times. The in-plane voxel size was 3 93 mm (216 9216 mm field of view acquired with a 72972 pixel data matrix, reconstructed with zero filling to 1289128 pixels). The main sequence parameters were: TR=2.5 s, TE=40 ms, flip angle=77. To correct images for geometric distortions induced by local B0 inhomogeneity, a B0 field map was obtained from two gradient-echo datasets acquired with a standard 3D FLASH sequence (DTE=9.1 ms). The field map was used during data processing. A T1-weighted
high-Table 1 Demographic information of participants, patients (TLE, patient with epilepsy with left temporal lobe epilepsy) and healthy volunteers (controls)
N Age mean (SD) Gender Handedness
TLE 16 35.3±11.1 9M–7F 1L–15R
resolution three-dimensional anatomical volume was also acquired, by using a 3D-modified driven equilibrium Fourier transform (MDEFT) sequence (field of view: 25692249176 mm; resolution: 1.33391.7509 1.375 mm; acquisition matrix: 1929128 9128 pixels; reconstruction matrix: 25691289128 pixels).
2.5 Spatial preprocessing of fMRI data
Data analysis was performed by using the general linear model, GLM [35] for event-related designs with SPM12 (Wellcome Department of Imaging Neuroscience, London, UK,www.fil.ion.ucl.ac.uk/spm) implemented in MATLAB (MathWorks Inc., Natick, MA, USA). Images were spa-tially preprocessed. First, the functional volumes were time-corrected with the 19th slice as reference (the acquired brain volume was composed of 39 slices) to correct artifacts caused by the delay of time acquisition between slices. Subsequently, all volumes were realigned to correct for head motion, by using a rigid body trans-formation. T1-weighted anatomical volume was co-regis-tered to mean images created by the realignment procedure and was normalized within the MNI space. Anatomical normalization parameters were used for the normalization of functional volumes. Each functional volume was smoothed by a Gaussian kernel of 8 mm FWHM (Full Width at Half Maximum). Finally, time series for each voxel were high-pass filtered (1/128 Hz cutoff) to remove low-frequency noise and signal drift.
2.6 Statistical analyses of fMRI data
Statistical analyses were subsequently performed on the preprocessed data. For each participant, each task (PHONO and SEM) was declared as a specific fMRI run. Thus, for each run PHONO or SEM, we included two regressors, PHONO (task) and Control-PHONO, and SEM (task) and Control-SEM, respectively. Each of them was convolved with a canonical hemodynamic response function (HRF). Movement parameters derived from the realignment cor-rections (three translations and three rotations) were included into the design matrix as additional factors of no interest. The GLM was then used to generate the parameter estimates of activity for each voxel, each condition and each participant. Statistical parametric maps were gener-ated from the linear contrasts between the HRF parameter estimates for the four experimental conditions (i.e., task and control for each run). The spatial resolution of statis-tical parametric maps was the same as the spatial resolution of functional MR images (39393.5 mm). The statisti-cal analysis was performed at a first level (Individual level) by calculating the main contrasts that were PHONO (task)
versus PHONO and SEM (task) versus Control-SEM. These contrasts allowed us to identify language networks for phonology and semantic processes.
2.7 ROI construction and extraction of the % MR signal (BOLD)
In accordance with our previously reported results from group analyses and based on previous literature on PHONO and SEM processing [2–4], we determined ten symmetrical frontal and temporal regions of interest (ROI), five in the left (LH) and five in the right hemisphere (RH). ROIs were defined based on the WFU PickAtlas toolbox (https://www. nitrc.org/projects/wfu_pickatlas/) from the Brodmann Area (BA) labeling. ROIs taken into account were, bilaterally, the inferior frontal gyrus pars opercularis, BA 44, pars triangularis, BA 45 and pars orbitalis, BA 47; middle temporal, BA 21 and superior temporal BA 22 gyri. For each ROI, each participant and each task (PHONO and SEM), the % of MR signal intensity variation (average of all voxels within a specific ROI) was measured. We defined 20 features for use in the ML classification approach (cf. 2.8)—the % of BOLD variation within the considered ROIs for PHONO (five ROI in the LH and five ROI in the RH) and for SEM (five ROI in the LH and five ROI in the RH).
2.8 Machine learning
in terms of the value of an input feature. The last node is a leaf and gives us the specific value of the output variable. Tree learning algorithms do not require linear features or linear interactions between features. They are significantly better classifiers than other algorithms (see [38]). More-over, XGBoost, a type of gradient boosting, has two major improvements: (a) speeding up the tree construction and (b) proposing a new distributed algorithm for tree search-ing. All participants (samples) were described by the set of 20 features mentioned above. We combined these features into specific cognitively plausible subsets in order to reduce the number of combinations in the feature selection step (cf.2.8.1). The entire procedure used in this study is presented in detail in Supplementary Material. We had eight missing among 1100 values (0.7%) from eight heal-thy participants for two features, BA 44 RH_SEM and the BA 44 RH_PHONO. We did not perform imputation or scaling on the data.
2.8.1 Feature selection method
The goal of feature selection was to choose a subsetXSof
Xthat can predictYwith the best performance at minimal computational cost. Another objective was to gain insight into the underlying processes which generated the data.
There are three main categories of feature selection algorithms: filter, wrapper and embedded. In the present study, we have focused on the filter and wrapper methods. Filter methods are computed fast and provide a feature ranking in order to remove irrelevant features. Although some of them are multivariate, such as correlation-based feature selection (CFS), they do not involve a learning algorithm and can miss useful features. Wrapper approaches use a given classification algorithm for the evaluation of a specific subset of features by training and testing it with cross-validation. The space of all feature subsets is generated by the strategy defined above. An exhaustive search with these features involves around one million combinations
220
ð Þ. After evaluation, some filter methods (low variance, Fisher score, CFS, Laplacian score, spectral score) and the forward (SFS) and backward selection (SBS) wrapper methods were considered unsuccessful (i.e., with no feature subset stability and with no significance of the performance metrics). Filter methods were tested with scikit-feature Python libraries implementation [39]. SFS and SBS wrapper methods were performed with Mlxtend Python libraries [40]. Thus, we decided to perform another wrapper method, a reduced exhaustive search among a selection of 135 feature subsets. We did not perform an exhaustive search with the 220 combinations of features, which would have been too long to compute and would have been prone to overfitting. These 135 different combinations of features were chosen
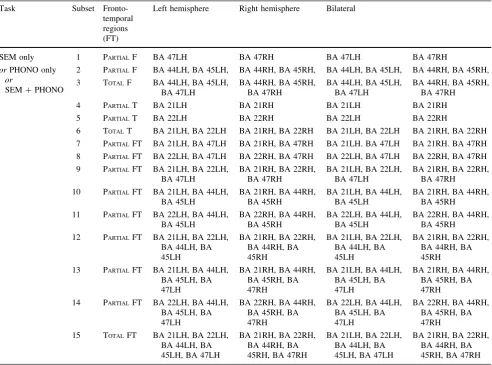
and grouped in nine ‘thematic sets’ (see Table2) based on ROI, hemisphere, and task. They are specified as follows: (a) three for SEM including a left hemisphere thematic set (with 15 subsets), a right hemisphere thematic set (in-cluding 15 subsets) and a bilateral thematic set (in(in-cluding 15 subsets); (b) three for PHONO including a left hemi-sphere thematic set (with 15 subsets), a right hemihemi-sphere thematic set (including 15 subsets) and a bilateral thematic set (including 15 subsets), and (c) three for SEM ? -PHONO including a left hemisphere thematic set (with 15 subsets), a right hemisphere thematic set (including 15 subsets) and a bilateral thematic set (including 15 subsets). These 135 feature subsets were combinations of the ROIs reflecting plausible patterns of language organization and reorganization based on literature results [3,41,42]. They varied according to ROIs (only frontal, only temporal or both), hemisphere (only left, only right or both hemi-spheres) and task (PHONO only, SEM only or PHONO?SEM).
2.8.2 Classification method
TheExtreme Gradient Boosting (XGBoost) algorithm [43] was used for classification. It was implemented using the scikit-learn [40] Python libraries for all ML processes. Parameters for the algorithm were fixed (cf. Table3) and not optimized by a grid search for the whole ML process (see [44]). Four parameters out of fifteen were set to par-ticular values. The learning rate was typically set to 0.01 (default 0.3) as small values lead to much better general-ization [45]. The number of boosted trees usually between some hundreds and thousands was set to 1200 (estimators). To prevent overfitting, the subsample was set to 0.7 (de-fault 1). This added randomness and made the training robust to noise. The maximum depth of a tree was set to 3 (default 6) to reduce the model complexity.
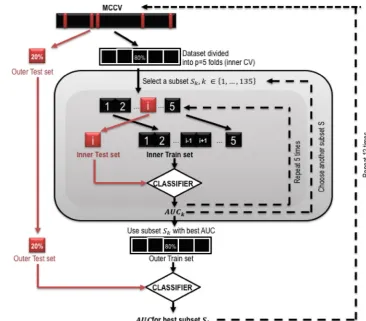
2.8.3 Validation strategy
appears in either the learning set or test set. Then fivefold cross-validation (CV) [49] was used only on the training set. It was split into five data blocks, four used for an inner training and the remaining one for the inner test. This was
repeated five times by permuting the data blocks. The feature selection was done in this inner CV. Finally, the model was fitted on the training set with the feature subset that had the best performance and the prediction evaluated
Table 2 A total of 135 subsets were evaluated
Task Subset
Fronto-temporal regions (FT)
Left hemisphere Right hemisphere Bilateral
SEM only
orPHONO only
or
SEM?PHONO
1 PARTIALF BA 47LH BA 47RH BA 47LH BA 47RH
2 PARTIALF BA 44LH, BA 45LH, BA 44RH, BA 45RH, BA 44LH, BA 45LH, BA 44RH, BA 45RH, 3 TOTALF BA 44LH, BA 45LH,
BA 47LH
BA 44RH, BA 45RH, BA 47RH
BA 44LH, BA 45LH, BA 47LH
BA 44RH, BA 45RH, BA 47RH
4 PARTIALT BA 21LH BA 21RH BA 21LH BA 21RH
5 PARTIALT BA 22LH BA 22RH BA 22LH BA 22RH
6 TOTALT BA 21LH, BA 22LH BA 21RH, BA 22RH BA 21LH, BA 22LH BA 21RH, BA 22RH 7 PARTIALFT BA 21LH, BA 47LH BA 21RH, BA 47RH BA 21LH. BA 47LH BA 21RH. BA 47RH 8 PARTIALFT BA 22LH, BA 47LH BA 22RH, BA 47RH BA 22LH, BA 47LH BA 22RH, BA 47RH 9 PARTIALFT BA 21LH, BA 22LH,
BA 47LH
BA 21RH, BA 22RH, BA 47RH
BA 21LH, BA 22LH, BA 47LH
BA 21RH, BA 22RH, BA 47RH
10 PARTIALFT BA 21LH, BA 44LH, BA 45LH
BA 21RH, BA 44RH, BA 45RH
BA 21LH, BA 44LH, BA 45LH
BA 21RH, BA 44RH, BA 45RH
11 PARTIALFT BA 22LH, BA 44LH, BA 45LH
BA 22RH, BA 44RH, BA 45RH
BA 22LH, BA 44LH, BA 45LH
BA 22RH, BA 44RH, BA 45RH
12 PARTIALFT BA 21LH, BA 22LH, BA 44LH, BA 45LH
BA 21RH, BA 22RH, BA 44RH, BA 45RH
BA 21LH, BA 22LH, BA 44LH, BA 45LH
BA 21RH, BA 22RH, BA 44RH, BA 45RH 13 PARTIALFT BA 21LH, BA 44LH,
BA 45LH, BA 47LH
BA 21RH, BA 44RH, BA 45RH, BA 47RH
BA 21LH, BA 44LH, BA 45LH, BA 47LH
BA 21RH, BA 44RH, BA 45RH, BA 47RH 14 PARTIALFT BA 22LH, BA 44LH,
BA 45LH, BA 47LH
BA 22RH, BA 44RH, BA 45RH, BA 47RH
BA 22LH, BA 44LH, BA 45LH, BA 47LH
BA 22RH, BA 44RH, BA 45RH, BA 47RH 15 TOTALFT BA 21LH, BA 22LH,
BA 44LH, BA 45LH, BA 47LH
BA 21RH, BA 22RH, BA 44RH, BA 45RH, BA 47RH
BA 21LH, BA 22LH, BA 44LH, BA 45LH, BA 47LH
BA 21RH, BA 22RH, BA 44RH, BA 45RH, BA 47RH Fifteen subsets were based on combinations of fronto-temporal (FT) regions according to hemisphere and task and defined as follows: (a) only frontal regions (partial subsets 1–2 and total subset 3); (b) only temporal regions (partial subsets 4–5 and total subset 6), and (c) combination of frontal and temporal regions (partial subsets 7–14 and total subset 15). These subsets were evaluated for three thematic sets according to task (semantic only, SEM only; phonological only, PHONO only; semantic and phonological combined, SEM?PHONO) and hemisphere (left hemisphere, right hemisphere and bilateral—both hemispheres)
Table 3Results obtained for the selected subset SEM (semantic) LH (left hemisphere) BA 21 and BA47 in terms of AUC as the performance metric for each iteration of the outer MCCV, using the
XGBoost algorithm (n_estimators=1200, learning rate=0.01, subsample=0.7, max_depth=3)
Iteration number
1 2 3 4 5 6 7 8 9 10 11 12
Subset selected SEM L21 L47 SEM L21 L47 SEM L21 L47 SEM L21 L47 SEM L21 L47 SEM L21 L47 SEM L21 L47 SEM L21 L47 SEM L21 L47 SEM L21 L47 SEM L21 L47 SEM L21 L47
on the validation set that was held out from the feature selection step. All splits were performed in a stratified way to get the same ratio of patients with epilepsy. In order to assure stability of feature selection and get correct gener-alization of the classification performance, we repeated this process twelve times by randomly shuffling the dataset before splitting into training and validation sets. We finally obtained twelve performance metrics (cf. Table3) for twelve feature subsets, based on a distribution of samples.
2.8.4 Metrics
The predictive power of a classifier was scored by the area under the receiver operating characteristic curve (AUC) as recommended by Provost [50–52]. The AUC can be interpreted as the probability that a classifier ranks a ran-domly chosen positive instance higher than a ranran-domly chosen negative one (assuming ‘positive’ ranks higher than ‘negative’). The receiver operating curve (ROC) was the true positive rate plotted as a function of the false positive rate where the positive condition was to be a patient with epilepsy. It represents the performance of the model on a two-dimensional curve. The AUC value then reduces it to a number. A perfect model would score an AUC of 100% while a random classification would score 50%.
3 Results
As illustrated in Table3 and Fig.2, the feature subset
Semantic left hemisphere BA21_BA47 was selected each time among 135 candidates, with an AUC mean of 91±5% on the validation set. The ML process showed a
Fig. 1 Illustration of the validation schema, using outer Monte Carlo cross-validation (MCCV)
strong stability in feature selection and a very good level of classification performance.
4 Discussion
This is a proof of concept study illustrating the ability of a specific ML approach, the XGBoost algorithm, to classify subjects in two distinct classes or categories, healthy/typical versus patients with epilepsy/atypical, according to their language representation, as determined with fMRI. This statistical method does not require manipulation of data and uses neurophysiological features reflecting the amount of activated language regions, for two main processes: semantic and phonological. Our results showed that a specific subset best distinguished the two categories of par-ticipants, namely the subset SEM_LH BA_47-21, showing that the left fronto-temporal activation induced by the SEM task was the most relevant to classify patients. This result can be discussed in the framework of current debates on language representation and reorganization in focal epilepsy [3]. Our result reflects reorganization of language networks in the predominant left hemisphere for language [4], and this can be considered as a specific ‘atypical’ profile of language rep-resentation. Indeed, the majority of individuals, mainly healthy, show ‘typical’ language representation with the left hemisphere predominant for language [4]. The majority of patients with focal epilepsy show higher variability of lan-guage representation within and between hemispheres, known as ‘atypical’ profiles, induced by the chronic devel-opment of the epileptic activity. Although many atypical profiles were described [42], three of them are more fre-quently observed (see [3]): (a) atypical inter-hemispheric representation with complete displacement of language areas from the left to the right regions [14, 53, 54]; (b) atypical inter-hemispheric representation with only par-tial displacement of language regions to the right hemisphere [17,55]; and (c) atypical intra-hemispheric reorganization of language networks within the predominant, left hemisphere for language. This latter profile of reorganization fits well with our result, indicating that the best distinction between patients and healthy is based on changes occurring in the predominant left hemisphere for language. Indeed, an intra-hemispheric reorganization of language networks with sup-plementary or additional recruitment of fronto (BA47)— temporal (BA21) regions might occur in patients to maintain a correct level of language performance. The neurophysio-logical biomarker that seems to distinguish patients from healthy individuals at an intra-hemispheric level, is the activation of two crucial integrative regions—one frontal, the BA 47 and the other temporal, the BA 21—both responsible for semantic processing [56]. Their effect was located in the same left hemisphere, hence providing an
ensure efficient language processing [64]. Nevertheless, compared to more visible inter-hemispheric profiles, the intra-hemispheric reorganization of language activity is more difficult to observe with classical fMRI statistical analyses. Mbwana et al. [64] suggested, for instance, that fMRI comparisons between patients and healthy subjects are constrained by a priori assumptions and reliance on prese-lection of cerebral regions and that the incidence of intra-hemisphere reorganization may be underestimated or masked. Based on these assumptions, we suggest that the ML–XGBoost algorithm could be a useful tool to detect the intra-hemispheric atypical reorganization patterns, more difficult to assess in patients, but having a major role in the neuroplasticity of language in patients with epilepsy. In terms of suitable tasks to map language networks, our results show that compared to phonological task, the semantic task is more reliable for classifying patients, even if both tasks activate fronto-temporal regions. The advantage of using a semantic task is that this task induces a more spread-out activation within frontal and temporal language networks. This assumption is in agreement with the findings by Billingsley et al. [9], showing that language reorganization in patients is mainly revealed by a semantic task, whereas a phonological task results in more specific prefrontal activa-tion. Indeed the predictive capacity of postsurgical language outcome depends significantly on the regional location of brain activity. Moreover, a specific question raised by many investigations on language representation and lateralization is whether it is necessary to map the entire language system including frontal and temporal regions for this answer or whether only a partial mapping of frontal or temporal regions is sufficient to reveal the predominant hemisphere for lan-guage. Our winning subset SEM_LH BA_47-21 suggests that the robust classification of patients requires information on a larger fronto-temporal network which is efficiently revealed by a SEM task. In terms of clinical impact, we claim that the differential intra-hemispheric reorganization as reflected by SEM_LH BA_47-21 could suggest that left fronto-temporal regions are ‘sensitive-to-surgery’ and should be spared during surgery to avoid postsurgical lan-guage deficits. Methodologically, we claim that the XGBoost algorithm used in this study is able to compare cognitively plausible patterns (feature subsets) and highlight the best one, and able to separate categories of participants.
5 Conclusions
The ML–XGBoost is a powerful statistical method of classification which detects nonlinear patterns in datasets with missing values. It shows significant potential for classifying patients with epilepsy based on the cerebral region, hemisphere and processing of their language
representation. One subset, or a specific combination of features, the SEM_LH BA_47-21, was the most powerful, for identifying patients. The importance of this particular subset is plausible given the cognitive and clinical obser-vations made with these patients.
Acknowledgements This work was partially funded for Grenoble MRI facility IRMaGe, by the French program ‘Investissement d’Avenir’run by the‘Agence Nationale pour la Recherche’: Grant ‘Infrastructure d’Avenir en Biologie Sante´’ (ANR-11-INBS-0006).
Compliance with ethical standards
Conflict of interest The authors declare no conflicts of interest.
Open Access This article is distributed under the terms of the Creative Commons Attribution 4.0 International License (http://crea tivecommons.org/licenses/by/4.0/), which permits unrestricted use, distribution, and reproduction in any medium, provided you give appropriate credit to the original author(s) and the source, provide a link to the Creative Commons license, and indicate if changes were made.
References
1. Wieser H, Engel J, Pea Williamson (1993) Surgically remediable temporal lobe syndromes. Surgical treatment of the epilepsies. Raven Press, New York, pp 49–63
2. Springer J, Binder J, Hammeke T, Swanson S, Frost J, Bellgowan P, Brewer C, Perry H, Morris G, Muller W (1999) Language dominance in neurologically normal and epilepsy subjects. A functional MRI study Brain. A J Neurol 122(11):20033–22045 3. Baciu M, Perrone-Bertolotti M (2015) What do patients with
epilepsy tell us about language dynamics? A review of fMRI studies. Rev Neurosci 26(3):323–341
4. Josse G, Tzourio-Mazoyer N (2004) Hemispheric specialization for language. Brain Res Rev 44(1):1–12
5. Noachtar S, Borggraefe I (2009) Epilepsy surgery: a critical review. Epilepsy Behav 15(1):66–72
6. Wrench JM, Matsumoto R, Inoue Y, Wilson SJ (2011) Current challenges in the practice of epilepsy surgery. Epilepsy Behav (in Press, Corrected Proof)
7. Wada JA, Clarke R, Hamm A (1975) Cerebral hemispheric asymmetry in humans: cortical speech zones in 100 adult and 100 infant brains. Arch Neurol 32(4):239–246
8. Sharan A, Ooi YC, Langfitt J, Sperling MR (2011) Intracarotid amobarbital procedure for epilepsy surgery. Epilepsy Behav 20(2):209–213
9. Billingsley RL, McAndrews MP, Crawley AP, Mikulis DJ (2001) Functional MRI of phonological and semantic processing in temporal lobe epilepsy. Brain 124(6):1218
10. Cousin E, Baciu M, Pichat C, Kahane P, Le Bas JF (2008) Functional MRI evidence for language plasticity in adult epileptic patients: preliminary results. Neuropsychiatr Dis Treat 4(1):235 11. Berl MM, Balsamo LM, Xu B, Moore EN, Weinstein SL, Conry
JA, Pearl PL, Sachs BC, Grandin CB, Frattali C (2005) Seizure focus affects regional language networks assessed by fMRI. Neurology 65(10):1604
13. Rosenberger LR, Zeck J, Berl MM, Moore EN, Ritzl EK, Sha-mim S, Weinstein SL, Conry JA, Pearl PL, Sato S (2009) Inter-hemispheric and intraInter-hemispheric language reorganization in complex partial epilepsy. Neurology 72:1830
14. Dijkstra KK, Ferrier CH (2013) Patterns and predictors of atyp-ical language representation in epilepsy. J Neurol Neurosur Psychiatry. doi:10.1136/jnnp-2012-303141
15. Perrone-Bertolotti M, Zoubrinetzky R, Gt Yvert, Le Bas JF, Baciu M (2012) Functional MRI and neuropsychological evidence for language plasticity before and after surgery in one patient with left temporal lobe epilepsy. Epilepsy Behav 23(1):81–86
16. Baciu M, Watson J, Maccotta L, McDermott K, Buckner R, Gilliam F, Ojemann J (2005) Evaluating functional MRI proce-dures for assessing hemispheric language dominance in neuro-surgical patients. Neuroradiol 47(11):835–844
17. Baciu M, Watson J, McDermott K, Wetzel R, Attarian H, Moran C, Ojemann J (2003) Functional MRI reveals an interhemispheric dissociation of frontal and temporal language regions in a patient with focal epilepsy. Epilepsy Behav 4(6):776–780
18. Gazit T, Andelman F, Glikmann-Johnston Y, Gonen T, Solski A, Shapira-Lichter I, Ovadia M, Kipervasser S, Neufeld MY, Fried I, Hendler T, Perry D (2016) Probabilistic machine learning for the evaluation of presurgical language dominance. J Neurosurg 125(2):481–493
19. Abbott DF, Waites AB, Lillywhite LM, Jackson GD (2010) fMRI assessment of language lateralization: an objective approach. Neuroimage 50(4):1446–1455
20. Spritzer SD, Hoerth MT, Zimmerman RS, Shmookler A, Hoff-man-Snyder CR, Wellik KE, Bart D, Wingerchuk DM (2012) Determination of hemispheric language dominance in the surgi-cal epilepsy patient: diagnostic properties of functional magnetic resonance imaging. Neurologist 18(5):329–331
21. Alvarez A, Sierra B, Arruti A, Lopez-Gil J-M, Garay-Vitoria N (2015) Classifier subset selection for the stacked generalization method applied to emotion recognition in speech. Sensors 16(1):21
22. Kaufmann T, Elvsa˚shagen T, Alnæs D, Zak N, Pedersen PØ, Norbom LB, Quraishi SH, Tagliazucchi E, Laufs H, Bjørnerud A, Malt UF, Andreassen OA, Roussos E, Duff EP, Smith SM, Groote IR, Westlye LT (2016) The brain functional connectome is robustly altered by lack of sleep. NeuroImage 127:324–332 23. Besga A, Ortiz L, Fernandez A, Maestu F, Arrazola J,
Gil-Gre-gorio P, Fuentes M, Ortiz T (2015) Structural and functional patterns in healthy aging, mild cognitive impairment, and Alz-heimer disease. AlzAlz-heimer Dis Assoc Disord 24(1):1–10 24. Steele VR, Rao V, Calhoun VD, Kiehl KA (2017) Machine
learning of structural magnetic resonance imaging predicts psy-chopathic traits in adolescent offenders. NeuroImage 145(B):265–269
25. Munsell BC, Wee C-Y, Keller SS, Weber B, Elger C, da Silva LAT, Nesland T, Styner M, Shen D, Bonilha L (2015) Evaluation of machine learning algorithms for treatment outcome prediction in patients with epilepsy based on structural connectome data. NeuroImage 118(1):219–230
26. Chen T, Guestrin C (2016) Xgboost: a scalable tree boosting system. In: Proceedings of the 22Nd ACM SIGKDD international conference on knowledge discovery and data mining. ACM, pp 785–794
27. Friedman JH (2001) Greedy function approximation: a gradient boosting machine. Ann Stat 29(5):1189–1232
28. Chen T, He T (2014) Higgs boson discovery with boosted trees. In: HEPML@ NIPS, pp 69–80
29. Mo¨ller A, Ruhlmann-Kleider V, Leloup C, Neveu J, Palanque-Delabrouille N, Rich J, Carlberg R, Lidman C, Pritchet C (2016) Photometric classification of type Ia supernovae in the
SuperNova Legacy Survey with supervised learning. J Cosmol Astropart Phys 12:008
30. Tamayo D, Silburt A, Valencia D, Menou K, Ali-Dib M, Petro-vich C, Huang CX, Rein H, van Laerhoven C, Paradise A (2016) A machine learns to predict the stability of tightly packed plan-etary systems. Astrophys J Lett 832(2):L22
31. Cousin E, Peyrin C, Pichat Cd, Lamalle L, Le Bas J-F, Baciu M (2007) Functional MRI approach for assessing hemispheric pre-dominance of regions activated by a phonological and a semantic task. Eur J Radiol 63(2):274–285
32. Baciu M, Kahane P, Minotti L, Charnallet A, David D, Le Bas JF, Segebarth C (2001) Functional MRI assessment of the hemi-spheric predominance for language in epileptic patients using a simple rhyme detection task. Epileptic Disord 3:117–124 33. Bahn MM, Lin W, Silbergeld DL, Miller JW, Kuppusamy K,
Cook RJ, Hammer G, Wetzel R, Cross D 3rd (1997) Localization of language cortices by functional MR imaging compared with intracarotid amobarbital hemispheric sedation. AJR Am J Roentgenol 169(2):575–579
34. Friston KJ, Zarahn E, Josephs O, Henson RNA, Dale AM (1999) Stochastic designs in event-related fMRI. NeuroImage 10(5):607–619
35. Friston KJ, Holmes AP, Worsley KJ, Poline JP, Frith CD, Frackowiak RSJ (1995) Statistical parametric maps in functional imaging: a general linear approach. Hum Brain Mapp 2(4):189–210
36. Natekin A, Knoll A (2013) Gradient boosting machines, a tuto-rial. Front neurorobotics 7:21
37. He X, Pan J, Jin O, Xu T, Liu B, Xu T, Shi Y, Atallah A, Herbrich R, Bowers S (2014) Practical lessons from predicting clicks on ads at facebook. In: Proceedings of the eighth interna-tional workshop on data mining for online advertising. ACM, pp 1–9
38. Caruana R, Niculescu-Mizil A (2006) An empirical comparison of supervised learning algorithms. In: Proceedings of the 23rd international conference on Machine learning. ACM, pp 161–168 39. Li J, Cheng K, Wang S, Morstatter F, Trevino RP, Tang J, Liu H (2016) Feature selection: a data perspective.arXiv:160107996
40. Raschka S (2015) Python machine learning. Packt Publishing Ltd, Birmingham
41. Goldmann RE, Golby AJ (2005) Atypical language representa-tion in epilepsy: implicarepresenta-tions for injury-induced reorganizarepresenta-tion of brain function. Epilepsy Behav 6(4):473–487
42. Berl MM, Zimmaro LA, Khan OI, Dustin I, Ritzl E, Duke ES, Sepeta LN, Sato S, Theodore WH, Gaillard WD (2014) Char-acterization of atypical language activation patterns in focal epilepsy. Ann Neurol 75(1):33–34
43. Pedregosa F, Varoquaux G, Gramfort A, Michel V, Thirion B, Grisel O, Blondel M, Prettenhofer P, Weiss R, Dubourg V (2011) Scikit-learn: machine learning in Python. J Mach Learn Res 12:2825–2830
44. Cawley GC, Talbot NL (2010) On over-fitting in model selection and subsequent selection bias in performance evaluation. J Mach Learn Res 11:2079–2107
45. Friedman JH (2002) Stochastic gradient boosting. Comput Stat Data Anal 38(4):367–378
46. Dubitzky W, Granzow M, Berrar DP (2007) Fundamentals of data mining in genomics and proteomics. Springer, Berlin 47. Xu QS, Liang YZ (2001) Monte Carlo cross validation.
Che-mometr Intell Lab Syst 56(1):1–11
48. Nowotny T (2014) Two challenges of correct validation in pattern recognition. Front Robot AI 1:5
50. Provost F, Fawcett T, Kohavi R (1998) The case against accuracy estimation for comparing induction algorithms. In: Proceedings of the fifteenth international conference on machine learning. Morgan Kaufmann, pp 445–453
51. Ling CX, Huang J, Zhang H (2003) AUC: a better measure than accuracy in comparing learning algorithms. In: Xiang Y, Chaib-draa B (eds) Conference of the Canadian society for computa-tional studies of intelligence. Springer, Berlin, pp 329–341 52. Herna´ndez-Orallo J, Flach P, Ferri C (2012) A unified view of
performance metrics: translating threshold choice into expected classification loss. J Mach Learn Res 13:2813–2869
53. Gaillard WD, Balsamo L, Xu B, Grandin C, Braniecki S, Papero P, Weinstein S, Conry J, Pearl P, Sachs B (2002) Language dominance in partial epilepsy patients identified with an fMRI reading task. Neurology 59(2):256–265
54. Thivard L, Hombrouck J, du Montcel ST, Delmaire C, Cohen L, Samson S, Dupont S, Chiras J, Baulac M, Lehe´ricy S (2005) Productive and perceptive language reorganization in temporal lobe epilepsy. Neuroimage 24(3):841–851
55. Ries M, Boop FA, Griebel ML, Zou P, Phillips NS, Johnson SC, Williams J, Helton KJ, Ogg RJ (2004) Functional MRI and Wada determination of language lateralization: a case of crossed dom-inance. Epilepsia 45(1):85–89
56. Binder JR, Desai RH, Graves WW, Conant LL (2009) Where is the semantic system? A critical review and meta-analysis of 120 functional neuroimaging studies. Cereb Cortex 19(12): 2767–2796
57. Ardila A, Bernal B, Rosselli M (2016) How localized are lan-guage brain areas? A review of Brodmann areas involvement in oral language. Arch Clin Neuropsychol 31(1):112–122
58. Badre D, Wagner AD (2004) Selection, integration, and conflict monitoring: assessing the nature and generality of prefrontal cognitive control mechanisms. Neuron 41(3):473–487
59. Booth JR, Burman DD, Meyer JR, Gitelman DR, Parrish TB, Mesulam M (2002) Modality independence of word compre-hension. Hum Brain Mapp 16(4):251–261
60. Fan LY, Lee SH, Chou TL (2010) Interaction between brain regions during semantic processing in Chinese adults. Lang Linguist 11(1):159–182
61. Han Z, Ma Y, Gong G, He Y, Caramazza A, Bi Y (2013) White matter structural connectivity underlying semantic processing: evidence from brain damaged patients. Brain 136(10):2952–2965 62. Bertolotti M, Girard C, Cousin E, Vidal JR, Pichat C, Kahane P, Baciu M (2015) NEREC, an effective brain mapping protocol for combined language and long-term memory functions. Epilepsy Behav 53:140–148
63. Ojemann G, Ojemann J, Lettich E, Berger M (1989) Cortical language localization in left, dominant hemisphere. An electrical stimulation mapping investigation in 117 patients. J Neurosurg 71(3):316
64. Mbwana J, Berl MM, Ritzl EK, Rosenberger L, Mayo J, Wein-stein S, Conry JA, Pearl PL, Shamim S, Moore EN (2009) Limitations to plasticity of language network reorganization in localization related epilepsy. Brain 132(2):347
L. Torlay is a computer science engineer, specialist in predictive statistical analyses, machine learning, and their implementation into applications and technological tools. Specifically, he develops explanatory or predictive models of cognitive functions in healthy subject and patients presenting cerebral lesions.
Dr. M. Perrone-Bertolottiis lecturer in Cognitive Psychology. She investigates the cognitive mechanism and the neural correlates of language processing in interaction with others cognitive functions (such as executive control, attention, action and verbal thought). Her work aims to understand how we can improve language comprehen-sion and production by training other cognitive functions (reshaping the language network). To do so, she uses a multidisciplinary and a multimethodological approach.
Dr. E. Thomasis lecturer in biomedical sciences, currently carrying out computational and experimental work on the following projects: (a) muscular synergies during motor control that permit a reduction in the number of degrees of freedom involved when executing a movement; (b) machine learning methods for identifying ensemble changes in the nervous system, and (c) modifications of movement patterns with aging.