PROVIDER AND PEER SELECTION IN THE EVOLVING INTERNET ECOSYSTEM
A Thesis Presented to The Academic Faculty
by
Amogh Dhamdhere
In Partial Fulfillment of the Requirements for the Degree
Doctor of Philosophy in the College of Computing
Georgia Institute of Technology May 2009
PROVIDER AND PEER SELECTION IN THE EVOLVING INTERNET ECOSYSTEM
Approved by:
Dr. Constantine Dovrolis, Advisor College of Computing
Georgia Institute of Technology
Dr. Ellen Zegura College of Computing
Georgia Institute of Technology
Dr. Mostafa Ammar College of Computing
Georgia Institute of Technology
Dr. Walter Willinger AT&T Labs - Research
Dr. Nick Feamster College of Computing
Georgia Institute of Technology
ACKNOWLEDGEMENTS
This thesis would not have been possible without the presence of many people who have influenced my life and work over the years. I take this opportunity to thank some of them. First and foremost, I would like to thank my advisor Constantine Dovrolis for his guid-ance and support over the years. His patience, attention to detail, and depth of thought continue to amaze me. Most of all, I never got the feeling of working for my advisor; I workedwithhim. Everything I have learned about research has been from him.
Thanks also to the NTG faculty – Mostafa Ammar, Ellen Zegura, Jim Xu and Nick Feamster. They are wonderful people to interact with on a personal level, critical and insightful when it comes to research, and great teachers. All the credit goes to them for creating the perfect environment in the NTG. Thanks also to Walter Willinger for serving on my proposal and thesis committees, and for the tremendously useful comments on proposal and thesis drafts that I kept bugging him with. I would also like to thank my mentors at summer internships – Christophe Diot and Renata Teixeira at Thomson and Nick Duffield, Shubho Sen, Lee Breslau, Alex Gerber, Carsten Lund and Cheng Ee at AT&T Labs – for giving me the opportunity to work on challenging research problems not directly related to my thesis.
I couldn’t imagine spending the years at Georgia Tech without the company of some of the nicest, smartest and most hardworking coworkers I’ve known; The “seniors” Sridhar, Pradnya, Shashi, Ruomei, Qi, Minaxi and Christos were around when I joined the group and did their best to make me feel a part of the NTG. I learned a lot just standing around and listening to them discuss their research. Then there are the folks with whom I spent the bulk of my PhD years – Ravi, Manish, Abhishek, Yarong, Srini and Mukarram. These guys made coming back to the lab every day something to look forward to. I will never forget all those coffee breaks, cricket sessions, lunch gatherings and SRGs at GCATT. Finally, the bunch of new arrivals – Partha, Anirudh, Murtaza, Ahmed and others – who never
stopped reminding me of my age (in the Ph.D. program), and staked their claims to the most coveted desk in the lab. They also never refused to sit through various practice talks and dry runs, kept the lab awake at ungodly hours of the night, and in general ensured a lively work environment in the lab. I am fortunate to be able to count many of these current and former labmates among my close friends. Special thanks to Pradnya, Ruomei, Ravi and Manish for the great times!
I have been lucky to have met many interesting people outside of the lab during my years at Georgia Tech. These are too many to name them all, but special thanks to George, VKG, Glen, Harpreet, Agni, Avanish, Mahesh and Sushant. These guys were great outlets when computer science, networking and research all became a bit too much..
Finally, words cannot adequately express my gratitude towards my family, in particular my parents, brother Ashay and sister-in-law Gyanam. If not for their their constant en-couragement, help and support over the years, I might never have had the chance to write this. I dedicate this thesis to them.
TABLE OF CONTENTS DEDICATION . . . iii ACKNOWLEDGEMENTS . . . iv LIST OF TABLES . . . ix LIST OF FIGURES . . . x SUMMARY . . . xiii I INTRODUCTION . . . 1 1.0.1 Thesis organization . . . 6
II MEASURING THE EVOLUTION OF THE INTERNET ECOSYSTEM . . . 7
2.1 Introduction . . . 7
2.2 Datasets and methodology . . . 10
2.3 Growth and rewiring trends . . . 16
2.4 Evolution of AS types . . . 23
2.5 Evolution of CP relations: customer-side properties . . . 30
2.6 Evolution of CP relations: provider-side properties . . . 34
2.7 Conjectures on the evolution of peering . . . 39
2.8 Related work . . . 41
2.9 Conclusions . . . 44
III THE VIEW FROM THE EDGE: ISP SELECTION FOR MULTIHOMED NET-WORKS . . . 46
3.1 Introduction . . . 46
3.2 Problem Description and Objectives . . . 48
3.3 Phase I - ISP Selection . . . 50
3.3.1 Problem statement . . . 50
3.3.2 Monetary cost . . . 53
3.3.3 AS-level path length cost . . . 55
3.3.4 Path diversity cost . . . 56
3.4 Phase I - Path Diversity . . . 56
3.4.2 AS-level paths . . . 57
3.4.3 Evaluation of path diversity . . . 58
3.5 Phase II - Egress Path Selection . . . 60
3.5.1 Problem statement . . . 60
3.5.2 The algorithm . . . 62
3.5.3 Initial mapping . . . 63
3.5.4 Stochastic search and simulated annealing . . . 63
3.6 Phase II - Evaluation . . . 66
3.6.1 Measured traffic and topology datasets . . . 66
3.6.2 Simulator parameters . . . 67
3.6.3 Evaluation of Algorithm-1 . . . 68
3.6.4 Evaluation of Algorithm-2 . . . 70
3.7 Related Work . . . 75
3.8 Conclusions . . . 76
IV A MODEL FOR INTERDOMAIN NETWORK FORMATION, ECONOMICS AND ROUTING . . . 78 4.1 Introduction . . . 78 4.2 Model description . . . 82 4.2.1 Network types . . . 82 4.2.2 Traffic model . . . 83 4.2.3 Geographical constraints . . . 84
4.2.4 Routing and traffic flow . . . 85
4.2.5 Economic model . . . 85
4.2.6 Provider selection methods . . . 87
4.2.7 Multihoming . . . 88
4.2.8 Peer selection methods . . . 88
4.2.9 Initialization . . . 89
4.3 Solving the model . . . 90
4.3.1 AN actions . . . 90
4.3.2 Computing equilibrium . . . 92
4.3.4 Uniqueness of equilibrium . . . 95
4.4 Model validation . . . 96
4.5 The default model . . . 98
4.5.1 Path Lengths . . . 100
4.5.2 Peering links . . . 102
4.5.3 “Unprofitable-but-Active” (UA) providers . . . 102
4.5.4 Provider profitability when STPs use PR: . . . 103
4.5.5 Provider profitability when STPs use SEL . . . 104
4.6 Deviation-1: P2P Traffic matrix . . . 105
4.7 Deviation-2: PF provider selection by edge networks . . . 107
4.8 Deviation-3: CPs replicate their content in every region . . . 110
4.9 Related Work . . . 112
4.10 Conclusions . . . 117
V STRATEGIES FOR ACCESS PROVIDERS: THE NETWORK NEUTRALITY DEBATE . . . 118
5.1 Introduction . . . 118
5.2 The Network Model . . . 119
5.3 The baseline model . . . 121
5.3.1 Evaluation of the baseline scheme . . . 124
5.4 ISP strategies . . . 125
5.4.1 AP charges heavy hitters . . . 125
5.4.2 AP caps heavy hitters . . . 127
5.4.3 AP charges CPs . . . 128
5.4.4 Selective peering with CPs . . . 130
5.4.5 AP caches CP content . . . 133
5.5 Conclusions . . . 134
VI CONTRIBUTIONS AND FUTURE WORK . . . 136
6.0.1 Future work . . . 139
LIST OF TABLES
1 Definitions of acronyms used . . . 83 2 Output metrics for the default model (DF), averaged over 20 simulation runs. 101 3 Output metrics for Deviation-1 (P2P), averaged over 20 simulation runs. . . 109 4 Output metrics for Deviation-2 (EP), averaged over 20 simulation runs. . . 111 5 Output metrics for Deviation-3 (GEO), averaged over 20 simulation runs. . 113
LIST OF FIGURES
1 Visibility of ASes, CP and PP links as a function of the number of monitors
used in a snapshot. . . 15
2 Evolution of the number of ASes and CP links. The regression curves are also shown. . . 18
3 Evolution of CP and PP links in absolute numbers and as a fraction of the total number of links. . . 19
4 Evolution of average AS degree, AS-path length, and multihoming degree. . 21
5 Evolution of the number of CP link births (and deaths) due to node births (and deaths) versus rewiring. . . 22
6 The Jaccard distance for CP links where the customer is stub versus non-stub. 23 7 Coordinate boundaries for the four AS types we consider. . . 26
8 Evolution of the population of AS types. . . 28
9 Regional distribution of AS types over time. . . 29
10 Rewiring activity and fraction of inert ASes for each AS type. . . 30
11 Evolution of average number of providers for each AS type. . . 31
12 Evolution of the distribution of the number of providers of CAHPs. . . 32
13 Evolution of CP links between different pairs of AS types. . . 33
14 Fraction of active customer ASes in each geographical region. . . 34
15 Attractiveness and repulsiveness versus customer degree. . . 35
16 Evolution of the number of attractors and repellers (total and among AS types). . . 37
17 Evolution of number of attractors and repellers in each geographical region. 38 18 Evolution of total attractiveness of attractors and repellers in each geograph-ical region. . . 39
19 Lag of maximum absolute correlation for each AS provider inAR. . . 40
20 Median number of peers for each AS type over time. . . 41
21 Number of PP links of the most common types. . . 42
22 A multihomed network with K upstream ISPs, and M major destinations . 49 23 Complementary CDF of egress traffic to the 250 largest destination networks. 57 24 CDF of ∆u for single-link failures. . . 58
26 CDF of ∆u for triple-link failures. . . 60
27 Linkeis not the bottleneck of pathsP1 andP2, but it can become the joint bottleneck of the two paths when they are used simultaneously. . . 61
28 Probability that solution exists, and probability that solution is found by Algorithm-1 when it exists. . . 69
29 Cost ratio between Algorithm-1 solution and optimal solution. . . 70
30 Probability that a solution is found. . . 72
31 Number of iterations during transient phase. . . 73
32 Total traffic loss during transient phase. . . 73
33 Total rerouted traffic during transient phase. . . 74
34 The interdependence between topology, traffic flow and per-AN utility in the Internet ecosystem . . . 80
35 ANican remove providerskandlafter forming a peering link with providerj. 91 36 Simulation time to find an equilibrium vs. the number of ANs. . . 93
37 Examples of cases that lead to oscillations . . . 94
38 Degree distribution for an internetwork with 945 ANs{DF, SEL,CB), (SEL,NC)}. 97 39 Average path length as the number of ANs is increased for scenario {DF, (SEL,CB), (SEL,NC)}. . . 98
40 C-CDF of traffic volume on each link for scenario {DF, (PR,TR), (SEL,NC)}. 99 41 Peering between LTPs and CPs increases LTP profitability, but also increases weighted path lengths. The arrows indicate the paths followed by large traffic flows. . . 103
42 Peering between STPs more likely with P2P traffic and especially when LTPs peer with CPs. The arrows indicate the paths followed by large traffic flows. 108 43 The network model . . . 121
44 CCDF of the amount downloaded by users (GB/month). . . 123
45 Variability of AP costs with the number of users, access speeds and type of traffic. . . 125
46 User departure probability as a function of T,N=20000. . . 127
47 AP profit as a function ofT when the AP charges heavy hitters,N=20000. 128 48 AP profit as a function ofT when the AP caps heavy hitters,N=20000. . . 129
49 AP profits by charging CPs, as a function of the fraction of CPs charged, N=20000, 1.5Mbps access. . . 130 50 AP profits with selective peering as a function ofR. N=20000, 1.5Mbps access.133
SUMMARY
The Internet consists of thousands of autonomous networks connected together to provide end-to-end reachability. Networks of different sizes, and with different functions and business objectives, interact and co-exist in the evolving “Internet Ecosystem.” The Internet ecosystem is highly dynamic, experiencing growth (birth of new networks), rewiring (changes in the connectivity of existing networks), as well as deaths (of existing networks). The dynamics of the Internet ecosystem are determined both by external “environmental” factors (such as the state of the global economy or the popularity of new Internet appli-cations) and the complex incentives and objectives of each network. These dynamics have major implications on how the future Internet will look like. How does the Internet evolve? What is the Internet heading towards, in terms of topological, performance, and economic organization? How do given optimization strategies affect the profitability of different net-works? How do these strategies affect the Internet in terms of topology, economics, and performance?
In this thesis, we take some steps towards answering the above questions using a com-bination of measurement and modeling approaches. We first study the evolution of the Autonomous System (AS) topology over the last decade. In particular, we classify ASes and inter-AS links according to their business function, and study separately their evolu-tion over the last 10 years. Next, we focus on enterprise customers and content providers at the edge of the Internet, and propose algorithms for a stub network to choose its up-stream providers to maximize its utility (either monetary cost, reliability or performance). Third, we develop a model for interdomain network formation, incorporating the effects of economics, geography, and the provider/peer selections strategies of different types of networks. We use this model to examine the “outcome” of these strategies, in terms of the topology, economics and performance of the resulting internetwork. We also investigate the effect of external factors, such as the nature of the interdomain traffic matrix, customer
preferences in provider selection, and pricing/cost structures. Finally, we focus on a recent trend due to the increasing amount of traffic flowing from content providers (who generate content), to access providers (who serve end users). This has led to a tussle between content providers and access providers, who have threatened to prioritize certain types of traffic, or charge content providers directly – strategies that are viewed as violations of “network neutrality”. In our work, we evaluate various pricing and connection strategies that access providers can use to remain profitable without violating network neutrality.
CHAPTER I
INTRODUCTION
The Internet, commonly described as a “network of networks”, consists of thousands of autonomous networks connected together to provide global reachability. Each network is independently operated and managed, and has its own (possibly different) incentives and requirements in connecting to the Internet. Networks with different sizes, functions, and business objectives interact and co-exist in the “Internet ecosystem”. Networks are selfish, meaning that they are concerned only with maximizing their own utility from connecting to the Internet. Further, the Internet is distributed, where no single entity has global knowledge about the actions and objectives of other networks. As such, we can think of the Internet as a distributed, multi-agent system with strictly local interactions between agents.
An important characteristic of the Internet is that it constantly evolves. A plausible cause for the evolution and dynamics in the Internet is that networks change their connec-tivity to optimize a utility function, and also respond to external effects such as economic conditions and regulation. The Internet, when viewed as a graph at the interdomain level, is thus a dynamic graph that shows birth and death of networks and rewiring of the con-nectivity of existing networks. A key feature is that this dynamic graph evolves through
local optimizations, as networks change their set of providers and peers. The dynamics of the Internet ecosystem are also influenced by external “environmental” factors (such as the state of the global economy or the popularity of new Internet applications). Much previous work on interdomain topologies has studied the static properties of the Internet graph, such as the degree distribution or clustering coefficient, without studying how this graph evolves over time. Several important questions thus remain unanswered: How does the Internet evolve? Which types of networks account for most of the growth of the Internet? Are most of the dynamics (links created or destroyed) due to the growth of the Internet or changes
in the connectivity of existing networks? What is the Internet headed towards, in terms of topological and economic organization?
When we view the Internet as a graph, it is important to recognize that all nodes and links are not the same. The networks that constitute the Internet have very different objec-tives and incenobjec-tives. For instance, the objective of a transit provider may be to maximize its profit, and it may approach this goal through competitive pricing policies and selective peering. The objective of a content provider, on the other hand, may be to have highly reliable Internet access and to minimize transit expenses, and it may pursue these goals through aggressive multihoming and an open peering policy. Further, interdomain links also have certain semantics associated with them. In particular, networks engage in tran-sit (or customer-provider) relations, and also peering relations. These relations transfer not only traffic but also economic value between networks. Most previous work on inter-domain topology modeling has viewed the Internet graph as “flat”, where all nodes and links are alike. Further, these modeling efforts were “top-down”, meaning that they try to explain certain structural properties of the Internet graph, e.g., the power law degree distribution [10, 15, 90, 107, 113]. This body of work does not try to model the Internet as the outcome of the optimization strategies used by individual networks, and hence cannot provide any insight into which strategies different types of networks should use to maxi-mize their utility. For example, one would like to know which provider and peer selection strategy is most likely to maximize the profitability for different types of networks. Also of interest is the global effect of the strategies used by these networks, e.g., the effect of these strategies on user-perceived cost or performance.
In this thesis, we first measure the evolution of the Internet ecosystem over the last decade. We then develop a first-principles model for interdomain network formation, based on the interactions between different types of networks. We use this model to evaluate the effects of the provider and peer selection strategies used by different types of networks. Our approach differs in several ways from previous research. First, we are interested in the dynamic properties of the topology, rather than static characteristics such as degree distributions or clustering coefficients. Second, we follow a bottom-up approach, modeling
the behavior of different network types as they try to optimize their utility functions, and then observing the emerging global properties. Finally, we recognize the fact that the Internet ecosystem is diverse in the types of networks and interdomain links, and we take into account the different business functions of networks and the semantics associated with interdomain links.
Understanding the evolution of the Internet ecosystem is important for several reasons. First, we believe that there is a need to develop bottom-up models for Internet topology evolution and dynamics that capture the complex interactions between different types of networks. As such, it is necessary to study the differences between the types of networks that form this ecosystem, in terms of business function and incentives. Creating such models will give us the ability to better understand global phenomenon in the Internet, and also to study the global effects of local actions. Second, understanding the evolution of the Internet is critical for studying the performance of protocols and applications over time. For instance, to answer questions like “How will BGP perform 10 years from now?”, we need to know the properties that the Internet’s interdomain topology is likely to show in the future. Studying the evolution of the Internet can help to predict what the Internet may look like in the future. Third, there is much recent interest in generating synthetic interdomain topologies for use in simulations and analysis, e.g, evaluating the scalability of a new routing protocol. A study of the evolution of the Internet can provide valuable inputs to such topology generators, such as how various types of networks connect to each other, and their topological and behavioral properties over time. Further, in light of the recent interest in re-designing the Internet with “clean-slate” approaches, it is crucial to understand how the existing Internet has evolved. Doing so could help design new architectures and mechanisms with the goal of “evolvability”, meaning that they have an intrinsic capability to evolve towards states that are desirable in terms of economics, reliability or performance. Finally, from a practical perspective, Internet Service Providers (ISPs) would benefit from a better understanding of Internet evolution. Doing so would help them choose their provider and peer selection strategies that are likely to maximize their utility in terms of monetary profit, costs or performance.
A summary of the main components of this thesis follows:
• First, we study the evolution of the Internet ecosystem over the last decade, using snapshots of the Autonomous System (AS) topology over the last 10 years. We are interested in the dynamic properties of the AS graph, rather than static measures. Further, we account for the heterogeneity in the types of ASes and inter-AS links in the Internet, and highlight the need to study these separately. We classify ASes according to their business function (Enterprise Customers, Transit Providers and Content/Access Providers), and study the behavior of these AS types separately. We classify inter-AS links as customer-provider (where the customer pays the provider for Internet connectivity) and settlement-free (where peers agree to exchange traffic for free). We highlight several important trends in the global Internet graph over the last decade, such as densification, constant path lengths, and growth that occurs mostly at the edges. We also identify trends in the behavior of different AS types, in terms of their activity (how often they change their connectivity), multihoming preferences, and the geographical region in which they are present.
• Next, we focus on stub networks (Enterprise customers and Content Providers) at the edges of the Internet. Enterprise Customers (EC) are mostly concerned with minimizing their monetary costs, while Content Providers (CP) try to optimize the performance of their egress traffic. The choice of upstream providers can signifi-cantly impact the costs that these networks incur and the end-to-end performance they achieve (to/from their major sources/destinations of traffic). Further, once a stub network selects a set of upstream providers, it needs to determine how to route its egress traffic using that set of providers. In this part of the thesis, we propose algorithms for a stub network to optimize its set of upstream providers. The opti-mization objective is to minimize the monetary cost incurred while achieving good performance (short AS-level paths and high path diversity) to the major destinations of egress traffic. We show that our proposed algorithms can choose the set of up-stream providers that are close to optimal in terms of the resulting costs, AS-level
path lengths and path diversity. In the second part of this work, we propose an algo-rithm for egress path selection that finds a congestion-free allocation of egress flows to upstream providers (if it exists) with minimum cost for the source network.
• Next, we focus on transit providers in the Internet ecosystem, which are mainly con-cerned with maximizing their revenue. They may achieve this objective by competitive pricing schemes, intelligent provider selection and selective peering with other transit providers or content providers. In this part of the thesis, we develop a model for interdomain network formation that captures the interdependence between topology, traffic flow and revenue in the Internet. We also account for the interdependence between provider and peer selection by a network. We model the effect of external factors such as economics, geography, and the nature of the interdomain traffic ma-trix. We then use agent-based simulations to computationally find the equilibrium internetwork, as it is too complex to do using analytical or game-theoretic approaches. We then study the global effects of various provider and peer selection strategies used by transit providers. Anecdotal evidence suggests that there are commonly accepted rules of thumb that ASes use to engage in peering relationships. For example, large transit providers engage in “restrictive” peering, whereby they do not peer unless it is necessary to maintain global reachability. Smaller transit providers typically peer if the traffic they exchange with their peers is roughly balanced (commonly referred to as the “traffic-ratio” requirement). We use our model to determine the conditions under which these strategies are profitable for small and large transit providers. We also study the effects of these strategies on the resulting network in terms of topology (which networks tend to attract customers or peers?), economics (which providers are profitable?), and performance (average interdomain path lengths).
• Finally, we take a technical look at the recent debate over “network neutrality”, which concerns the tussle between content providers and access providers. The increasing penetration of broadband access, faster last-mile links, and the rise of Internet video and peer-to-peer file sharing mean that residential and SOHO (Small Office, Home
Office) users download increasingly more traffic. This traffic is delivered to users by Access Providers (APs). APs earn their revenues mostly from their users, and they incur costs to operate their network and to purchase upstream connectivity from transit providers. A much discussed trend in recent times is that APs are not profitable, as the increasing volume of transit traffic leads to escalating costs, while the intense competition in the access market and the commoditization of Internet access leads to falling prices, typically in the form of a flat monthly fee [43, 50, 84]. On the other hand, content providers (CPs) are often seen as being profitable, which has led to considerable tension between APs and CPs. In this work, we use a simple model to study the possible reasons for the non-profitability of access providers. We evaluate the effectiveness of different pricing and connection strategies that the AP can use to remain profitable. Our results indicate that AP strategies that rely on differential pricing mechanisms or non-neutral behavior (directly charging the largest CPs for better performance) are unlikely to succeed in the face of competition in the access market.
1.0.1 Thesis organization
The rest of this thesis is structured as follows. In chapter 2, we study the evolution of the Internet ecosystem over the last decade, highlighting important trends for the entire Internet and also for individual classes of ASes. In chapter 3, we focus on stub networks and content providers at the edges of the Internet, and present algorithms for these networks to optimize their upstream connectivity. In chapter 4, we propose a model for interdo-main network formation, capturing the effects of topology, traffic, and the peer selection strategies of transit providers at the core of the Internet. We validate the ability of this model to reproduce some of the features observed in the real Internet, and study the effect of various provider and peer selection strategies on the equilibrium internetwork. In chap-ter 5, we approach the recent debate on “network neutrality” from a technical standpoint, focusing on strategies for access providers to remain profitable. We conclude by outlining the contributions of this thesis and proposing directions for future work in chapter 6.
CHAPTER II
MEASURING THE EVOLUTION OF THE INTERNET ECOSYSTEM
2.1 Introduction
The Internet, as a network of Autonomous Systems (ASes), resembles in several ways a natural ecosystem. ASes of different sizes, functions, and business objectives form a number of AS species that interact to jointly form what we know as the global Internet. ASes engage in competitive transit (or customer-provider) relations, and also in symbiotic peering relations1. These relations, which are represented as inter-AS logical links, transfer not only traffic but also economic value between ASes. The Internet AS ecosystem is highly dynamic, experiencing growth (birth of new ASes), rewiring (changes in the connectivity of existing ASes), as well as deaths(of existing ASes). The dynamics of the AS ecosystem are determined both by external “environmental” factors (such as the state of the global economy or the popularity of new Internet applications) and by complex incentives and objectives of each AS. Specifically, ASes attempt to optimize their utility or financial gains by dynamically changing, directly or indirectly, the ASes they interact with. For instance, the objective of a transit provider may be to maximize its profit, and it may approach this goal through competitive pricing and selective peering. The objective of a content provider, on the other hand, may be to have highly reliable Internet access and minimal transit expenses, and it may pursue these goals through aggressive multihoming and an open peering policy.
Our study is motivated by the desire to better understand this complex ecosystem, the behavior of entities that constitute it (ASes), and the nature of interactions between those entities (AS links). How has the Internet ecosystem been growing? Is growth more important than rewiring in terms of the formation of new links? Is the population of
1
We refer to “settlement free interconnection” as a “peering relation” and “paid transit” as a “customer-provider” relation.
transit providers increasing (implying diversification of the transit market) or decreasing (consolidation of the transit market)? Given that the Internet grows in size, does the average AS-path length also increase? Which ASes engage in aggressive multihoming? What is the preferred type of transit provider for AS customers? Which ASes tend to constantly adjust their set of providers? Are there regional differences in how the Internet evolves? These are some of the questions we ask in this part of the thesis.
Understanding the evolution of the Internet ecosystem is important for several reasons. First, we believe that there is a need to develop bottom-up models of Internet topology evolution that capture the complex interactions between the constituent entities. As such, it is necessary to study the differences between the types of ASes that form this ecosystem in terms of business function and incentives. Second, understanding the evolution of the Internet is critical for studying the performance of protocols and applications over time. For instance, to answer the question “How will BGP perform 10 years from now?” we first need to answer the question “How will the Internet look 10 years from now?”. Third, there is much recent interest in generating synthetic AS graphs for simulation and analysis. A study of the evolution of the Internet can provide valuable inputs to such topology generators, such as the types of ASes in the Internet and their topological and behavioral properties over time. Finally, in light of the recent interest in re-designing the Internet with “clean-slate” approaches, it is crucial to understand how the existing Internet has evolved. Doing so could help us identify new architectures and mechanisms that have an intrinsic capability to evolve towards desirable economic, reliability and performance conditions.
There is an extensive literature on AS-level topology measurement and modeling. A large portion of that literature, however, takes a graph-theoretic perspective, viewing all ASes as nodes in a graph and all inter-AS relations as edges, without considering the type of relation (customer-provider versus peering) or the role of the participating ASes (customer versus provider). Viewing all ASes as the same type of node ignores the major differences in the function and objectives of different ASes. Further, even though most of the previous work on AS-level topology modeling mentions the terms ‘evolution” or “dynamics”, the
main focus has been on measurements and modeling of growth, ignoring rewiring. The lat-ter is very important, however, as it represents the attempt of individual ASes to optimize their connectivity. Finally, most of the earlier work on AS-level topologies has focused on macroscopic properties and metrics, such as the degree distribution, the clustering coeffi-cient or the graph diameter, without considering the local policy and semantics of inter-AS relations. The latter are very important as they control the flow of traffic and value in the AS ecosystem.
In this part of the thesis, we attempt to measure and understand the evolution of the Internet ecosystem during the last decade (1998-2007). We propose a method to classify ASes into a number of types depending on their function and business type, using observable topological properties of those ASes. The AS types we consider are large transit providers, small transit providers, content/access/hosting providers, and enterprise networks. We are able to classify ASes into these AS types with an accuracy of 80-85%. We focus on
primary inter-AS links, meaning links that are used under “normal operating conditions”, to distinguish with backup links that appear under failure conditions or routing convergence. We also consider the semantics of inter-AS links, in terms of customer-provider (CP) versus peering (PP) relations, and distinguish between the customer, provider and peering role of an AS in each relation. Unfortunately, we find that the available historical datasets from RouteViews and RIPE are not sufficient to infer the population and evolution of peering links. So we restrict the focus of this study to the evolution of the population of AS types and of customer-provider links.
The rest of this chapter is structured as follows. In Section 2.2, we describe the data collection and filtering methodology. In Section 2.3, we focus on the evolution of the global Internet. In Section 2.4, we present a classification scheme of ASes into four AS types based on their expected business function. Then, we examine the evolution of each AS type at a global scale as well as regionally. In Sections 2.5 and 2.6, we investigate the evolution of customer-provider relations in the Internet, from the perspective of the customer and provider, respectively. In Section 2.7, we present some results on the evolution of the Internet peering ecosystem. These results should be viewed as “conjectures” because of the
limitations in detecting the complete set of peering links. We conclude with a summary of our main findings in Section 2.9.
2.2 Datasets and methodology
A study of the evolution of the Internet ecosystem needs frequent snapshots of the AS-level Internet topology, annotated with policy information for each link. Given that such histor-ical information is not available, we have to rely on measurement and inference, collecting data from multiple sources and considering the limitations of each dataset. This section describes the datasets we use and the subsequent filtering and validation processes.
We collected BGP AS-paths from BGP table dumps obtained from the two major pub-licly available repositories at RouteViews [96] and RIPE [94]. The RouteViews collection process started in November 1997, providing an invaluable resource in the past ten years. The first RIPE collector became active in October 1999. We rely only on these two repos-itories because no other source of topological/routing data (routing registries, traceroutes, looking glass servers, etc.) provides historical information. Note that the use of AS-paths has been shown to be inadequate to expose the complete Internet topology [29, 32, 59]. In particular, even though most ASes are detected, a significant fraction of peering and backup links at the edges of the Internet are missed [26, 59, 111]. In fact, it has been estimated that there are at least 40% more peering links in the Internet than those obtained from AS-paths [26, 32]. We are well informed of these limitations, which are further exposed later in this section. There are, however, three important points to consider. First, we do not aim to detect backup links; instead, we are only interested in primary Internet links, used most of the time (as opposed to backup links that are only used upon failures or over-load conditions). We describe later how to avoid backup links in the data filtering process. Second, the main focus of this evolutionary study is customer-provider links. As we show later in this section, the available monitors from RouteViews and RIPE are not enough to detect all peering links or the births and deaths of those links. Third, even though missing links can be detrimental for complex inference applications (such as AS path prediction or BGP root-cause analysis), it has been shown recently that they are less critical in topology
inference[112].
Filtering of backup and transient links: Next, we describe how to only detect primary links, avoiding backup links and false AS-paths that often appear during BGP convergence. First, note that short-term failures and routing transient events can “confuse” an evolution-ary study, misinterpreting link disappearances and appearances due to transient failures as link deaths and births respectively. For instance, suppose that the primary linklp between AS-x and AS-y fails at time t1, causing the activation of a backup link lb between AS-x and AS-z. lp is repaired at t2 and the connectivity returns to its original state. Since we
focus on primary links, our goal is to ignore the transient event during (t1, t2) and to not
detectlb. On the other hand, a change of routing policy that exchanges the role of links lp and lb (so thatlb becomes the primary link) should be detected as the death of lp and the simultaneous birth of lb.
To achieve the previous objective we follow the “majority filtering” approach described next. Note that a snapshot, in the following discussion, does not refer to a time instant but to a period of 21 days. During a certain snapshot, we collect at N different times the unique AS-paths that are exported from all active RouteViews and RIPE monitors. The period between these successive samples is Ts, with N Ts=21 days. Then, we keep only
those AS-paths that appear in the majority of the samples and ignore the rest. This process is designed to filter out links that appear due to routing transient events, as well as due to “hard” failures of interdomain links (e.g. due to router crashes or fiber cuts). Routing transients typically persist for less than a few hours, while it is reasonable to expect that hard failures are repaired within 10 days. In each of these cases, the majority filtering rule successfully filters out the transient links.2 Note that if a certain link X-Y is used as
primary in one AS path but as backup in another path, it will be included in our snapshot. To select an appropriate value of N, we do the following. We collect all visible AS-paths for each day of January 1998. Next, we divide the month intoN blocks of the same duration, and collect the set of visible AS-paths from a randomly selected instant in each of
2
A similar process was used by Dimitropoulos et al. [40], but considering an AS-path only if it appears inallN samples.
theN blocks. Then, we perform majority filtering, considering only AS-paths that appear in the majority of theN samples. Finally, we measure the number of visible AS links. We varyN from 1 to 10, and repeat the previous process multiple times for each value ofN. As N increases, the average number of visible links decreases (from about 5850 to 5725 during that month) because fewer backup links become visible. Additionally, the variability in the number of visible links decreases. We observe that N=5 results in about the same average as higher values ofN, and reasonably low variance (standard deviation of 12 links). In the rest of this study, N=5 samples.
The trade-off behind the selection of the snapshot duration (21 days in our study) is explained next. If the snapshot duration is too long (say more than a month), then we may miss several birth-death (or death-birth) transitions of the same link. On the other hand, if the snapshot duration is too small (say a few days), then the majority filtering mechanism may not be able to filter out backup links that appear during long-lasting failures such as fiber cuts. Finally, a new snapshot is collected every three months, providing us with 40 snapshots (10 years) from January 1998 to October 2007.
Variations in the number of active monitors: Another issue we need to consider is that the number of BGP monitors in both RouteViews and RIPE has been increasing significantly over the last ten years, from about 10 in 1997 to almost 400 at the end of 2007. The increase in the number of monitors has been less than 20% in 35 out of the 39 pairs of successive snapshots. As the number of monitors increases, some previously existing links may become visible for the first time at a certain snapshot. How do we distinguish those first appearances of existing links from genuine link births? Similarly, sometimes monitors are removed. How do we distinguish between the disappearance of existing links from genuine link deaths? Also, can we bound the estimation error in the number of link births and deaths between each pair of successive snapshots?
To answer the last question we perform the following analysis. Let the set of monitors at snapshots T1 and T2 be M1 and M2 respectively. Let L1 and L2 be the set of links
observed at T1 and T2, respectively. L2 − L1 is the set of new link appearances between
that were genuinely born between T1 and T2, but it may also include an error term that
is the set of links that were present atT1 but became visible atT2 due to the monitor set
increase. To derive an upper bound for the latter, we do the following. First, determine the set of links L′
2 that would be observed at T2 using the set of monitors that were common between M1 and M2, i.e.,M1∩ M2. The setL′2− L1 (where L′2− L1⊆ L2− L1) includes links that were definitely born betweenT1 andT2, and hence it
gives alower boundon the number of actual link births. On the other hand, the number of links in the set (L2− L1)−(L′2− L1) is an upper bound for the error between the estimated
and actual number of link births. So, theworst case relative error(WCRE) in the number of link births between T1 andT2 is:
WCRE = |(L2− L1)| − |(L ′ 2− L1)| |(L′ 2− L1)| (1)
We measured the WCRE for every pair of snapshots. In 30 out of the 39 snapshots pairs, the WCRE is less than 10%. For all but one pair, the WCRE is less than 20%. In the remainder of this paper, we omit the pair of snapshots for which the WCRE was larger than 20% (Jan-Apr 2000). We also measured the WCRE separately for customer-provider (CP) links and peering (PP) links. Unfortunately, the WCRE is very high for peering links and in 9 out of 39 snapshots it is greater than 100%. On the other hand, the WCRE for CP links is quite low, and for all except one pair of snapshots (Jan-Apr 2000), it is less than 10%.3
The previous analysis considers the effect of an increased set of monitors on the mea-surement of link births. A similar problem occurs while measuring link deaths, as some monitors are occasionally disconnected temporarily or permanently from the RouteViews and RIPE collectors. We performed a similar analysis to determine the effect of monitor deaths on the estimated number of link deaths. We find that the WCRE in the estimated number of link deaths is less than 10% for 37 out of the 39 snapshot pairs.
The previous WCRE analysis showed that, even though we can estimate well (within 10%) the link births/deaths of CP links, we do not get a reasonable accuracy for the
3
link births/deaths of PP links. This is a negative but significant result, which should be considered by future studies that rely on RouteViews and RIPE topological data. It also implies that the conclusions of several previous topological studies should be re-examined. Sensitivity of population counts to number of monitors: We next examine the visibility of CP and PP links, as well as of ASes, when we vary the number of used monitors. Consider first the population of ASes. Let nAS be the set of visible ASes if we use all available monitors at a given snapshot. We then randomly select a fractionf of the available monitors, and determine the population of ASes that is visible using that subset of monitors. We repeat this experiment 100 times, and determine for each run the number of ASes visible with a fraction f of the available monitors nAS(f). Figure 1 shows the median, 10th and 90th percentile values of the ratio nAS(f)/nAS for the snapshot Jan 2007, together with the corresponding ratios for the populations of CP links and PP links. We repeated this analysis for all snapshots, and the results are quantitatively similar across time, without any noticeable trends.
Notice that the number of visible ASes is strongly insensitive to the number of available monitors. Even with 10% of the monitors we practically see the same set of ASes that is visible with all monitors. The fraction of CP links is also insensitive to the number of available monitors, as long as we use more than 60-70% of the available monitors in the given snapshot. So, we expect that a 10-20% increase in the number of available monitors across successive snapshots will not cause a significant variation in the number of visible CP links. The situation is very different with PP links however. The fraction of visible PP links increases roughly linearly with the fraction of used monitors. This means that if we had more monitors we would probably see significantly more PP links. So, the estimated population size of PP links should be viewed as lower bound on the actual population size.
Similar observations were recently reported by Oliveira et al. [87].
The previous observations have two major implications. First, on the positive side, it appears that the RouteViews and RIPE historical datasets contain enough monitors to detect the ASes and CP links in a robust manner. Even though we cannot be certain that we see
a large number if we had more monitors. Second, on the negative side,it is clear that the RouteViews and RIPE datasets are not sufficient to detect the population or the birth/death rates of PP links. Consequently, in the rest of the paper we focus on the evolution of CP links. When we present some results for PP links, the reader should recall that those figures are lower bounds on the actual number of PP links.
0.85
0.9
0.95
1
0.1
0.2
0.3
0.4
0.5
0.6
0.7
0.8
0.9
1
fraction seen
ASes
C-P links
0
0.2
0.4
0.6
0.8
1
0.1
0.2
0.3
0.4
0.5
0.6
0.7
0.8
0.9
1
fraction seen
fraction of monitors
P-P links
Figure 1: Visibility of ASes, CP and PP links as a function of the number of monitors used in a snapshot.
Policy inference: After collecting and filtering the data as described earlier, the final data processing step is to use the AS-paths in each snapshot (those that passed the majority fil-tering process) to infer the underlying AS topology and the relationships between adjacent ASes. For this purpose we use the well-tested algorithm described by Gao in [51]. Despite the significant follow-up work on AS relationship inference [40, 101], we prefer Gao’s algo-rithm because of its ability to infer relationships using only observed AS paths, without any additional information such as data from routing registries or active probes. Comparison
studies for the accuracy of related algorithms in [101] and [51] have shown that Gao’s al-gorithm is more accurate in identifying peering relationships. Further, a recent study [112] showed that the AS relationship inferences made by this algorithm are quite stable with respect to variations in the observed AS-paths. Gao’s algorithm results in four types of AS relationships: Customer-Provider (CP), Peering (PP), Sibling, and Unknown. We ignore the last two categories, as they account for less than 2% of the visible links in any snapshot. Finally, the AS topology and relationship matrix provide an annotated graph for each snapshot. The differences between successive snapshots show the evolutionary events of link and node births and deaths, which form the core of the analysis in the following sections. Note that if a certain link has changed role at some snapshot (say from CP to PP), we view that event as the death of a CP link and the simultaneous birth of a PP link between the corresponding ASes. The reader may be wondering about the frequency of link type changes, from CP to PP or the opposite. Even though we cannot answer this question in a definite manner (due to the visibility problem with PP links), we measured that 9% of the PP links in a snapshot become CP links in the next snapshot (This number is the average over all pairs of snapshots). The fraction of CP links that become PP links appears to be much less (1%) but that is probably due to the poor visibility of PP links. Also, these changes are not cumulative, as we run the relationship inference algorithm separately for each snapshot.
2.3 Growth and rewiring trends
We first examine the evolution of some major characteristics of the global Internet.
Growth of ASes and inter-AS links: Figure 2 shows the number of ASes and inter-AS links in each snapshot. Due to the previously discussed issues with measuring PP links, we only count the number of CP links in each snapshot. A first observation is that, despite the economic recession of 2001-03 and the well documented turmoil in the telecom market,
the Internet AS-level topology has been increasing in size over the last ten years. Second, it appears that the Internet has gone through two distinct growth phases so far: an initial phase, up to mid-2001, in which the Internet grew exponentially in terms of the number of
ASes and links(of the formy =a∗ebx). Then, the growth process switched to linear for both the number of ASes and links (of the form y =ax+b). We find that the number of ASes from 1998 to mid-2001 can be modeled asy = 3150∗e0.094x, wherexis the snapshot number (x= 0,1, . . .). In the last six years, the number of ASes can be modeled asy = 2537+604x. Regarding the number of CP links, the corresponding functions are y = 5462∗e0.102x and y = 1499x−35. Each of the previous regression formulae gives a correlation coefficient that is at least 99%. To eliminate the possibility that this trend shift is an artifact of the measurement infrastructure (e.g. the changing set of monitors), we measured the number of visible ASes and CP links with a set of monitors that remained the same in the last ten years. The results, even though revealing a lower number of links, still show a trajectory change from exponential to linear in mid-2001. Huston [61] observed a similar trend shift in the number of ASes (but not CP links) around mid-2001.
To determine the boundary at which the trajectory shifted from exponential to linear, we perform the following test. We assume that the number of CP links and ASes can be modeled as y = a eb x when x ≤ z and y = a x+b when x > z. We then compute the value zmin that minimizes the total sum-of-squares error (SSE) for the above regression formula. zmin is our estimate for the snapshot where the growth trajectory changed from exponential to linear. It appears that the exponential phase lasted for the first 15 snapshots for ASes and 16 snapshots for CP links, ending in mid/late 2001. Figure 2 also shows the exponential and linear regression curves for the number of ASes and CP links.
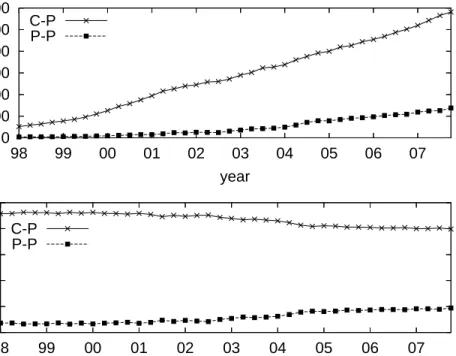
Evolution of CP link count (and lower bound estimates of PP link count): Next, we distinguish between CP and PP links, and examine the growth trends separately for these two link types. We emphasize again that the number of PP links we report here should be viewed as a lower boundon the actual number of peering links. Figure 3 shows the number of CP and PP links, as well as their fractions, over time. Both link types have been increasing in absolute numbers. As shown earlier, the number of CP links shows an initial exponential growth followed by a linear growth after 2001. Modeling the growth of PP links is difficult with the given measurements. It appears, however, that that growth process has followed a different trajectory than that of CP links.
98 99 00 01 02 03 04 05 06 07 time 0 5000 10000 15000 20000 25000 30000 number of ASes number of ASes y=a*exp(b*x) y=a*x+b 98 99 00 01 02 03 04 05 06 07 time 0 10000 20000 30000 40000 50000 60000 number of C-P links number of C-P links y=a*exp(b*x) y=a*x+b
Figure 2: Evolution of the number of ASes and CP links. The regression curves are also shown.
The bottom panel in Figure 3 shows the fraction of CP and PP links. The fraction of PP links has been increasing steadily after 2001, even though the growth rate of CP links is larger than that of PP links. The reason is that the relative increase rate of PP links is larger than that of CP links. Given that we probably underestimate the number of PP links,the fraction of PP links at the end of 2007 is at least 20%.
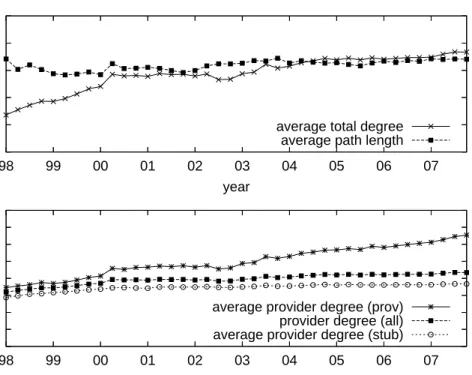
Evolution of AS-path length and multihoming trends: Next, we investigate the evolution of the average AS-path length (after removing AS-path prepending). We do so by calculating the average length of AS-paths observed at Routeviews and RIPE collectors in each snapshot. The upper panel in Figure 4 shows thatthe average path length measured in this manner has remained practically constant (at 4.2 AS hops) over the last 10 years.
Note that the AS-paths measured here are those that are seen by the Routeviews and RIPE vantage points. The path advertisements seen by these monitors are mostly those exported over customer-provider links. Peering links low in the hierarchy can make paths shorter, as they provide shortcuts in end-to-end paths. Those AS-paths, however, would not be seen from the set of vantage points at Routeviews and RIPE. Consequently, what we measure
0 10000 20000 30000 40000 50000 60000 07 06 05 04 03 02 01 00 99 98 number of links year C-P P-P 0 0.2 0.4 0.6 0.8 1 07 06 05 04 03 02 01 00 99 98
fraction of all links
year C-P
P-P
Figure 3: Evolution of CP and PP links in absolute numbers and as a fraction of the total number of links.
may be an overestimation of the AS-path length; the average path length could actually be decreasingover time. This is interesting, given the significant growth of the underlying network. Earlier modeling work, such as the preferential attachment growth model of Albert and Barabasi [10], predicted an average path length that grows slowly with the size of the network (O(ln ln n)), when a newly attached node has at least two edges. Such a growth model would result in an increase in the average path length from 4.2 to 4.7 over the last 10 years, contrary to the constant average path length of 4.2 that we observed.
There are two plausible effects that could lead to constant or decreasing AS-path lengths. The first is the increasing presence of “shortcut” peering links, especially between providers at lower tiers in the hierarchy. Due to the aforementioned visibility problem, however, AS-paths that we measure at Routeviews and RIPE collectors would not show the effect of the increasing number of peering links. Studying the effect of peering links on average path lengths would need more accurate topology data with a good visibility of peering links. The second effect that could lead to constant path lengths is a densification process that
increases the average degree (considering only CP links) of ASes. As most CP links are visible from Routeviews and RIPE monitors, it is possible to measure the densification of the graph of CP links. Indeed, the upper panel of Figure 4 shows that the average AS degree, counting only CP links, has increased consistently over time, from 3.2 links to 4.3 links per AS. The median degree (not shown) is dominated by small networks that have just 1 or 2 providers, and hence it does not show an increasing trend. This densification process has also been studied by Leskovec et al. [72], who observed that the effective diameter4 of the AS graphslowly decreaseswith time.
A plausible explanation for the densification of the Internet is the increasing popularity of multihoming for economic, reliability and performance reasons. The bottom panel of Figure 4 shows the average multihoming degree,5 defined as the number of providers of a given AS, for two broad classes of ASes: stubs (i.e., ASes that never had customers dur-ing their observed lifetime), and non-stubs (the rest of ASes). We find that the average multihoming degree has been increasing in both classes. Non-stubs, however, have been increasing their average multihoming degree much faster than stubs (from 1.5 to about 3.5), in particular after 2003. This may be because non-stubs, which are typically con-tent/access/hosting/transit providers, attempt to optimize their connectivity, and at the same time improve their reliability, by multihoming to several upstream transit providers. For many stubs, on the other hand, one or two (primary) transit providers is often enough. Growth versus rewiring: Next, we seek to understand the relative significance ofgrowth versus rewiring. Growth refers to the addition of new ASes in the network (together with their corresponding links), while rewiring refers to changes in the connectivity of existing ASes. Specifically, we focus on the number of CP link births due to AS births (growth) versus CP link births due to rewiring. We also look at the number of CP link deaths due to AS deaths versus CP link deaths due to rewiring. The top panel of figure 5 shows, for each pair of snapshots, the number of CP link births due to AS births and due to rewiring. Initially, the CP link births due to AS births and rewiring were comparable in
4
The effective diameter of a graph is the minimum value ofd such that at least 90% of the connected node-pairs are at distance at mostd. A smoothed version of this metric is used in [72].
5
2.5 3 3.5 4 4.5 5 07 06 05 04 03 02 01 00 99 98 total degree year
average total degree average path length
0 0.5 1 1.5 2 2.5 3 3.5 4 07 06 05 04 03 02 01 00 99 98 multihoming degree year
average provider degree (prov) provider degree (all) average provider degree (stub)
Figure 4: Evolution of average AS degree, AS-path length, and multihoming degree.
number. Since 2001, however, we find that the number of CP link births due to internal rewiring has increased much faster than that due to AS birth. Currently, around 75% of link births are associated with existing ASes (rewiring). A similar analysis, shown in the bottom panel, shows that the number of CP link deaths due to rewiring is significantly higher than that due to AS deaths. About 80% of the link deaths are due to rewiring and this fraction is increasing. These observations are important for two reasons. First, most of the literature on AS topology modeling has focused on growth, ignoring rewiring. Second, rewiring represents the effort of individual ASes to optimize their performance, reliability, profitability or other objectives. An intriguing possibility is that rewiring implies that the Internet, as a multi-agent and self-organized system, attempts to optimize a certain, still unknown, global objective in a distributed manner. This possibility has also been discussed by Chang et al. [24].
Given the increasing significance of rewiring, we next focus on the births and deaths of links between existing nodes in two successive snapshots. LetG1 and G2 be the graphs
0 1000 2000 3000 4000 5000 6000 07 06 05 04 03 02 01 00 99 98
number of link births
year rewiring AS birth 0 1000 2000 3000 4000 5000 6000 07 06 05 04 03 02 01 00 99 98
number of link deaths
year rewiring
AS death
Figure 5: Evolution of the number of CP link births (and deaths) due to node births (and deaths) versus rewiring.
G1 by removing all nodes that are not present inG2; similarly constructG′2 fromG2. Note
thatG′
1 andG′2 have the same set of nodes. LetE1′ andE′2be the set of links inG′1 andG′2
respectively. We use the following graph-level metric, referred to asJaccard Distance, to quantify the rewiring between G′1 and G′2.
s(E1′, E2′) = |(E ′ 1−E2′)∪(E2′ −E1′)| |E′ 1∪E2′| (2)
Note thats(E1′, E2′) captures both link births and deaths between the two snapshots. The Jaccard distance thus quantifies the difference between the sets of links in two consecutive snapshots. For example, a Jaccard distance of 0.5 indicates that 50% of the links seen in the two snapshots were either born before the second snapshot or died after the first.
We calculate the Jaccard distance separately, first, on the CP graph where the customer is a stub, and second, on the CP graph where the customer is a non-stub. Figure 6 shows these metrics for each pair of snapshots over the last 10 years. We find that the Jaccard distance is much smaller for the CP graph where the customer is a stub, as compared to the CP graph where the customer is a non-stub. This indicates that non-stubs have
consistently been more aggressive than stubs in changing their upstream connectivity. We further investigate this effect after proposing a finer classification of AS types in the Internet in the next section.
0 0.05 0.1 0.15 0.2 0.25 0.3 0.35 07 06 05 04 03 02 01 00 99 98 Jaccard distance year stubs non-stubs
Figure 6: The Jaccard distance for CP links where the customer is stub versus non-stub.
2.4 Evolution of AS types
When we think of the Internet as a graph, it is important to recognize that not all nodes are the same. ASes connect to the Internet with different requirements and business interests, and hence optimize their connectivity in different ways [43]. The topology changes that we observe represent the outcome of a complex multi-constraint optimization process that individual ASes conduct.
AS classification scheme: We propose a simple classification scheme for ASes according to their business type. The initial classification consists of the following five AS types.
Enterprise Customers (EC) represent various organizations, universities and com-panies at the network edge that are mostly users, rather than providers of Internet access, transit or content. Typically, ECs do not have AS customers.
Small Transit Providers (STP) are often regional ISPs that provide Internet access and transit services. STPs aim to maximize their customer base in their geographical area and to reduce their upstream transit costs through selective peering with other regional ISPs. STPs often peer selectively rather than openly to avoid peering with ASes already in their customer tree, or ASes that are likely to become customers at a future time. We count national and academic/research transit networks also as STPs.
Large Transit Providers (LTP)are international ISPs with a large footprint, both in terms of number of AS customers and geographical presence. LTPs aim to maximize their customer base, peering with other ASes only when it is necessary to maintain reachability (restrictive peering).
Access/Hosting Providers (AHP) are ISPs that offer Internet access (e.g., DSL, cable modem, dial-up, leased lines) and/or server hosting. Their access customers can be residential users or enterprises that do not have AS numbers, while their server hosting customers are content/service providers that also do not have AS numbers6. AHPs often engage in selective peering to minimize the transit costs paid to their upstream providers.
Content Providers (CP) are not in the business of offering Internet transit or ac-cess. Instead, their revenues result from providing content that users pay for. CPs aim to minimize transit costs, and so often have open peeringpolicies.
Similar classifications have been proposed in previous work. Chang et al. [28] classified ASes (for the purposes of determining interdomain traffic matrices) into “web hosting”, “residential access” and “business access”. Dimitropoulos et al. [41] classified ASes into large and small ISPs, customer networks, universities, Internet exchange points and network information centers. We chose the previous five AS types based on the terminology used in discussions on the NANOG mailing list and in W. Norton’s white papers [84].
Note that the difference between LTPs and STPs is quantitative, as both AS types have the same business function. LTPs are basically the major ISPs that are often referred to, rather informally, as “‘tier-1” transit providers. The “tier-1” label is often associated with
6
A limitation of AS topologies derived from BGP tables is that they include only the organizations that have AS numbers.
10-20 ASes. We choose to be more inclusive, defining as LTPsthe top-30 ASes in terms of the average number of customers during the time period in which an AS was seen in the last decade. That average is larger than 140 AS customers for the LTPs in our datasets.
This leaves us with around 27,000 ASes (in the latest snapshot) that cannot be classified manually. Instead, we first pick a training set of 50 ASes for each of the remaining four AS types (EC, STP, AHP and CP) that are definitely of the corresponding type (based on information obtained from their webpages). For ECs, we pick well-known universities and corporations. For STPs, we choose transit providers that are mostly regional in terms of their coverage and customer size. For CPs and AHPs, we pick well-known content providers, hosting sites, and large broadband/dial-up residential/business access ISPs. Next, we ob-serve the topological properties of the ASes in each training set, in terms of the average
number of customersC, providersP, and peersRfor that AS in the last decade. We found significant overlap in the number of providers among the four AS types, and so we do not rely on that metric. On the other hand, the number of customers and peers (C, R) allows us to distinguish between ECs, STPs and CPs. Unfortunately, we are unable to distinguish CPs from AHPs. These two AS types, even though have different business roles, largely overlap in terms of bothC andR. So, in the rest of the paper we merge these two AS types in what will be referred to asContent/Access/Hosting Providers (CAHPs). Figure 7 shows the average number of customers and peers for ASes in the four training sets. Most ECs have zero customers and peers, and they are not shown in this graph.
The next step is to determine a set of boundaries in the two-dimensional (C, R) space that separate the training sets of the four AS types with the minimum number of misclas-sifications. We apply the well known machine learning technique of decision trees on the training samples to obtain the following C and R coordinate boundaries for each AS type:
EC:C <2.1, R <= 1
STP: 2.1≤C < 140, R <3.5 and 33.1 ≤C < 140, R≥3.5 LTP: C ≥140
1 2 10 25 140 1000
customer degree
1 5 10 100peer degree
EC STP CAHP LTPCAHP
EC
STP
LTP
Figure 7: Coordinate boundaries for the four AS types we consider.
Based on the previous boundaries, we next use the average C and R values of each AS (measured over the snapshots in which that AS was present in the ten-year dataset) to classify it into one of the four AS types. Note that the AS types we consider are quite distinct from each other in terms of their function and business goals. It is thus reasonable to expect that ASes do not change from one AS type to another during their lifetime. To examine this hypothesis, we performed the following test. We rerun the decision tree algorithm to classify each AS using a two-year dataset from 2006 and 2007. We then compared this more recent classification with that based on the ten-year dataset. We found that only 3% of the ASes that appear in both datasets were classified differently. In most of these cases, it appears that the classification change was due to a large shift in the customer and peer degrees of that AS. For example, AS-1 has a large average customer degree over the ten-year dataset and is classified as an LTP. However, in the two-year dataset it has a customer degree of 0, and is classified as an EC. AS1 was originally owned by Genuity Inc., a large global ISP. In 2004, Genuity sold AS-1 to Level3 Communications, also a global ISP. Level3 does not use that AS number for its transit services, and this is why that AS has no customers in the last couple of years.
We select a random sample of 150 ASes (50 ECs, 50 STPs and 50 CAHPs), and mix these samples to remove any information about the classification of these ASes (to avoid any subjective bias in the validation process). Then, we use information from WHOIS servers and the webpages of those ASes to infer their main business function. If the actual business function does not match the classification produced by our algorithm, we count that AS as a misclassification. We find that the classification accuracy for ECs is 78%. The errors in this category are due to some residential access providers that are classified as ECs because they have no AS customers and no peers. The accuracy for STPs is 86%. The errors here are due to ASes that mainly offer content hosting services. These providers have few AS customers and a small number (or none) of peers and hence they get classified as STPs. The classification accuracy for CAHPs is 86%. The errors in this case are mostly due to some academic/research backbones that get classified as CAHPs due to their large number of peers. Dimitropoulos et al. [41] reported a similar accuracy figure (78%) for their AS classification scheme.
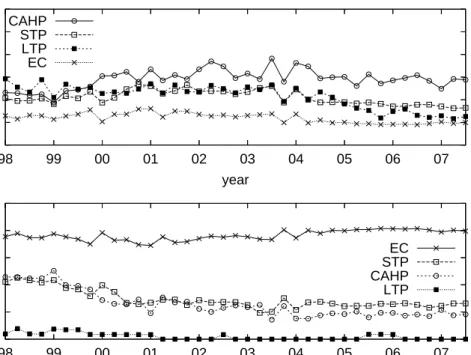
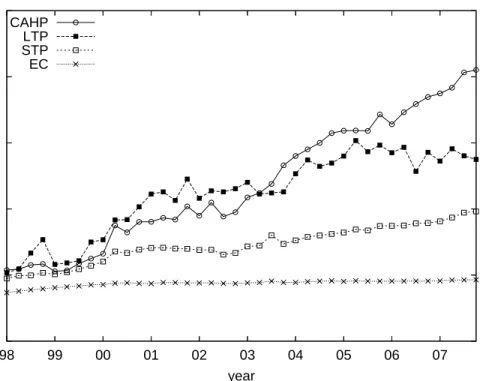
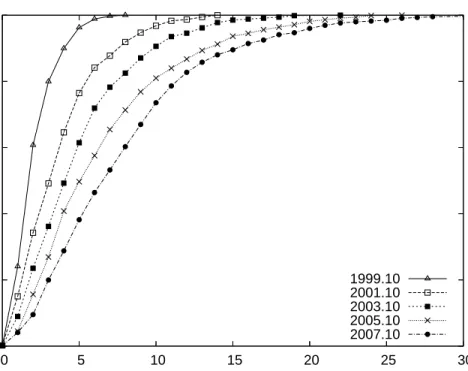
Population trends for each AS type: Figure 8 shows the population of each AS type over the last ten years. These curves show two distinct phases, similar to the global growth trends observed in Section 2.3, with a change of slope around 2001. The STP population shows a small growth rate (increase by factor of 1.23 over the last six years). The LTP population remains almost 30 by definition. The EC population shows a strong growth trend (increase by factor of 2.33 in the last six years), contributing most of the growth in the number of ASes. The CAHP population, even though much smaller in absolute numbers than ECs, has also been growing significantly (increase by factor of 1.6 in the last six years). ECs and CAHPs represent the periphery of the network, where the users and content reside. If we judge by the population of this AS type, the Internet edge grows at a significant and stable pace. On the other hand, LTPs and STPs represent the core of the Internet. Even though the STP population was growing significantly before 2001, their growth rate in the last few years has decreased. This may be an indication that the number of transit providers is stabilizing.