https://doi.org/10.1007/s00193-017-0780-2 O R I G I NA L A RT I C L E
Control of a Mach reflection-induced interaction using an array
of vane-type vortex generators
S. B. Verma1 · C. Manisankar1
Received: 28 June 2017 / Revised: 6 October 2017 / Accepted: 3 November 2017 / Published online: 24 November 2017 © Springer-Verlag GmbH Germany, part of Springer Nature 2017
Abstract An experimental investigation was conducted to control a Mach reflection (MR)-induced flow separation in a Mach 2.05 flow using a 18◦shock generator (SG). The study was extended to four SG exit heights(g/w)of 0.87, 0.81, 0.725, and 0.66 primarily to study its effect on the extent of flow separation as well as on Mach stem height, with and without control. Two vane-type vortex generator con-figurations, namely the ramp vane (RV) with device heights h/δ=0.3,0.5,0.8, and 1.0 and the rectangular vane (RRV) with h/δ = 0.3 and 0.5, were studied for control. Each control device array was implemented 10δ upstream of the separation location for no control. For stable MR interactions (i.e.,g/w=0.87,0.81), the extent of separation and the reat-tachment shock strength are seen to decrease with increase in RV height (withh/δ =1.0 device showing 17% reduction). However, for unstable MR condition (i.e.,g/w=0.725), RV devices ofh/δ=0.8 and 1.0 become ineffective. The RRV2 device (h/δ=0.5), on the other hand, was found to be more effective in reducing the extent of separation in both the stable (31%) and unstable (24%) MR conditions. The effectiveness of each control device is also accompanied with an increase in height of the Mach stem. This is, however, not seen as a serious limitation since in such strong interactions it is more important to prevent or avert an intake unstart condition. The separation shock unsteadiness or theσmax/Pwvalue, on the
Communicated by C.-Y. Wen and A. Higgins.
B
S. B. Verma [email protected] C. Manisankar [email protected]1 Experimental Aerodynamics Division, National Aerospace
Laboratories, Council of Scientific and Industrial Research (CSIR), Bangalore 560017, India
other hand, is seen to increase considerably with controls and seems to be almost independent forh/δ≥0.5.
Keywords Mach reflection·Flow separation·Mach stem· Shock strength·Vane-type control device
1 Introduction
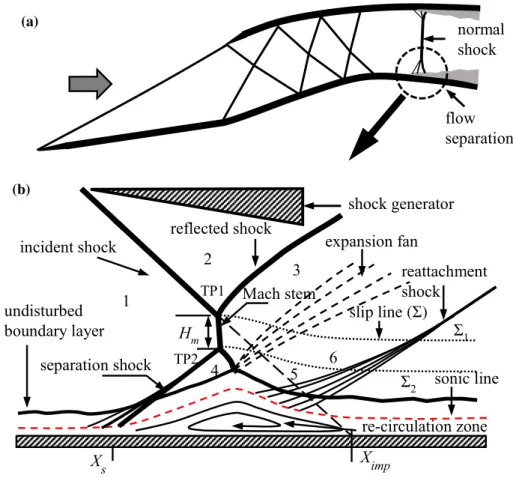
In supersonic intakes, the oncoming air is compressed through a system of oblique shock waves and is finally decelerated to subsonic velocities through a near-normal ter-minating shock, Fig.1a. The upstream Mach number to such near-normal terminating shocks may range from 1.3 to 2 depending on the constraints imposed by the overall sys-tem size that limits the compression achievable through these series of oblique shocks [1]. Not only do such strong inter-actions increase the stagnation pressure loss that affects the inlet performance but can also cause large areas of flow sepa-ration upstream of the subsonic diffuser, thereby introducing flow distortions that degrade the engine performance. At cer-tain off-design operating conditions, the situation can further worsen causing the terminating shock to travel upstream, leading to intake unstart. Additionally, the shock unsteadi-ness associated with such interactions [2,3] can contribute toward fatigue failure in supersonic inlets [4] and introduce dynamic loads on the engine [1]. As a result, it is imperative to use flow control techniques so as to alleviate or dimin-ish the adverse effects of such interactions and the problems associated with them. Figure 1b shows the schematic of a Mach reflection (MR or Edney type II interference)-induced interaction initiated by an incident shock. As can be seen, a near-normal shock, or a Mach stem, is formed between the two triple points TP1 and TP2, the height (Hm)of which is controlled by the strength of the interaction. It would be
Fig. 1 Schematics showing
athe SWBLI in supersonic intakes andbimportant flow features MR-induced shock-wave/boundary-layer interaction.Ximp—incident
shock impingement location, Xs—separation location
undisturbed
boundary layer
incident shock
separation shock
reflected shock
expansion fan
re-circulation zone
reattachment
shock
sonic line
Mach stem
slip line (
Σ
)
TP1 TP2H
mX
impX
s (b)1
2
3
6
5
Σ
1Σ
2shock generator
(a)normal
shock
flow
separation
4
worthwhile to note that while the separation bubble in such interactions presents itself as an aerodynamic blockage to the oncoming flow, the presence of strong shocks, on the other hand, results in loss of pressure recovery and adds to the wave drag. The idea of modifying or controlling such an interaction therefore relies on minimizing or mitigating these adverse effects for enhanced performance.
Flow control techniques are broadly categorized into two classes, namely shock control and boundary-layer manip-ulation. The former approach uses techniques to weaken the near-normal shock by splitting it into weaker shocks such as a lambda shock structure pattern primarily to reduce the total pressure losses and hence the wave drag. These include use of porous cavities [5] and shock control bumps (SCB) (two-dimensional [5,6] or three-dimensional [7–11] in configuration). The latter, on the other hand, works toward adding momentum to the near-wall region to ener-gize the boundary layer so that it is able to sustain relatively higher adverse pressure gradients and hence delay or avoid separation. Various methods to achieve this include blow-ing [12,13], suction [14,15] or natural bleed [16], and vortex generator (VG) devices [17–22]. The VG devices maybe fur-ther subdivided into active or passive based on the approach used. For example, synthetic jets [23–25], plasma jets [26– 28], steady jets [29–31], and pulsed jets [26,27,32] fall
into the category of active VG devices, while mechanical VG devices such as vane-type [19,21,22,33–40] and delta ramps [17–22,36,38–40] come under the passive control cat-egory. The working principle of these devices is through the generation of streamwise vortices (co- or counter-rotating) to improve the overall structure of the incoming boundary layer. A detailed comprehensive view of the various control techniques, both active and passive, that have been used to control supersonic shock-wave/boundary-layer interactions (SWBLI) can be found in [41]. Past studies also report that although the active devices have the added flexibility to switch on and off on-demand [29], suppress specific flow frequencies [41] and reduce device drag when not in use, the system cost and the complexities associated with them makes it difficult to implement and maintain [22]. The mechanical devices, on the other hand, are low cost, simple, and rugged in design [36,37,42] making them potential candidates for use as flow control devices in air intakes. However, the par-asitic drag associated with them can be a disadvantage [43]. From this perspective, the sub-boundary layer or micro-VGs (h/δ < 1) are preferable. The primary advantage of these micro-VGs is that the vortices generated from them remain in the boundary layer over larger streamwise distances improv-ing their effectiveness compared to the conventional VGs (h/δ >1). More recent studies have further revealed [36,37]
460 310 130 g w=80 L1=160 L2=180 flow k1 k12 P1 P12 P25
dummy insert VG insert
trip
110
leading edge section base plate section
X Y 17 9 k13 VG array G (a) (b)
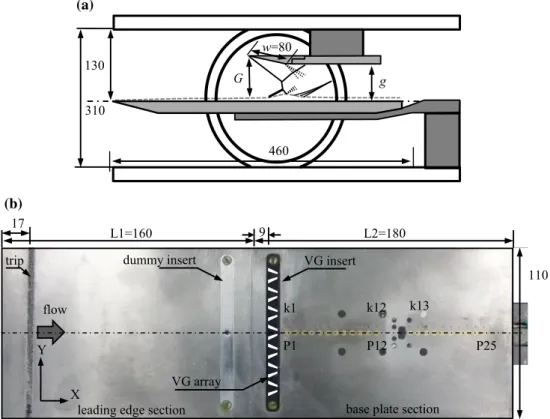
Fig. 2 Test model detailsaschematic of the experimental setup andbflat-plate model details with the pressure sensors and VG insert locations. All dimensions are in mm
that for a given device configuration the overall flow features and the momentum added to near-wall region scales linearly with device height. This means that a larger-sized control device is more effective in stabilizing the interaction than a smaller one.
Most of the previous studies using mechanical VGs have been either in the subsonic [19,21,35] or transonic [5,17,22, 36,37] regimes. A few experimental studies have also been reported in supersonic interactions but mostly using micro-ramps of Anderson configuration [18,20,42,44–46]. More recently, an experimental study has been reported by Verma and Manisankar [38] to assess and compare the effective-ness of various VG configurations in controlling a regular reflection (RR)-induced interaction. With regard to control of normal shock-induced interactions, most of the earlier reported computational [36,37] and experimental [39,40] studies have been in the transonic regime. These studies were conducted to control the near-normal shock-induced interactions with relevance to flow conditions on transonic wings and those prevalent upstream of the diffuser section in intakes. With regard to the latter, the Mach numbers encoun-tered are higher and generally in the range of 1.3–2.0 [1]. It was therefore decided to study the control of a Mach reflec-tion (MR)-induced separareflec-tion at Mach 2.0. A similar such study [47] was earlier reported by the present authors but for various VG devices ofh/δ=0.3 and for only one
non-dimensional shock generator exit height g/w of 1.4. Here the dimensiong is the SG exit height andwthe SG ramp length, as shown in Fig.2a. However, the height effect (h/δ) for the ramp vane (RV) devices and variation ing/wwas not studied. The latter approach helps to study the beginning or initial stages of intake unstart conditions wherein the extent of the separation bubble begins to increase with the sepa-ration point moving rapidly forward. Keeping this in view, the objective of the present investigation was focussed (i) to study the effect of four g/w values (0.87, 0.81, 0.725, 0.66) on the extent of flow separation as well as on Mach stem height and (ii) to attempt controlling the above inter-actions using two vane-type vortex generator configurations, namely the RV and the rectangular vane (RRV) type. These objectives were primarily chosen with the intention to study whether the control effectiveness at higherg/wvalues will still hold in much stronger interactions as well.
2 Experimental setup and procedure
2.1 Wind tunnel facility and model detailsAn experimental investigation was conducted in the 0.46 m × 0.31-m blowdown trisonic wind tunnel at the National Aerospace Laboratories (NAL) in India to study
K13 K12 1stpressure plateau undisturbed boundary layer 2ndpressure plateau (b) X/L Pw /P 0.55 0.6 0.65 0.7 0.75 0.8 0.85 0.9 0.95 0.5 1 1.5 2 2.5 3 3.5 4 centreline Y = 5mm 0.61 0.66 0.71 0.76 0.81 0.86 0.91 0.56 (a) expansion fan separation bubble incident shock re-attachment shock reflected shock separation shock 0.96 ∝
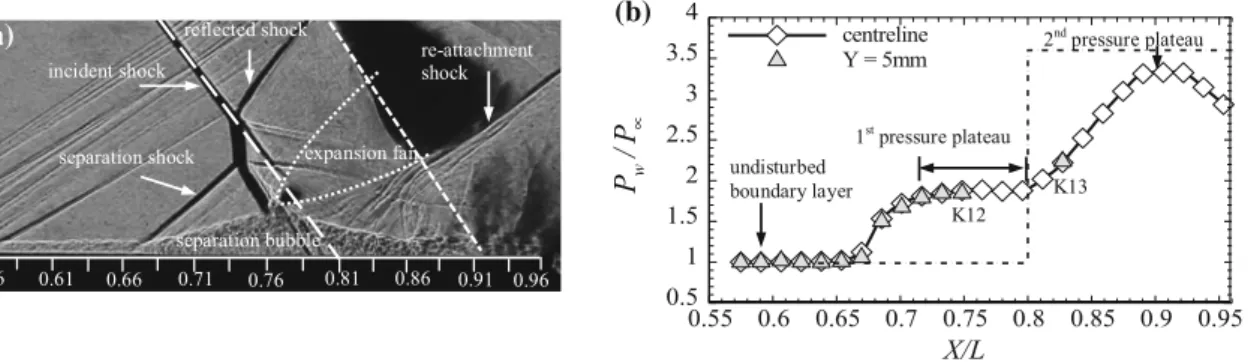
Fig. 3 Plot showingathe schlieren image of the Mach reflection-induced interaction andbthe associated streamwise mean pressure distribution; no control,X/δ=10,g/w= 0.81
control of Mach reflection-induced boundary-layer inter-action using vane-type VG devices. The freestream Mach number and the unit Reynolds number (Re/L) for all the tests was 2.05±0.02 (U∞=523 m/s) and 25 ×106m−1, respectively. For all the tests, the wind tunnel operating stag-nation pressure(P0)was within the range of 208.5 kPa±2% (absolute) and for temperature (T0) within 298 K±0.4%. The wall temperature was assumed adiabatic, and the tur-bulence levels in the tunnel were approximately 0.2% (% Cprms). The test model was a sting-supported flat-plate setup mounted along the tunnel centerline as shown in Fig.2a. An 18◦shock generator (SG) wedge of 220 mm width(2b)and SG ramp length(w)of 80 mm was mounted on the tunnel top wall to generate a shock wave(β =49.78◦)that impinged on the flat plate below to initiate the MR interaction, Fig.2a. The Reynolds number (Rex)based on the flat-plate length up to the VG insert was 4.26 ×10⁶. A boundary-layer trip made of 60-grit carborundum particles and of length 4 mm was placed 17 mm from the leading edge to ensure a turbu-lent boundary layer. For mean pressure(Pw)measurements using electronic pressure scanners (ESP), a total of 25 ports (P1–P25) are available along the plate centerline to capture the entire interaction. However, for unsteady pressure mea-surements, only 13 Kulite pressure transducers have been provided primarily to capture the flow details in the vicinity of the separation region. As a consequence of this, the rms values defined asσ = n i=0 Pwi−Pw2
(n−1) are available only for these locations. It may also be noted that these pressure ports are located 5 mm off the centerline, as shown in Fig.2b, which corresponds to device off-center location of almost 100% span.
With the present setup, independent tests were conducted for fourg/wvalues of 0.87, 0.81, 0.725, and 0.66. This cor-responds to an inlet aspect ratio(b/G)range of 1.22–1.5, respectively, which is free from wedge three-dimensional effects [48]. Here,b is the spanwise half-width of the SG andGis the SG inlet height (Fig.2b). Figure3a, b shows the schlieren image for a no-control case withg/w= 0.81 and
its associated mean pressure distribution, respectively. The inviscid pressure ratio for this interaction is 3.6. It can be seen that despite the difference in their spanwise locations, the Kulite and ESP pressure distributions show a similar pres-sure rise across the interaction on either side of the centerline indicating a straight separation line in spanwise direction. However, due to the finite spanwise extent of the flat plate, three-dimensional effects do influence the interaction but only toward the outer edges of the flat plate. Keeping this in mind, it may be emphasized that the discussion of the results in this paper will be limited only to that finite region of the flow about the centerline where the separation line was seen to be straight in the surface oil pictures (not shown) for no control. It may further be noted that no side fences were used on the plate sides in order to facilitate schlieren imaging.
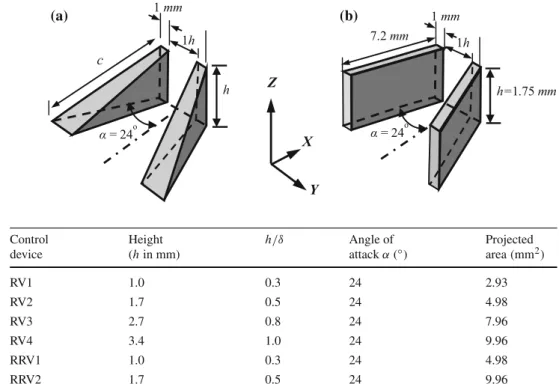
Two types of control device configurations, namely an array of the RV and RRV, were investigated (Fig.4). Table1 shows the designations used for the control devices in the present paper based on their configuration and device height. For both the VG configurations, an inter-device spacing (center-to-center) ofs = 12 mm and an inter-vane spacing of 1his maintained for all device heights resulting in an array of seven control devices for each configuration. The middle VG for each array was centered onY = 0 mm (Fig.2b). The boundary-layer thickness(δ)as estimated from the schlieren images was found to be approximately 3.4 ± 0.04 mm just upstream of the separation for no control. The boundary-layer thickness was also estimated based on length Reynolds num-ber Rexfor turbulent flows (3.48 mm) with a corrected value of (3.56 mm) for compressible flows as suggested by Van Driest [49]. However, such an estimate may differ from the boundary-layer thickness calculated from velocity profile by 3% [50]. For no control, the mean skin friction coefficientcf, after correction for turbulent flows [49], is 2.8 × 10⁻³and the shape factor is 1.3. While the ramped triangular vane was studied for various device heightsh/δ =0.3,0.5,0.8, and 1.0, respectively, the rectangular vane device was tested for onlyh/δ =0.3 and 0.5. An array of each of these control devices was implemented at 10δ upstream of the
separa-Fig. 4 Schematics of the vane-type control
configurations.aRamp vane (h/δ=0.3,0.5,0.8,1.0) and brectangular vane (h/δ=0.5) Z Y X h 1mm α= 24o 1h c h=1.75 mm 1mm α= 24o 1h 7.2mm (a) (b)
Table 1 Details and designations for each control device pair Control device Height (hin mm) h/δ Angle of attackα(◦) Projected area(mm2) RV1 1.0 0.3 24 2.93 RV2 1.7 0.5 24 4.98 RV3 2.7 0.8 24 7.96 RV4 3.4 1.0 24 9.96 RRV1 1.0 0.3 24 4.98 RRV2 1.7 0.5 24 9.96
tion location for no control. Both off- and on-surface flow visualizations were undertaken. Still schlieren images of the flowfield were obtained using a Z-type schlieren setup with a vertical knife arrangement and using a Nikon D1x digi-tal SLR camera with a 300-mm lens and exposure time of 125µs. The setup used 3.0-m-focal-length spherical mirrors to collimate and refocus the illumination source at the knife-edge location. A Palflash 501 was used as the light source with spark duration set at 100µs. Surface flow topologies with and without control were studied using the conventional surface oil pigment mixture comprised of titanium dioxide powder, vacuum pump oil, and oleic acid.
2.2 Experimental accuracy
The tunnel stagnation pressure, Po, was acquired using a DRUCK 4010 series pressure transducer of 1379 kPa range with±0.1% of full-scale accuracy, while the static pres-sure meapres-surements such as pwor surface wall pressure and p∞or freestream pressure were acquired using ESP scan-ners of 206.8 kPa range with±0.04% of full-scale accuracy. The pressure transducers were calibrated using a five-point calibration procedure before the start of the experiments. Fur-ther, a single-point check calibration was performed each day to check for any drift in error. The uncertainties in the pressure measurements were estimated using a statis-tical approach based on repeatability tests. The estimated uncertainty in measurement of total pressure was±1.4 kPa and that for static pressure measurements was± 0.7 kPa. The Kulite transducers for unsteady pressure measurements
were calibrated statically, and the uncertainty obtained from calibration was found to be within±1% of full scale. How-ever, in the intermittent region of separation that is associated with high levels of flow unsteadiness, the average pressure uncertainty is likely to be somewhat greater. The repeatabil-ity of the rms values in the interaction region was found to be roughly within±0.04.
2.3 Signal conditioning and data acquisition system The mean static pressure on the flat plate was measured using Pressure Systems ESP-16HD 16-port scanners. These scanners were calibrated in situ using a Druck calibrator Model DPI-610. An eight-channel signal conditioner module (SCXI-1520) from National Instruments was used for acqui-sition of the analog signals from the pressure scanners. The analog signals were then digitized using a channel 16-bit A/D card (NI-6036) that has a maximum sampling rate of 200 kS/s. The present data were acquired at 500 Hz, with 500 samples taken for each port location. This resulted in an aver-aging time of 1 s. The unsteady pressure data were measured using 13 fast piezo-resistive Kulite model XCQ-093 M-screen (pressure range 170 kPa) transducers. The presence of the protective screen limited the frequency response of these transducers to 50 kHz. The Kulite transducers had a pressure sensitive area of 0.071 cm and an outer casing diameter of 0.26 cm. The transducers were not flush mounted on the base plate. Instead, a small orifice (of 1 mm length and 0.5 mm diameter) connected the transducer to the flow. According to the manufacturer’s specifications, these transducers have a
natural frequency of approximately 250 kHz. The sensitivity of the transducers is typically 0.4–0.6 mV/kPa. These trans-ducers were calibrated statically. The transducer data were acquired using truly simultaneous acquisition card NI4495 DC series (with 24-bit resolution) at a sampling frequency of 50 kHz. Each sensor was powered by DC power sup-ply, and the signal was passed through an amplifier and a signal conditioner. A low-pass filter of 20 kHz was applied post-acquisition during data processing. For each transducer channel, 200 records of 4096 were acquired yielding a total of 819,200 data points per channel per tunnel run.
3 Results and discussion
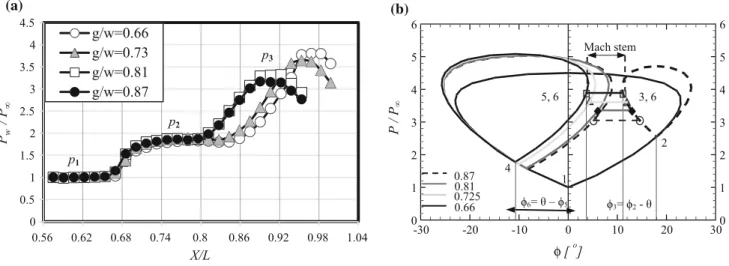
3.1 No controlIndependent tests were initially conducted for no-control case for four SG exit heights org/wvalues. To achieve this, each time the shock generator was lowered to reduce theg/w value, and it was appropriately moved back so as to ensure that the separation location remains the same, i.e.,X/δ=10. Figure5shows the set of schlieren images for the threeg/w values of 0.87, 0.81, and 0.725, respectively. Figure6on the other hand shows the corresponding mean pressure distribu-tions and the associated shock polars. The flow condidistribu-tions on the shock polar represented by numbers 1–5 are shown in Fig.1b. The non-dimensional Mach stem height (Hm/w)and the shock strengths (P/p1—separation shock, P/p2— reattachment shock) are extracted from Figs. 5 and 6, respectively and plotted in Fig.7a, b for comparison. Here, Hmis the Mach stem height (as defined in Fig.1b) andPis the shock strength defined as(p2−p1)and (p3−p2) for sep-aration and reattachment shocks, respectively, as shown in Fig.6a. TheS/wvalues, which correspond to the distance between the physical separation and reattachment locations, are extracted from the surface oil tests. While the strength of both the separation and reattachment shocks is seen to remain almost similar forg/wof 0.87 and 0.81, it shows a significant increase in its values with further decrease ing/w(Fig.7a). This indicates that the interaction becomes much stronger for g/wvalues of 0.725 and 0.66 (as is also seen in the shock polars shown in Fig.6b) which results in a significant increase in extent of separation. In Fig.6b, the polar 1–2 represents the pressure riseP/P∞experienced by an incident shock in aM = 2.05 flow after undergoing a flow deflection of 18o. Point 2 on it marks the origin of the reflected shock polar 2-3-2. On the other hand, the polar 1–4 represents the pressure rise achieved through the separation shock and the result-ing flow deflection experienced due to the separation bubble located at the origin of the reflected shock polar 4-5-4. The states 3, 6 and 5, 6 represent the flow condition downstream of each of the two triple points TP1 and TP2. The gap between
0.61 0.67 0.73 0.79 0.85 0.91 0.97 0.55 (b) g/w=0.81 0.61 0.67 0.73 0.79 0.85 0.91 0.97 0.55 (c) g/w=0.725 0.61 0.67 0.73 0.79 0.85 0.91 0.97 0.55 (a) g/w=0.87 separation shock reattachment shock Mach stem incident shock shock generator slip line separation shock reattachment shock Mach stem incident shock shock generator slip line separation shock reattachment shock Mach stem incident shock shock generator slip line reflected shock reflected shock reflected shock
Fig. 5 Schlieren images showing the effect of variation ing/won the flow structure associated with Mach reflection in the present test setup
the states 5, 6 and 3, 6 represents a strong solution regime or the presence of a Mach stem. Figure7b also shows that there is only a small change in values ofHm/wandS/w in going from g/wof 0.87–0.81. However, the increase in these values is significant for the interactions withg/wof 0.725 (Fig.5c) and 0.66 (schlieren image not shown) which shows the highest. The large increase in Hm/wandS/w values simulates the beginning of the intake unstart condition wherein the separation location is driven upstream and out of the intake. It may, however, be pointed out that forg/wof 0.66, since the separation front moved significantly forward and up to the VG insert location, the control studies for it
1 0.87 0.81 0.725 0.66 0 0.5 1 1.5 2 2.5 3 3.5 4 4.5 0.56 0.62 0.68 0.74 0.8 0.86 0.92 0.98 1.04 Pw / P∞ X/L g/w=0.66 g/w=0.73 g/w=0.81 g/w=0.87 (a) p2 p1 p3 φ[o] -30 -20 -10 0 10 20 30 0 0 1 1 2 2 3 3 4 4 5 5 6 6 4 2 3, 6 ϕ6= θ – ϕ5 ϕ3= ϕ2- θ 5, 6 (b) P / P ∞ Mach stem
Fig. 6 Variation inathe streamwise mean pressure distribution andbthe associated shock polars with choice of regions 1–6 as defined in Fig.1b; no-control case for fourg/wvalues
g / w 0.6 0.65 0.7 0.75 0.8 0.85 0.9 0.95 0 0.2 0.4 0.6 0.8 1 1.2 1.4 RS SS g / w Δ S/ w Hm /w 0.6 0.65 0.7 0.75 0.8 0.85 0.9 0.95 0.7 0.8 0.9 1 0 0.1 0.2 0.3 0.4 0.5 ΔS / w HM/ w oil visualization schlieren visualization ΔP/p 1 , ΔP/p 2 (a) (b)
Fig. 7 Effect of variation ing/wonathe separation shock (SS) and reattachment shock (RS) strengths andbthe extent of separation bubble length and Mach stem height
were abandoned and conducted for only the remaining three g/wvalues.
Earlier studies by Li and Ben-Dor [51] have shown that for such MR configurations, there exists a minimum value of g/wat which the reflected shock wave begins to just graze the shock generator trailing edge, as shown in Fig.5b. At this condition, the MR is considered to be stable [52]. Further lowering theg/wvalue causes the reflected shock to impinge on the SG wedge surface wherein it reflects either as a RR or MR depending upon the local flow conditions, as shown in Fig.5c. The MR in such conditions is termed unstable [52]. Further lowering theg/wvalue causes the Mach stem to continue moving further upstream until, finally, the MR vanishes and a bow shock wave is established ahead of the leading edge of the reflecting wedge [51]. A careful obser-vation of Fig.5b, c clearly indicates that for the present test setup, the minimum g/wvalue for a stable MR condition
is approximately 0.81. Similarly, Li and Ben-Dor [51] point out that there also exists an upper limit for whichg/wis so large that the leading characteristic of the expansion fan from the SG wedge trailing edge begins to intersect the incident shock. At such point, the expansion wave can influence both the strength and the orientation of the incident shock and hence the overall interaction.
3.2 With control
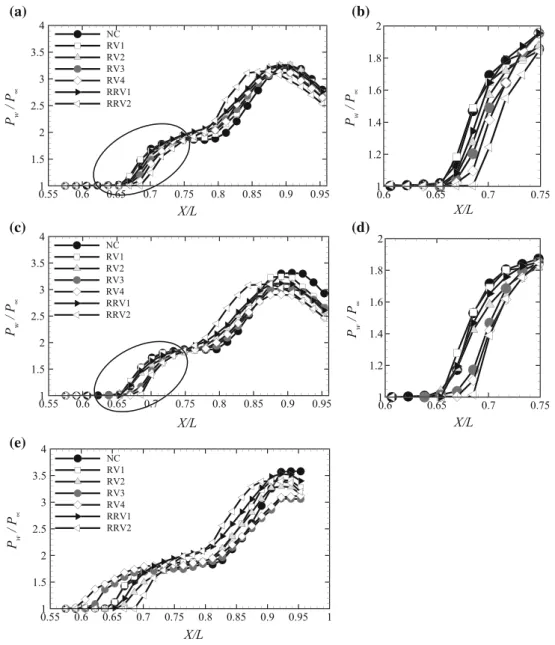
VG devices in the form of ramped vanes and rectangular vanes were implemented 10δ upstream of the separation location to control the interaction for test conditions with g/wvalues of 0.87, 0.81, and 0.725. Figure8a, c, e shows the streamwise distribution of mean pressure distribution obtained using ESP along the plate centerline with and with-out control for eachg/wvalue. The plots on the right, Fig.8b,
Pw /P∝ 0.551 0.6 0.65 0.7 0.75 0.8 0.85 0.9 0.95 1 1.5 2 2.5 3 3.5 4 NC RV1 RV2 RV3 RV4 RRV1 RRV2 Pw /P∝ 0.6 0.65 0.7 0.75 1 1.2 1.4 1.6 1.8 2 Pw /P∝ 0.55 0.6 0.65 0.7 0.75 0.8 0.85 0.9 0.95 1 1.5 2 2.5 3 3.5 4 NC RV1 RV2 RV3 RV4 RRV1 RRV2 Pw /P∝ 0.6 0.65 0.7 0.75 1 1.2 1.4 1.6 1.8 2 X L/ Pw /P∝ 0.551 0.6 0.65 0.7 0.75 0.8 0.85 0.9 0.95 1.5 2 2.5 3 3.5 4 NC RV1 RV2 RV3 RV4 RRV1 RRV2 X L/ X L/ X L/ X L/ (a) (c) (e) (b) (d)
Fig. 8 Streamwise distribution of mean pressure with and without control fora,bg/w= 0.87,c,dg/w = 0.81, andeg/w = 0.725.NC no-control case
d, show a zoom of the separation region marked by an ellipse in their respective plots, Fig.8a, c, respectively, for clarity and discussion. It can be seen that for interactions such as those initiated by stable MRs, only the control devices with h/δ≥0.5 are able to effectively reduce the extent of separa-tion, Fig.8a–d, and hence the overall interaction. From the perspective of pushing the separation location downstream, the most effective RV configuration is RV4, which is fol-lowed by RV3, RV2, and finally RV1 which shows similar separation location as that for no control. However, all the control devices show an upstream movement of the reattach-ment location or in the location of the second rise in wall pressure even for RV1. For RRV devices, on the other hand, the relevant change in separation and reattachment locations
is much more significant compared to the RV devices of simi-lar heights especially for RRV2 case. In fact, the RRV2 device is seen to be even much more effective compared to RV3 and RV4 devices. Similar observations can be made for the inter-action initiated withg/wvalue of 0.81. For the unstable MR case, i.e.,g/w=0.725, Fig.8e, other than the RV3 and RV4 devices which show a significant upstream movement of sep-aration, the smaller height RV and RRV devices ofh/δ=0.5 are seen to initiate good control. The former is caused primar-ily due to very strong interaction shocks induced locally in the immediate vicinity upstream of the RV3 and RV4 devices. These shocks on interaction with the MR on the SG wedge surface modify it significantly causing the TP1 to move fur-ther upstream and hence the separation location that results in
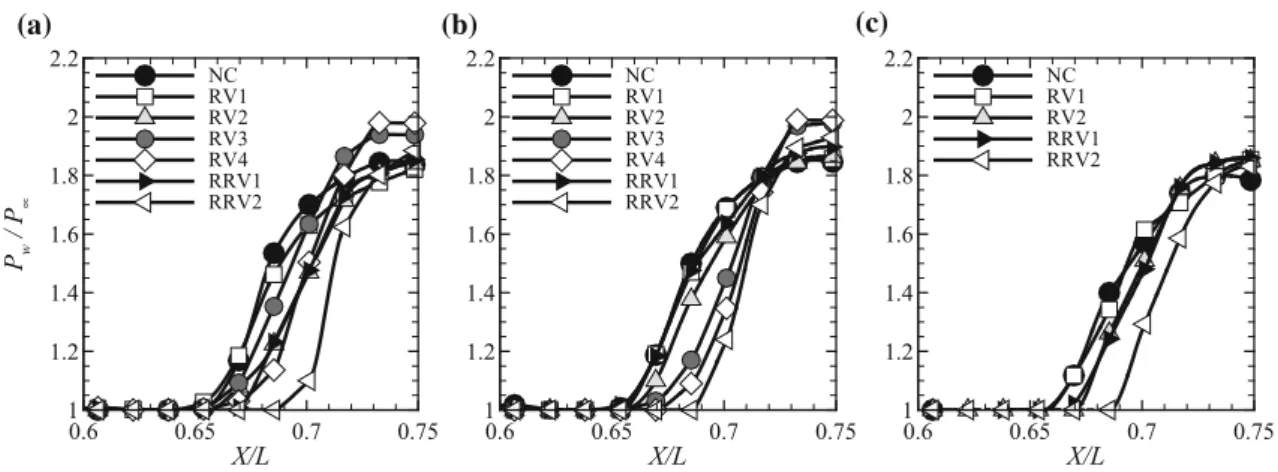
X/L Pw /P∝ 0.6 0.65 0.7 0.75 1 1.2 1.4 1.6 1.8 2 2.2 NC RV1 RV2 RV3 RV4 RRV1 RRV2 X/L 0.6 0.65 0.7 0.75 1 1.2 1.4 1.6 1.8 2 2.2 NC RV1 RV2 RV3 RV4 RRV1 RRV2 X/L 0.6 0.65 0.7 0.75 1 1.2 1.4 1.6 1.8 2 2.2 NC RV1 RV2 RRV1 RRV2 (a) (b) (c)
Fig. 9 Streamwise distribution of mean pressure from Kulite transducer locations with and without control forag/w= 0.87,bg/w= 0.81, andcg/w=0.725.NCno-control case
h/δ XIL /L 0 0.2 0.4 0.6 0.8 1 1.2 0.1 0.2 0.3 0.4 g/w=0.75 g/w=0.81 g/w=0.87 h/δ 0 0.2 0.4 0.6 0.8 1 1.2 0.1 0.2 0.3 0.4 g/w=0.75 g/w=0.81 g/w=0.87 (a) (b)
Fig. 10 Variation in extent of separation foraRV andbRRV
h/δ 0 0.2 0.4 0.6 0.8 1 1.2 0.3 0.6 0.9 1.2 0.75 0.81 0.87 h/δ 0 0.2 0.4 0.6 0.8 1 1.2 0.3 0.6 0.9 1.2 g/w=0.75 g/w=0.81 g/w=0.87 ΔP/p 2 (b) (a)
Fig. 11 Variation in the reattachment shock strengths foraRV andbRRV
a condition similar to flow blockage as during intake unstart. However, this is not so for devices withh/δ ≤0.5, which are still seen to be able to push the separation downstream and the associated reattachment location upstream relative to no control. Of the two types of device configurations, the rect-angular vanes are once again seen to be much more effective compared to the ramped vanes of similar height. The data from the Kulite pressure sensors were also analyzed and are shown in Fig.9. Comparing Figs.8and9show that although a significant three-dimensionality is introduced in the sep-aration line with the implementation of controls, the RRV2
continues to show the most effective control capability com-pared to RV3 and RV4 under all test conditions.
The length of the interaction (XIL/L, Fig.1b), i.e., the dis-tance from the first rise in wall pressure at separation to the beginning of the second pressure plateau (end of reattach-ment), and the reattachment shock strengths (P/p2)are extracted from these mean pressure plots, Fig.8, and plotted in Figs.10 and11, respectively. It can be seen that while the interaction length remains almost similar for g/w val-ues of 0.87 and 0.81, the interaction length shows a gradual decrease in its value with increase in RV height, Fig.10a,
with RV4 showing maximum reduction of 17% relative to no control. A similar such observation can be made forg/w value of 0.725 except for RV3 and RV4 for which the sepa-ration location is observed to move significantly upstream as discussed before. Comparing Fig.10a, b clearly shows that the RRV2 device is able to significantly reduce the length of the interaction in both stable (by 31%) and unstable (by 24%) MR conditions. Similarly, for reattachment shock strength, a significant reduction in its value compared to no control is observed as the RV device height is increased, Fig.11a, with RV4 showing maximum reduction of 23%. In fact, it becomes almost similar for RV3 and RV4 indicating that increasing the device beyondh/δof 0.8 has no effect. A reduction in the reattachment shock strength for RRV2 is observed to be approximately 20% for stable and 35% for unstable MR (Fig.11b). It may, however, be noted that since VGs are known to generate CRVs that create regions of upwash and downwash as they develop downstream, a spanwise array of such VGs will result in a wavy or a corrugated separation line [38]. As a result, depending upon the placement of pressure transducers, the results will vary from the presently reported results which are valid for measurements made along the device centerline or the upwash region. However, it may be pointed out that the overall effectiveness of the control device will still be maintained irrespective of the measure-ments made in the region of upwash or downwash [38].
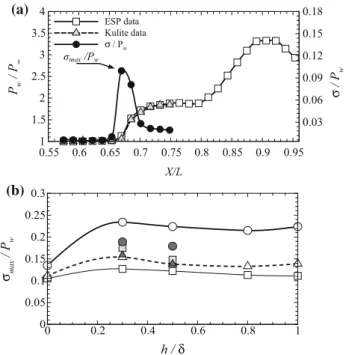
The rms (σ/Pw)values for each of the Kulite transducer locations were calculated. Figure12a shows the distribution of streamwise rms values associated with the streamwise
h /δ σma x /P w 0 0.2 0.4 0.6 0.8 1 0 0.05 0.1 0.15 0.2 0.25 0.3 X/L Pw /P∝ σ /P w 0.55 0.6 0.65 0.7 0.75 0.8 0.85 0.9 0.95 1 1.5 2 2.5 3 3.5 4 0.03 0.06 0.09 0.12 0.15 0.18 ESP data Kulite data σ/ Pw σmax/Pw (b) (a)
Fig. 12 Plots showing the variation inastreamwise distribution in rms values in the region of separation andbpeak rms values with and without control for threeg/wvalues
mean pressure distribution for no-control case and forg/w value of 0.81. It can be seen that the rms values show a signif-icant increase in the region of first rise in wall pressure from its undisturbed boundary-layer value. In this region, the rms value reaches a peak(σmax/Pw), as shown in Fig.12a, after which its value begins to decrease as the plateau pressure region is gradually approached. In this region, it stabilizes to almost a constant value but continues to remain still higher than its value in the undisturbed boundary layer. The σmax/Pwvalues from all the test cases with and without con-trol were extracted and are plotted in Fig.12b for comparison. It can be seen that for no control (h/δ = 0, Fig. 12b) the peak rms values show an increase with decrease ing/w val-ues which is primarily attributed to the increase in strength of the separation shock [2] as discussed earlier, Fig.7a. With control, the peak rms value initially shows an increase for RV1 and thereafter shows an almost similar value indepen-dent of the device height. This trend remains the same with all g/wvalues although a decrease in the rms values is seen with increase ing/wvalue. However, the use of the RRV device brings down the peak rms values significantly though the val-ues still remain higher than that observed for each no-control case. These and the previously discussed results indicate that while the length of interaction and the associated reattach-ment shock strength are considerably controlled using RV and RRV control devices withh/δ ≥ 0.5, the peak rms val-ues in the intermittent region of separation show a significant increase compared to no control for eachg/wtested.
Figures13and14show the schlieren images of the inter-action for the select test cases and forg/wvalues of 0.725 and 0.81, respectively. Only the images for the best perform-ing control devices are shown for comparison relative to no control. For no control, upstream of separation, a series of weak waves (Mach waves with an approximate angle of 30◦) are seen to emanate into the flow primarily from the front and base plate junction and the VG insert. These weak dis-turbances do not introduce any local or spanwise interference in the incoming undisturbed boundary layer that may influ-ence the flow development in any way.
Relative to no control, significant changes are introduced in the flow field when control devices are implemented. Both RV and RRV devices are seen to introduce large-scale flow structures in the boundary layer compared to no control, Figs.13and14, the growth and scale of which are seen to vary with device height, Fig.14b, c, and device configuration. The former observation is in conformity with the results of Lee at al. [37] who reported that the size and strength of the vortices shed from a control device increases with increase in device height. Compared to the RV2 (equivalent height) and RV4 (double height) device, the RRV2 device is seen to generate structures of much larger scale immediately downstream of the device the size of which are seen to increase significantly with increase in downstream distance, resulting in a much
(a) NC (b) RV2 (c) RRV2 TP1 IP1 Hm separation shock reattachment shock Mach stem incident shock flow structures flow structures
Fig. 13 Schlieren images showing the effect of VGs on the overall flow structure associated with Mach reflectionano control,bRV2, and
cRRV2;g/w = 0.725
thicker boundary layer immediately upstream of separation. With regard to this observation, the results of Lee et al. [37] also suggest that the relatively larger-scale structures shed from RRV are also of relatively higher strength compared to those shed from RV3 and RV4 devices. An immediate con-sequence of this is seen in the form of more effective control capabilities exhibited by RRV2 compared to the RV4 device. Both RV4 and RRV2 devices are seen to push the separation shock location considerably downstream compared to no-control case for allg/wcases except forg/wof 0.725, for which the separation moves significantly upstream for RV3 and RV4 devices, as discussed earlier (figures not shown). Further, important details such as the separation location and Mach stem height are marked in these images with dashed vertical lines and double-headed arrows for an immediate qualitative comparison. These details are then carefully mea-sured (±2–3% accuracy) using MATLAB-based program and plotted in Fig.15for an overall comparison. It is clearly seen that the Mach stem and the upper triple point heights (IP1/w) steadily increase with increase in height of RV device. Although this variation is small in going fromg/w of 0.87–0.81, the difference becomes significantly larger for g/wof 0.725 primarily due to the inherently stronger inter-action that thisg/w value results in for this experimental setup, as discussed earlier. No significant changes are intro-duced by RRV devices in the height of Mach stem, although some reductions in the height of TP1 are indicated especially for RRV2. (a) NC (c) RV4 (d) RRV2 (b) RV2 TP1 IP1 Hm separation shock reattachment shock Mach stem incident shock flow structures flow structures flow structures (a) NC (c) RV4 (d) RRV2 (b) RV2 TP1 IP1 Hm separation shock reattachment shock Mach stem incident shock flow structures flow structures flow structures
Fig. 14 Schlieren images showing the effect of VGs on the overall flow structure associated with Mach reflection:ano control,bRV2,
cRV4, anddRRV2;g/w=0.81
It is clear then that (i) the RRV2 device is the most effec-tive in controlling the overall extent of separation in a MR condition irrespective of the g/wvalue tested and (ii) that the effective control of separation, however, is accompanied with an increase in height of the Mach stem. With regard to the latter, although an increase in the device height is seen to increase the effectiveness of a control device in controlling separation, the advantage is, however, offset by an increase in Mach stem height which would be accompanied with an increase in total pressure losses. However, reducing the sep-aration bubble length and its height with effective control in strong interactions such as these in itself is advantageous in preventing or averting the intake unstart condition at off-design operation. As a result, a trade-off has to be reached wherein a taller VG is used only for short time off-design condition with reduced inlet performance.
4 Conclusions
An experimental investigation was conducted to control a Mach reflection-induced interaction in a Mach 2.05 flow
h /δ IP1 /w 0 0.2 0.4 0.6 0.8 1 1.2 0.3 0.4 0.5 0.6 0.725 0.81 0.87 h /δ Hm /w 0 0.2 0.4 0.6 0.8 1 1.2 0.1 0.15 0.2 0.25 0.3 0.35 0.725 0.81 0.87 (a) (b)
Fig. 15 Variation inathe Mach stem height andbtriple point TP1 height as a function ofg/wand control device height
using a 18◦SG. The study was independently conducted for four SG exit heights(g/w)of 0.87, 0.81, 0.725, and 0.66 primarily to study its effect on the extent of flow separation as well as on Mach stem height, with and without control. The intention was to initiate and control an intake unstart like conditions wherein the extent of the separation bubble begins to increase with the separation point moving rapidly forward. For this purpose, two vane-type vortex generator configurations, namely the ramp vane with device heights h/δ = 0.3,0.5,0.8, and 1.0 and the rectangular vane with h/δ=0.3 and 0.5, were used for control. Each control device array was implemented 10δupstream of the separation loca-tion for eachg/wno-control case. A total of 25 mean pressure ports and 13 Kulite pressure transducer locations for unsteady pressure measurements were used to study the interaction. Off-surface visualization of the interaction is done using a Z-type schlieren setup, while the surface flow topology is studied using the conventional surface oil visualization tech-nique.
The assessment of no-control mean pressure data shows that while the strength of both the separation and reattach-ment shocks remains almost similar for SG exit heightg/w of 0.87 and 0.81, a significant increase in these values occurs as theg/w value is further decreased to 0.725 and finally to 0.66. Similar observations can be made for variation in S/w and Hm/wvalues with decreasing g/w. This indi-cates an increasingly stronger interaction forg/wvalues of
0.725 and 0.66 which is responsible for the observed signif-icant increase in the extent of separation. Schlieren images also show that the MR studied in the present tests could be identified as stable forg/w = 0.87 and 0.81 and unstable MRs forg/w=0.725 and 0.66. For stable MR interactions, the extent of separation and the strength of the reattachment shock are seen to decrease with increase in RV height with RV4 showing maximum reductions of 17 and 23% relative to no control, respectively. However, for the unstable MR condi-tion (g/wof 0.725), RV devices ofh/δ=0.8 and 1.0 become completely ineffective. The RRV2 device (h/δ = 0.5), on the other hand, was found to be effective in reducing the extent of separation in both the stable (31%) and unstable (23%) MR conditions. A reduction in reattachment shock strength for RRV2 is observed to be approximately 20% for stable and 35% for unstable MR. However, the effectiveness of each device configuration to control separation is also seen to be accompanied with an associated increase in the height of the Mach stem. But this is not seen as a serious limita-tion considering the fact that in strong interaclimita-tions such as, these it is more important to prevent or avert an intake unstart condition.
The peak rms value, which is a measure of the shock unsteadiness in the interaction region, is initially seen to increase significantly for RV1, relative to no control, and thereafter shows almost similar values independent of RV device height. This trend remains the same with allg/w val-ues, although a decrease in the peak rms values is seen with an increase ing/wvalue. Although the use of RRV devices brings down the peak rms values significantly compared to an RV device of similar height, the values are still higher than that observed for each no-control case.
Acknowledgements The authors wish to thank the National Trisonic Aerodynamic Facility Division of NAL for their support in the execution of this project. The technical support of Narayana during the model design and fabrication as well as of Janardhan and Jones Philip, staff of the 0.3-m wind tunnel facility at NAL during the test campaigns, is gratefully acknowledged. Special thanks to Gangadhar, Shanmogan, Charan Singh, and Anupam Mantry of the NAL Belur Model Shop for model fabrication.
References
1. Babinsky, H., Harvey, J.K.: Shock Wave—Boundary-Layer Inter-actions. Cambridge University Press, Cambridge (2011) 2. Dolling, D.S., Murphy, M.T.: Unsteadiness of the separation shock
wave structure in a supersonic compression ramp flow-field. AIAA J.21, 1628–1634 (1983).https://doi.org/10.2514/3.60163
3. Humble, R.A., Scarano, F., van Oudheusden, B.W.: Unsteady aspects of an incident shock wave/turbulent boundary layer inter-action. J. Fluid Mech.635, 47–74 (2009).https://doi.org/10.1017/ S0022112009007630
4. Délery, J., Dussauge, J.P.: Some physical aspects of shock-wave/boundary layer interactions. Shock Waves 19, 453–468 (2009).https://doi.org/10.1007/s00193-009-0220-z
5. Raghunathan, S.: Passive control of shock boundary layer interac-tion. Prog. Aerosp. Sci.25(3), 271–296 (1988).https://doi.org/10. 1016/0376-0421(88)90002-4
6. Stanewsky, E.: Aerodynamic benefits of adaptive wing technology. Aerosp. Sci. Technol.4, 439–452 (2000).https://doi.org/10.1016/ S1270-9638(00)01069-5
7. Zhang, Y., Tan, H., Tian, F.-C., Zhuang, Y.: Control of inci-dent shock/boundary-layer interaction by a two-dimensional bump. AIAA J. (2014).https://doi.org/10.2514/1.J052786
8. Wong, W.S., Qina, N., Sellars, N., Holden, H., Babinsky, H.: A combined experimental and numerical study of flow structures over three-dimensional shock control bumps. Aerosp. Sci. Technol.12, 436–447 (2008).https://doi.org/10.1016/j.ast.2007.10.011
9. König, B., Pätzold, M., Lutz, T., Krämer, E., Rosemann, H., Richter, K., Uhlemann, H.: Numerical and experimental validation of three-dimensional shock control bumps. J. Aircr. (2009).https://doi.org/ 10.2514/1.41441
10. Ogawa, H., Babinsky, H., Pätzold, M., Lutz, T.: Shock-wave/boundary-layer interaction control using three-dimensional bumps for transonic wings. AIAA J. (2008).https://doi.org/10. 2514/1.32049
11. Kim, S.D.: Aerodynamic design of a supersonic inlet with a para-metric bump. J. Aircr. (2009).https://doi.org/10.2514/1.37416
12. Chinneck, A., Jones, G. C. A, Tracey. C.M.: An interim report on the use of blowing to reduce fall in control effectiveness associated with shock-induced separation at transonic speeds. ARC 1756 FM2231 13. Delery, J.: Shock wave/turbulent boundary layer interaction and its control. Prog. Aerosp. Sci.22(4), 209–280 (1985).https://doi.org/ 10.1016/0376-0421(85)90001-6
14. Fukuda, M.K., Hingst, W.R., Reshotko, E.: Control of shock wave-boundary layer interaction by bleed in supersonic mixed compression inlets. J. Aircr.14, 151–156 (1977).https://doi.org/ 10.2514/3.58756
15. Krogmann, P., Stanewsky, E., Thiede, P.: Effects of suction on shock/boundary-layer interaction and shock-induced separation. J. Aircr.22(1), 37–42 (1985).https://doi.org/10.2514/3.45077
16. Ball, K.O.W., Korkegi, R.H.: An investigation of the effect of suc-tion on hypersonic laminar boundary-layer separasuc-tion. AIAA J.6, 239–243 (1968).https://doi.org/10.2514/3.4484
17. McCormick, D.C.: Shock/boundary-layer interaction control with vortex generators and passive cavity. AIAA J.31(1), 91–96 (1993).
https://doi.org/10.2514/3.11323
18. Barter, J.W., Dolling, D.S.: Reduction of fluctuating pressure loads in shock boundary-layer interactions using vortex generators. AIAA J.10, 1842–1849 (1995).https://doi.org/10.2514/3.12736
19. Ashill, P.R., Fulker, J.L., Hackett, K.C.: Studies of flows induced by sub boundary layer vortex generators (SBVGs). In: 40th AIAA Aerospace Sciences Meeting and Exhibit, AIAA Paper 2002-0968 (2002).https://doi.org/10.2514/6.2002-968
20. Anderson, B.H., Tinapple, J., Surber, L.: Optimal control of shock wave turbulent boundary layer interactions using micro-array actu-ation. In: 3rd AIAA Flow Control Conference, AIAA Paper 2006-3197 (2006).https://doi.org/10.2514/6.2006-3197
21. Lin, J.C.: Review of research on low-profile vortex generators to control boundary-layer separation. Prog. Aerosp. Sci.38(4–5), 389–420 (2002).https://doi.org/10.1016/S0376-0421(02)00010-6
22. Panaras, A.G., Lu, F.K.: Micro-vortex generators for shock wave/boundary layer interactions. Prog. Aerosp. Sci.74, 16–47 (2015).https://doi.org/10.1016/j.paerosci.2014.12.006
23. Seifert, A., Pack, L.G.: Active control of separated flows on generic configurations at high Reynolds numbers. In: 30th Fluid Dynam-ics Conference, AIAA Paper 99-3403.https://doi.org/10.2514/6. 1999-3403
24. McCormick, D.C.: Boundary layer separation control with directed synthetic jet. In: 38th Aerospace Sciences Meeting and Exhibit, AIAA Paper 00-0519 (2000).https://doi.org/10.2514/6.2000-519
25. Glezer, A., Amitay, M.: Synthetic jets. Annu. Rev. Fluid Mech.34, 503–529 (2002).https://doi.org/10.1146/annurev.fluid.34.090501. 094913
26. Narayanaswamy, V., Raja, L.L., Clemens, N.T.: Characterization of a high-frequency pulsed-plasma jet actuator for supersonic flow control. AIAA J.48(2), 297–305 (2010).https://doi.org/10.2514/ 1.41352
27. Greene, B.R., Clemens, N.T., Magari, P., Micka, D.: Control of mean separation in shock boundary layer interaction using pulsed plasma jets. Shock Waves (2015).https://doi.org/10.1007/ s00193-014-0524-5
28. Cattafesta III, L.N., Sheplak, M.: Actuators for active flow control. Annu. Rev. Fluid Mech.43, 247–272 (2011).https://doi.org/10. 1146/annurev-fluid-122109-160634
29. Szwabe, R.: Shock wave induced separation control by streamwise vortices. J. Therm. Sci.14(3), 249–253 (2005).https://doi.org/10. 1007/s11630-005-0009-z
30. Souverein, L.J., Debiève, J.F.: Effect of air jet vortex generators on a shock wave boundary layer interaction. Exp. Fluids49, 1053– 1064 (2010).https://doi.org/10.1007/s00348-010-0854-8
31. Verma, S.B., Manisankar, C.: Shockwave/boundary-layer interac-tion control on a compression ramp using steady micro jets. AIAA J.50(12), 2753–2764 (2012).https://doi.org/10.2514/1.J051577
32. Uzun, A., Solomon, J.T., Foster, C.H., Oates, W.S., Hussaini, M.Y., Alvi, F.S.: Flow physics of a pulsed micro-jet actuator for high-speed flow control. AIAA J.51(12), 2894–2918 (2013).https:// doi.org/10.2514/1.J052525
33. Lin, J.C.: Control of turbulent boundary-layer separation using micro-vortex generators. In: 30th AIAA Fluid Dynamics Confer-ence, AIAA Paper 99-3404, Norfolk, VA, June 28–July 1 (1999).
https://doi.org/10.2514/6.1999-3404
34. Jenkins, L., Gorton, S.A., Anders, S.: Flow control device eval-uation for an internal flow with an adverse pressure gradient. In: 40th AIAA Aerospace Sciences Meeting and Exhibit, Reno, NV, January 14–17, AIAA Paper 2002-0266 (2002).https://doi.org/10. 2514/6.2002-266
35. Ashill, P.R., Fulker, J.L., Hackett, K.C.: Research at DERA on sub boundary layer vortex generators (SBVGs). In: 39th AIAA Aerospace Sciences Meeting and Exhibit, Reno, NV, January 8–11, AIAA Paper 2001-0887 (2001).https://doi.org/10.2514/6. 2001-887
36. Lee, S., Loth, E., Babinsky, H.: Normal shock boundary layer control with various vortex generator geometries. Comput. Fluids
49(1), 233–246 (2011).https://doi.org/10.1016/j.compfluid.2011. 06.003
37. Lee, S., Loth, E.: Impact of ramped vanes on normal shock boundary-layer interaction. AIAA J.50(10), 2069–2079 (2012).
https://doi.org/10.2514/1.J051253
38. Verma, S.B., Manisankar, C.: Assessment of various low-profile mechanical vortex generators in controlling a shock-induced sepa-ration. AIAA J.55(7), 2228–2240 (2017).https://doi.org/10.2514/ 1.J055446
39. Titchener, N., Babinsky, H., Loth, E.: The effects of various vortex generator configurations on a normal shock wave/boundary layer interaction. In: 51st AIAA Aerospace Sciences Meeting including the New Horizons Forum and Aerospace Exposition, AIAA Paper 2013-0018.https://doi.org/10.2514/6.2013-18
40. Holden, H., Babinsky, H.: Effect of micro vortex generators on separated normal shock/boundary layer interactions. J. Aircr.44(1), 170–174 (2007).https://doi.org/10.2514/1.22770
41. Verma, S.B., Hadjadj, A.: Supersonic flow control. Shock Waves 25(5), 443–449 (2015). https://doi.org/10.1007/ s00193-015-0587-y
42. Blinde, P.L., Humble, R.A., Oudheusden, B.W., Scarano, F.: Effects of micro-ramps on a shockwave/turbulent boundary layer
interac-tion. Shock Waves19, 507–520 (2009).https://doi.org/10.1007/ s00193-009-0231-9
43. Kusunose, K., Yu, N.J.: Vortex generator installation drag on an air-plane near its cruise condition. J. Aircr.40(6), 1145–1151 (2003).
https://doi.org/10.2514/2.7203
44. Babinsky, H., Li, Y., Pitt Ford, C.W.: Microramp control of super-sonic oblique shock-wave/boundary-layer interactions. AIAA J.
47(3), 668–675 (2009).https://doi.org/10.2514/1.38022
45. Giepman, R.H.M., Schrijer, F.F.J., van Oudheusden, B.W.: Flow control of an oblique shock wave reflection with micro-ramp vortex generators: Effects of location and size. Phys. Fluids26(6), 066101 (2014).https://doi.org/10.1063/1.4881941
46. Nolan, W.R., Babinsky, H.: Comparison of micro-vortex generators in supersonic flows. In: 6th AIAA Flow Control Conference, AIAA Paper 2012-2812 (2012).https://doi.org/10.2514/6.2012-2812
47. Verma, S.B., Manisankar, C.: Transition control of Mach to regular reflection induced interaction using an array of micro ramp vane-type vortex generators. Phys. Fluids27(10), 107102 (2015).https:// doi.org/10.1063/1.4932405
48. Skews, B.W.: Aspect ratio effects in wind tunnel studies of shock wave reflection transition. Shock Waves 7(6), 373–383 (1997).
https://doi.org/10.1007/s001930050092
49. Van Driest, E.R.: Turbulent boundary layer in compressible flows. J. Aeronaut. Sci.18(3), 145–160 (1951).https://doi.org/10.2514/ 2.7048
50. O’Donnell, R.M.: Experimental investigation at a Mach number of 2.41 of average skin-friction coefficients and velocity profiles for laminar and turbulent boundary layers and an assessment of probe effects. National Advisory Committee for Aeronautics Technical Note, Report No. NACA TN 3122 (1954)
51. Li, H., Ben-Dor, G.: A parametric study of Mach reflection in steady flows. J. Fluid Mech.341, 101–125 (1997)
52. Vuillon, J., Zeitoun, D., Ben-Dor, G.: Reconsideration of oblique shock wave reflections in steady flows. Part 2. Numerical investi-gation. J. Fluid Mech.301, 37–50 (1995).https://doi.org/10.1017/ S0022112095003788