For Peer Review
Effect of Vortex Generators on Corner Separation Caused by
Shock Wave-Boundary-Layer Interaction
Journal: Journal of Aircraft
Manuscript ID 2018-03-C034994.R1 Manuscript Type: Full Paper
Date Submitted by the Author: 15-Jun-2018
Complete List of Authors: Koike, Shunsuke; Japan Aerospace Exploration Agency Aeronautical Technology Directorate
Babinsky, H.; University of Cambridge Department of Engineering
Subject Index Category:
01210 Flow Control < 00000 AIRCRAFT TECHNOLOGY, CONVENTIONAL, STOL/VTOL, 21500 Shock Waves and Detonations < 20000 FLUID DYNAMICS, 21800 Transonic Flow < 20000 FLUID DYNAMICS
For Peer Review
Effect of Vortex Generators on Corner Separation Caused
by Shock Wave-Boundary-Layer Interaction
Shunsuke Koike*
Japan Aerospace Exploration Agency, Chofu, Tokyo, 182-8522, Japan
and Holger Babinsky†
Cambridge University, Cambridge, England, CB2 1PZ, United Kingdom
Wind tunnel experiments were conducted to investigate the effect of vortex generators on a transonic corner flow separation, resulting from the interaction of a normal shock wave with a turbulent boundary layer in a duct at M = 1.4. The shape of the vortex generators was rectangular. The vortex generators were mounted on the bottom wall of the test section. The investigation studied the effects of the rotation direction of the vortex, the VG size and position relative to the shock and the walls. When the leading edge of the vortex generators turn towards the corner, the effect of the vortex generators on the corner flow separation monotonically decreased as the vortex generators size reduced. In these cases, it was observed that independent separations appeared on the bottom wall. When the leading edge of the vortex generators points in the opposite direction away from the corner, the flow structure was found to depend on the size and the location of the vortex generators. We categorized the flow structures into three modes. The effect of the vortex generators and the three modes were successfully collapsed with a location parameter normalized by the second power of the non-dimensional size.
Nomenclature
Av = angle of a vortex generator to the uniform flow
Dvl = distance between a side wall and the leading edge of a vortex generator
Dvt = distance between a side wall and the trailing edge of a vortex generator
* Researcher, Aeronautical Technology Directorate, Member AIAA. † Professor, Department of Engineering. Associate Fellow AIAA. 6 7 8 9 10 11 12 13 14 15 16 17 18 19 20 21 22 23 24 25 26 27 28 29 30 31 32 33 34 35 36 37 38 39 40 41 42 43 44 45 46 47 48 49 50 51 52 53 54 55 56 57
For Peer Review
Hv = height of a vortex generator
Lv = length of a vortex generator
M = Mach number of uniform flow
P = Static pressure
P0 = Stagnation pressure
Re = Reynolds number
T0 = Stagnation temperature
W1B = Width of the streamlines at x = -60 mm on a bottom wall for an evaluation W2B
W2B = Local minimum width of the streamlines starting from W1B on a bottom wall
Xvs = location of vortex generators in the streamwise direction
x = streamwise direction
xv = distance from the leading edge of a vortex generator in the streamwise direction
y = vertical direction to a bottom wall
z = spanwise direction
zv = distance from the leading edge of a vortex generator in the spanwise direction
Xvs = distance between a normal shock wave and the leading edge of a vortex generator
= thickness of the boundary layer at the leading edge of a vortex generator
Subscripts
NoVG = No vortex generator condition
I.Introduction
N a wing in a transonic flow, harmful separations are caused by shock wave-boundary-layer interactions especially on the off-design conditions. Figure 1 schematically shows such separations on a passenger aircraft wing. Generally, a strong shock wave appears on the midspan because the local Mach number in this area is higher than elsewhere. This shock wave can cause the midspan separations which may lead to the transonic buffet [1]. In addition, a corner flow separation can appear in the wing-body junction [2] because the viscous retardation of the body and the wing surfaces leads to significant loss of streamwise momentum in the corner [3].
O
6 7 8 9 10 11 12 13 14 15 16 17 18 19 20 21 22 23 24 25 26 27 28 29 30 31 32 33 34 35 36 37 38 39 40 41 42 43 44 45 46 47 48 49 50 51 52 53 54 55 56 57 58For Peer Review
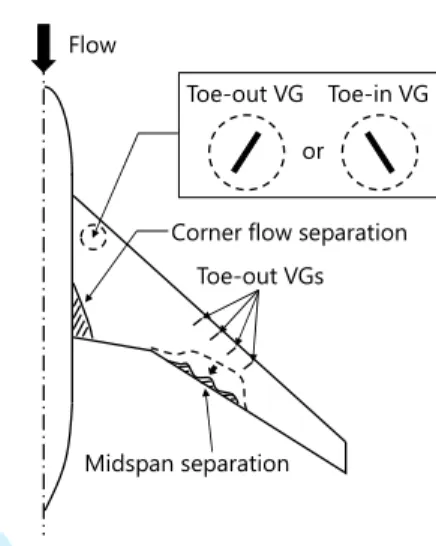
Fig. 1 Separation on a passenger aircraft wing and VGs direction for the separations.
Previous research [4,5] shows that the vortex generators (VGs) work well to reduce midspan separation on the backward swept wing when the leading edge of the VGs turns towards the wing tip. On the other hand, VGs were found to have little effect on the wing when the leading edge turns towards the wing-body junction. In this paper, we refer to the former direction as “toe-out” and the latter direction as “toe-in”.
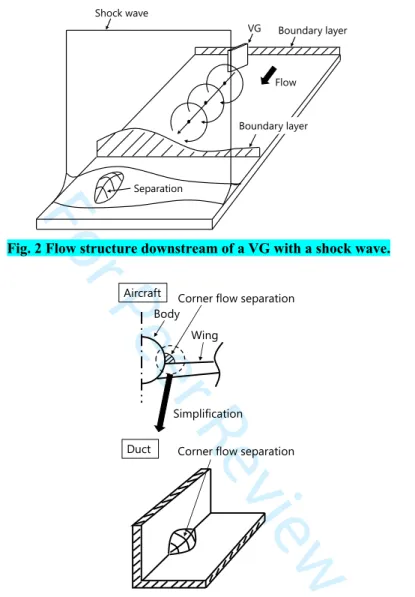
The objective of this research is to determine the potential of VGs to reduce the corner flow separation in the wing-body junction. In this region, it is not immediately clear that “toe-out” VGs will be more effective because of the particular flow field they generate. Figure 2 schematically shows the boundary layer downstream of a VG placed ahead of a normal shock. On the downwash side of the vortex, the thickness of the boundary layer is decreased by the vortex as expected. However, the thickness of the boundary layer increases on the upwash side [6]. This is caused by the low momentum flow transported from the downwash side. Thus, a separation can appear on the upwash side when a shock wave interacts with this thickened boundary layer. Therefore, this project investigates the influence of VG direction on the reduction of corner flow separation. Furthermore the influence of VG size and location is also studied. The aim is to arrive at recommendations for the placement of VGs on a wing as illustrated in Fig. 1. In order to answer this question and to extract the dominant flow physics, we simplified the problem from a real wing-body junction to the corner of a rectangular duct as shown in Fig. 3. Although real wing-body junctions are rounded or chamfered to alleviate the corner separation, we selected the sharp corner in order to not complicate the problem. We decided to concentrate on the more fundamental physics of transonic corner flows. It is suggested that any benefits of flow control observed in this simplified canonical problem would also successfully address corner flow separation in rounded
Flow
Toe-out VGs Corner flow separation
Midspan separation or Toe-out VG Toe-in VG 6 7 8 9 10 11 12 13 14 15 16 17 18 19 20 21 22 23 24 25 26 27 28 29 30 31 32 33 34 35 36 37 38 39 40 41 42 43 44 45 46 47 48 49 50 51 52 53 54 55 56 57
For Peer Review
corners. Therefore, the information of this research might allow designers to reduce the degree of rounding off or address situations where corner separation prevails even in cases where the junction is already rounded or chamfered.
Fig. 2 Flow structure downstream of a VG with a shock wave.
Fig. 3 Simplification of wing junction problem from a real aircraft to a duct.
II.Experimental method
A. Wind tunnel and shock holding system
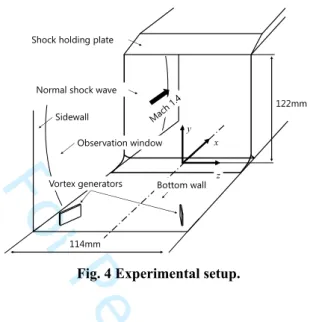
Experiments were performed in the Cambridge University Engineering Department supersonic wind tunnel no.1. Figure 4 shows a schematic figure of the flow field and the test section. To hold the normal shock wave at a specific location, a shock holding plate was set in the test section [7]. By adjusting a chocking block mounted on the shock holding plate at the exit of the test section, the normal shock wave can be fixed at the plate’s leading edge. The distance
Flow Boundary layer Boundary layer Separation Shock wave VG Body Aircraft Wing
Corner flow separation
Simplification
Duct Corner flow separation 6 7 8 9 10 11 12 13 14 15 16 17 18 19 20 21 22 23 24 25 26 27 28 29 30 31 32 33 34 35 36 37 38 39 40 41 42 43 44 45 46 47 48 49 50 51 52 53 54 55 56 57 58
For Peer Review
between the shock holding plate and the bottom wall was 122 mm. The width of the duct was 114 mm. A right-handed coordinate system as shown in Fig. 4 is used in this paper. The origin of the coordinate system is on the center line of the bottom wall at the nominal shock position.
Fig. 4 Experimental setup.
Table 1 summarizes the inflow conditions. The nominal Mach number and total pressure were set at 1.4 and 185 kPa, respectively. Total temperature was 300 K ± 5 K. The unit Reynolds number is calculated at 27.4 million. Typical duration time of each blow was about 20 seconds.
Table 1 Uniform flow conditions
B. VG parameters
Figure 5 shows the geometry of the VGs used in this study. We defined VGs whose leading edge turns towards the corner as “toe-in”, and VGs whose leading edge points in the opposite direction as “toe-out”. The VGs were mounted on the bottom wall in all test cases. The shape of the VG was rectangular. The main parameters were height
Hv, length Lv, angle Av, and the distance from the side wall Dvl and Dvt. Here, the parameters Dvl and Dvt are the distance
from the side wall to the leading edge and to the trailing edge of the VG, respectively. The boundary layer thickness at the leading edge of the VG was adopted as the representative viscous length-scale. This was estimated from a straight line interpolation of the velocity profiles given in Ref. [8]
Normal shock wave
Vortex generators 122mm Sidewall x y z Bottom wall 114mm Shock holding plate
Observation window M unit Re [1/m] T0 [K] P0 [kPa] 1.4 27.4 milion 300 185 6 7 8 9 10 11 12 13 14 15 16 17 18 19 20 21 22 23 24 25 26 27 28 29 30 31 32 33 34 35 36 37 38 39 40 41 42 43 44 45 46 47 48 49 50 51 52 53 54 55 56 57
For Peer Review
(a) Shape of VG
(b) Toe-in VG
(c) Toe-out VG Fig. 5 Parameters of VG.
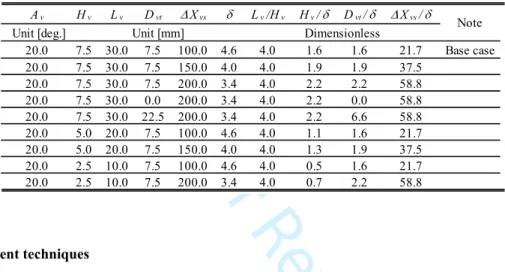
Table 2 and 3 show the parameters of all test cases. In the baseline VG tests, the VG parameters were equivalent to those used in previous research [4,5]. Such VGs were found to successfully reduce transonic buffet on wings. In line with previous research, the height of the VGs was 1.6 times the thickness of the boundary layer at x = -100 mm which is the baseline case VG position. The distances between the VGs and the sidewall, Dvl and Dvt are one of the
parameters varied in this research. In the baseline cases, the distances were selected to avoid any interaction between the VGs and the sidewall boundary layer. The minimum distance between the VGs and the sidewall is 7.5 mm, which is 1.6 times the boundary layer thickness in the base VGs case. The aspect ratio of the VGs Lv/Hv and the angle Av
Hv Lv Base VG Bottom wall Si dewa ll Hv VG Boundary layer yzplane Sidewall Shock wave Xvs VG Av Dvl xzplane Flow Bottom wall Si dewa ll Hv VG Boundary layer yzplane Sidewall Shock wave VG Av Dvt Xvs xzplane Flow 6 7 8 9 10 11 12 13 14 15 16 17 18 19 20 21 22 23 24 25 26 27 28 29 30 31 32 33 34 35 36 37 38 39 40 41 42 43 44 45 46 47 48 49 50 51 52 53 54 55 56 57 58
For Peer Review
were fixed at 4 and 20 degrees, respectively. To investigate the influence of the VG size, heights of 2.5 mm and 5.0 mm were also tested. The influence of VG location was investigated only in the toe-out cases.
Table 2 Parameters of toe-in VG
Table 3 Parameters of toe-out VG
C. Measurement techniques
A schlieren system is used to monitor the flow fields. The system consisted of a light source, two concave mirrors, a reflection mirror, a knife edge and a CMOS camera. A circular area of diameter 203 mm is visualized by the system through the observation windows. The direction of the knife edge is set in the horizontal direction to best visualize the VG’s vortex. Although this is sensitive to vertical density gradients, the normal shock wave can be clearly seen because of the shadowgraph effect.
Surface oil flow is used to visualize the streamlines on the bottom wall and sidewall at z = +57 mm. The mixture uses a combination of Titanium Dioxide (TiO2) powder, fluidic paraffin, and oleic acid. The ratio of the TiO2 and the fluidic paraffin is 33 g to 175 ml. About 10 drops of oleic acid is added after mixing.
A two component Laser Doppler Velocimetry (LDV) system (TSI) is used for velocity measurements. Two pairs of coherent laser beams (542nm and 532nm) are focused inside the test section. The measurement volume is 130 m in diameter. Kerosene particles with a diameter of approximately 0.5 m [8], are used as the tracer. The measurement volume is traversed from y = 20 mm to y = 0 mm at x = +40 mm and z = -47 mm. The velocity measurements are
Av Hv Lv Dvl Xvs Lv/Hv Hv/ Dvl/ Xvs/ Unit [deg.] 20.0 7.5 30.0 7.5 100.0 4.6 4.0 1.6 1.6 21.7 Base case 20.0 5.0 20.0 7.5 100.0 4.6 4.0 1.1 1.6 21.7 20.0 2.5 10.0 7.5 100.0 4.6 4.0 0.5 1.6 21.7 Note Unit [mm] Dimensionless Av Hv Lv Dvt Xvs Lv/Hv Hv/ Dvt/ Xvs/ Unit [deg.] 20.0 7.5 30.0 7.5 100.0 4.6 4.0 1.6 1.6 21.7 Base case 20.0 7.5 30.0 7.5 150.0 4.0 4.0 1.9 1.9 37.5 20.0 7.5 30.0 7.5 200.0 3.4 4.0 2.2 2.2 58.8 20.0 7.5 30.0 0.0 200.0 3.4 4.0 2.2 0.0 58.8 20.0 7.5 30.0 22.5 200.0 3.4 4.0 2.2 6.6 58.8 20.0 5.0 20.0 7.5 100.0 4.6 4.0 1.1 1.6 21.7 20.0 5.0 20.0 7.5 150.0 4.0 4.0 1.3 1.9 37.5 20.0 2.5 10.0 7.5 100.0 4.6 4.0 0.5 1.6 21.7 20.0 2.5 10.0 7.5 200.0 3.4 4.0 0.7 2.2 58.8 Note Unit [mm] Dimensionless 6 7 8 9 10 11 12 13 14 15 16 17 18 19 20 21 22 23 24 25 26 27 28 29 30 31 32 33 34 35 36 37 38 39 40 41 42 43 44 45 46 47 48 49 50 51 52 53 54 55 56 57
For Peer Review
repeated three times. Although typical measurement accuracy was estimated to be better than 1 m/s [9], a larger discrepancy is locally observed between the three measurements because the seeding density in the measurement location is locally lower than ideal. To illustrate this discrepancy, the images in the results section will include data from all runs. Finally, the typical uncertainty (95% confidence interval) is estimated as less than 15 m/s. Only for the toe-out VG case, the uncertainty is locally higher than others in the region higher than y = 7 mm. Here, this uncertainty is estimated as 33 m/s.
To calculate the local Mach number from the velocity data, total temperature is measured by T-type thermo couples in the settling chamber. The local Mach number at each measurement point is calculated from the total temperature and the measured velocity. An adiabatic flow is assumed in the calculation. Considering error propagation, the total uncertain of the local Mach number is better than 0.1 throughout (including the worst regions discussed above). The uncertainty except for the worst region is better than 0.05.
Total pressures and wall static pressures are recorded using a pressure scanner. The uncertainty of the pressure scanner is less than 0.1 kPa.
The pressure distributions on the bottom wall are also visualized with pressure sensitive paint (PSP). The PSP (UniCoatPSPUNC-12, ISSI) is painted directly on the metal surface of the bottom wall. The PSP is illuminated with UV light (LM2x-DM, ISSI) through the observation window. The luminescence of the PSP is recorded with a consumer CMOS camera (Nikon D7100) at a resolution of 0.04 pixel/mm. After an intensity correction, a Wiener filter is applied to the images to reduce the influence of noise. A window size of 64 pixels x 64 pixels is adopted for the procedure corresponding to 2.4 mm x 2.4 mm in physical length. In-situ calibration technique with linear Stern-Volmer equation [10] is adopted to change the intensity ratio of the images to the pressure value. Six taps on the center line of the bottom wall are used as the reference points. The root mean square of the difference between the PSP data and the pressure scanner data is roughly 5 % of the measurement values.
III.Results
A. Influence of the VG direction
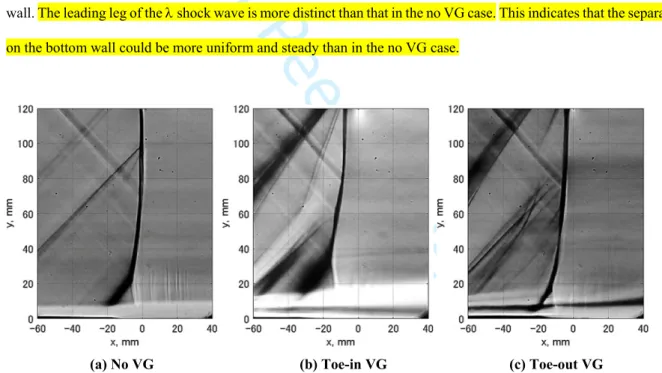
Figure 6(a) shows a schlieren image in the no VG case. The location of the normal shock wave is adjusted to be at
x = 0 mm. The chocking block is then fixed at this position for all other cases. Because of the interaction between the normal shock wave and the boundary layer, a shock wave appears in the region close to the bottom wall. The height of the triple point is about 20 mm.
6 7 8 9 10 11 12 13 14 15 16 17 18 19 20 21 22 23 24 25 26 27 28 29 30 31 32 33 34 35 36 37 38 39 40 41 42 43 44 45 46 47 48 49 50 51 52 53 54 55 56 57 58
For Peer Review
Figure 6(b) shows a schlieren image for the baseline toe-in VG case. The location of the normal shock wave is x
= 10 mm which is further upstream than in the no VG case. The size of the shock wave is larger than in the no VG case and the height of the triple point is about 40 mm. This indicates that a larger separation appears on the bottom wall compared to the no VG case. The leading leg of the shock wave is more blurred than that in the no VG case. The schlieren images are the result of a spanwise integration of the density gradient information. In addition, they include all information in the exposure time. Thus, the blurred shock wave indicates that the separation on the bottom wall could be more ununiform and unsteady in the baseline toe-in VG case compared to the no VG case.
Figure 6(c) shows a schlieren image of the baseline toe-out VG case. The location of the normal shock wave is a little upstream from in the no VG case. The size of the shock wave is smaller than in the no VG case. The height of the triple point is less than 20 mm. This indicates that the toe-out VGs reduce the size of the separation on the bottom wall. The leading leg of the shock wave is more distinct than that in the no VG case. This indicates that the separation on the bottom wall could be more uniform and steady than in the no VG case.
(a) No VG (b) Toe-in VG (c) Toe-out VG
Fig. 6 Schlieren images of the normal shock wave in the no VG case, the toe-in VGs case (Hv = 7.5mm, Dvl =
7.5mm, Xvs = 100 mm) and the toe-out VGs case (Hv = 7.5 mm, Dvt = 7.5 mm, Xvs = 100 mm).
Figure 7(a) shows the oil flow visualization for the no VG case on the sidewall and the bottom wall. In the no VG case, flow separations are observed in both corners. The streamlines on the bottom wall show attached flow in the center region. 6 7 8 9 10 11 12 13 14 15 16 17 18 19 20 21 22 23 24 25 26 27 28 29 30 31 32 33 34 35 36 37 38 39 40 41 42 43 44 45 46 47 48 49 50 51 52 53 54 55 56 57
For Peer Review
Figure 7(b) shows oil flow pictures for the toe-in VG case. From the streamlines on the sidewall, it is confirmed that the VGs reduce the corner flow separation. The angle of the streamlines from y = 25 mm to 50 mm on the sidewall is lower than that in the no VG case. However, a separation appears in the center region on the bottom wall. We will refer to this as the “bottom wall separation” hereafter. The bottom wall separation in Fig. 7(b) corresponds to the separation on the compression side of the vortex in the single VG case discussed earlier (see Fig. 2).
Figure 7(c) shows oil flow pictures for the toe-out VG case. From the streamlines on the bottom wall, it is confirmed that the VGs reduce the corner flow separation on the bottom wall. The toe-out VGs lift the low momentum flow from the corner and onto the sidewall. As the result, a new separation independently appears on the sidewall. We will refer to this as the “sidewall separation” hereafter.
(a) No VG (b) Toe-in VG 6 7 8 9 10 11 12 13 14 15 16 17 18 19 20 21 22 23 24 25 26 27 28 29 30 31 32 33 34 35 36 37 38 39 40 41 42 43 44 45 46 47 48 49 50 51 52 53 54 55 56 57 58
For Peer Review
(c) Toe-out VG
Fig. 7 Oil flow pictures in the no VG case, the toe-in VGs case (Hv = 7.5mm, Dvl = 7.5mm, Xvs = 100 mm) and
the toe-out VGs case (Hv = 7.5 mm, Dvt = 7.5 mm, Xvs = 100 mm).
Figure 8 shows the profiles of local Mach number in the vertical direction at x = +40 mm and z = -47 mm. The values are calculated from the velocity profiles measured with LDV. The measurement location is illustrated as an open circle in Fig 7. From y = 0 mm to 5 mm, the local Mach numbers in the VG cases are higher than that in the no VG case. These results quantitatively confirm that the VGs accelerate the flow close to the bottom wall at this measurement point. From y = 10 mm to 20 mm, the local Mach number in the toe-out VG case is lower than that in the no VG case. The low speed region is caused by the sidewall separation shown in Fig. 7(c).
Fig. 8 Local Mach number distribution downstream of the normal shock wave (x = +40 mm, z = -47 mm).
0 5 10 15 20 0 0.2 0.4 0.6 0.8 1 1.2 1.4 y , mm Mach number Measurement location:x= +40 mm, z= -47 mm Toe‐Out VGs Toe‐In VGs Base flow 6 7 8 9 10 11 12 13 14 15 16 17 18 19 20 21 22 23 24 25 26 27 28 29 30 31 32 33 34 35 36 37 38 39 40 41 42 43 44 45 46 47 48 49 50 51 52 53 54 55 56 57
For Peer Review
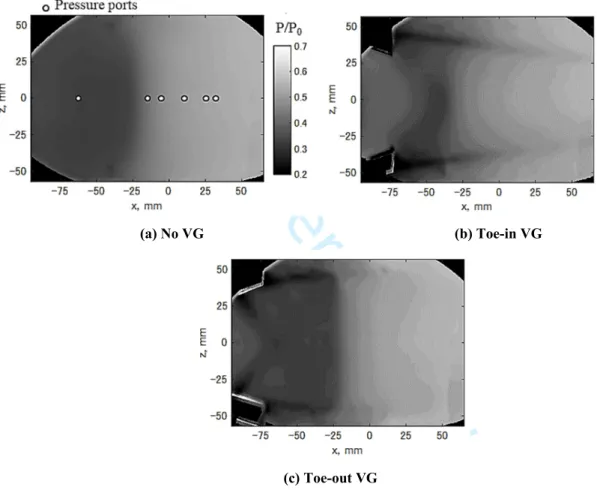
Figures 9(a)-(c) show the pressure distributions on the bottom wall measured with PSP. In the toe-in VG case, a low-pressure region extends from the VGs to downstream of the normal shock wave. These low pressure regions are thought to be foot prints of the streamwise vortices caused by VGs. The pressure distribution in the corner regions is more complex in the toe-in VG case because of the influence of these vortex footprints. The shape of the shock wave on xz plane is approximately estimated from the pressure distribution in the toe-out VG case. It seems that the shock wave in the toe-out VG case is more straight than that in the no VG case.
(a) No VG (b) Toe-in VG
(c) Toe-out VG
Fig. 9 Pressure distribution on the bottom wall.
The symbols and lines in Fig. 10 show the pressure measured by pressure taps and PSP, respectively, along the center line of the bottom wall. The pressure increase location in the toe-in VG case is the most upstream of all three cases. This is likely caused by the bottom wall separation. It can also be seen that the toe-out VG case shows a slightly increased pressure recovery after the shock.
6 7 8 9 10 11 12 13 14 15 16 17 18 19 20 21 22 23 24 25 26 27 28 29 30 31 32 33 34 35 36 37 38 39 40 41 42 43 44 45 46 47 48 49 50 51 52 53 54 55 56 57 58
For Peer Review
Fig. 10 Pressure distribution on the center line.As mentioned above, both the toe-in and the toe-out VGs work well to reduce the corner flow separation. However, both VG types also cause additional separations on the bottom wall for toe-in VGs and the sidewall for the toe-out VGs. Thus, if toe-in VGs were placed on a wing to control wing-body junction flow, an undesirable additional separation might result. Therefore toe-out VGs would be preferable in such a scenario, because the flow on the fuselage is usually less critical. Since the adverse pressure gradient on the body is generally weaker than that on the wing, we can expect that the influence of the sidewall separation is minimized. In the following, the influence of size and location will be studied for toe-out VGs mainly.
B. Influence of VG size and location
Figures 11(a) and (b) show the oil flow pictures when the height of VGs are 5.0 mm and 2.5 mm, respectively. As shown in Figs. 11, the sizes of the vortex and the bottom wall separation decrease gradually as the size of the toe-in VGs reduces. Their influence on the flow field monotonically reduces as the size decreases.
(a) Hv = 5.0 mm (b) Hv = 2.5 mm
Fig. 11 Oil flow pictures of toe-in VGs (Xvs = 100 mm, Dvt = 7.5 mm).
0.2 0.3 0.4 0.5 0.6 0.7 -100 -75 -50 -25 0 25 50 75 P/ P0 x, mm No VG (Ports) Toe-In VGs (Ports) Toe-Out VGs (Ports) No VG Toe-In VGs Toe-Out VGs 6 7 8 9 10 11 12 13 14 15 16 17 18 19 20 21 22 23 24 25 26 27 28 29 30 31 32 33 34 35 36 37 38 39 40 41 42 43 44 45 46 47 48 49 50 51 52 53 54 55 56 57
For Peer Review
On the other hand, the flow structure can change dramatically with reducing the toe-out VG size. Figure 12(a) shows oil flow pictures for the smallest toe-out VG case (height: 2.5 mm). The location of the leading edge of the VG is the same as that in Fig. 7(c). In Fig. 12(a), the sidewall separation does not appear. Instead, the size of the corner flow separation is increased compared to the no VG case as seen from the surface flow on the bottom wall. Because the vortex scale in Fig. 12(a) is smaller than that in the baseline toe-out VG case, the expected separation on the compression side of the vortex locates at lower position comparing with the baseline toe-out VG case. As the result, the expected separation is not isolated but rather adheres to the corner flow separation which is consequently increased. To investigate the influence of VG location, the smallest VG is moved further upstream to x = -200 mm. Figure 12(b) shows the oil flow pictures for this case. The interval between the VG and the sidewall is the same as previously. From the oil flow on the bottom wall, it can be confirmed that the corner flow separation is reduced and that an independent sidewall separation can be observed in the top figure of Fig. 12(b).
(a) Xvs = 100 mm (b) Xvs = 200 mm
Fig. 12 Oil flow pictures of smallest toe-out VGs (Hv = 2.5 mm, Dvt = 7.5 mm).
The influence of the interval between the VG and the sidewall is also investigated. In these cases, the height of the VGs is 7.5 mm. The location of the VGs in the streamwise direction is fixed at x = -100 mm. Figure 13(a) shows the oil flow for the largest interval case. The interval between the trailing edge of the VGs and the sidewall is 22.5 mm. In this case, an independent sidewall separation does not appear in the same way as in Fig. 12(a). Instead, the size of the corner flow separation increases from the original size. Thus, once again, the expected separation on the compression side of the vortex adheres to, and enlarges the corner separation.
6 7 8 9 10 11 12 13 14 15 16 17 18 19 20 21 22 23 24 25 26 27 28 29 30 31 32 33 34 35 36 37 38 39 40 41 42 43 44 45 46 47 48 49 50 51 52 53 54 55 56 57 58
For Peer Review
Figure 13(b) shows the oil flow pictures for the smallest interval case. The interval between the trailing edge of the VG and the sidewall is 0 mm. For this condition, the pattern on the bottom wall doesn’t differ greatly from that in Fig. 7(c). However, the side wall separation is largest of all toe-out VG cases. It appears that this condition should be avoided in practical situations.
(a) Dvt= 22.5 mm (b) Dvt = 0 mm
Fig. 13 Oil flow pictures of the toe-out VGs (Hv = 7.5 mm, Xvs = 100 mm).
C. Categorization of the separation modes
Since we observed several different separation behaviors, we categorized the separation into different ‘modes’ based on an observation of the oil flow pictures. Figure 14 summarizes these separation modes.
The toe-in VG cases are simply grouped into the “influence mode” and the “no influence mode”. When the size of the toe-in VGs decreases, the influence of the toe-in VGs on the corner flow decreases but there is no drastic change to the flow structure.
On the other hand, the separation behavior in the toe-out VG cases can be categorized into three modes. In the first mode, the sidewall separation appears independently. The size of the corner flow separation is reduced by the streamwise vortex. We name this first mode the “lift off mode” because the low momentum flow in the corner region is lifted off to a high position on the sidewall. In the second mode, the corner flow separation increases from the base flow case. The sidewall separation does not appear in this mode. We name this second mode the “adhesion mode” because the low momentum flow on the compression side of the vortex adheres to the corner flow separation. The second mode appears when the VG size decreases and the interval between the VG and the sidewall increases from 6 7 8 9 10 11 12 13 14 15 16 17 18 19 20 21 22 23 24 25 26 27 28 29 30 31 32 33 34 35 36 37 38 39 40 41 42 43 44 45 46 47 48 49 50 51 52 53 54 55 56 57
For Peer Review
(a) Tree diagram of categorization (b) No VG(c) TI-1 Influence mode
(d) TI-2 No influence mode
(e) TO-1 Lift off mode
(f) TO-2 Adhesion mode
(g) TO-3 No influence mode Fig. 14 Categorization of the separation modes.
Categorization of interaction modes for the corner flow VG
(I)Toe-in VG Corner flow VG
(O)Toe-out VG
(TI-1) Influence mode (TI-2) No influence mode (TO-1) Lift off mode (TO-2) Adhesion mode (TO-3) No influence mode VG direction
Separation mode
Bottom wall Sidewall
Shock wave Corner flow separation
Flow Bottom wall Sidewall Shock wave Flow Shock wave Streamwise vortex Vortex generator Corner flow separation
Bottom wall separation
Bottom wall Sidewall
Vortex generator Shock wave
Streamwise vortex Corner flow separation
Flow
Bottom wall separation
Bottom wall Sidewall
Vortex generator
Shock wave Streamwise vortex
Corner flow separation Sidewall separation Flow Bottom wall Sidewall Vortex generator Shock wave Streamwise vortex Corner flow separation
Flow Bottom wall Sidewall Vortex generator Shock wave Streamwise vortex
Corner flow separation
Flow
Bottom wall separation 6 7 8 9 10 11 12 13 14 15 16 17 18 19 20 21 22 23 24 25 26 27 28 29 30 31 32 33 34 35 36 37 38 39 40 41 42 43 44 45 46 47 48 49 50 51 52 53 54 55 56 57 58
For Peer Review
the condition in the lift off mode. The third mode is termed the “no influence mode”. In this mode, the vortex does not interact with the corner flow separation. The bottom wall separation appears independently as shown in Fig. 2.
D. Quantitative evaluation of the VGs effect from oil flow pictures
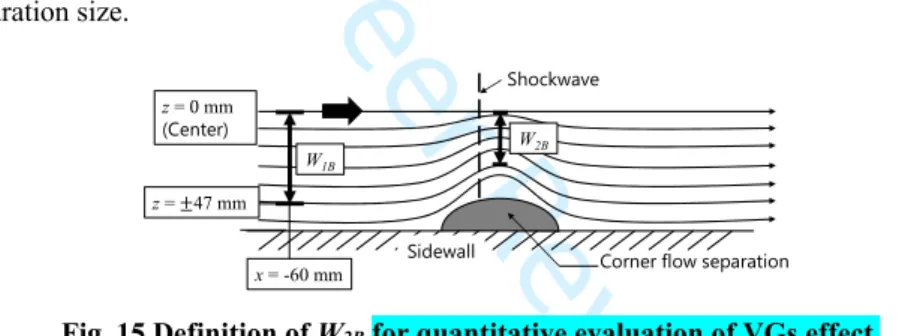
Since the lift off mode is desirable for the reduction of corner flow separation, it would be useful to determine the criteria governing the transition boundaries between the separation modes. To obtain those and quantitatively evaluate the effect of the VGs from the oil flow pictures, we introduce a parameter, W2B as shown in Fig. 15. We select two
streamlines at x = -60 mm. One streamline is the symmetry line (z = 0 mm) while the other is closer to the corner by a spanwise distance W1B = 47 mm. This is chosen because a streamline at this position (10 mm from the side wall)
generally remains clearly visible whereas streamlines closer to the corner are often difficult to identify. Following both streamlines in flow direction generally shows that there is a minimum separation distance W2B where the corner
separation is greatest. Thus, any changes in the local minimum width can be used as a measure of the effect of VGs on the corner separation size.
Fig. 15 Definition of W2B for quantitative evaluation of VGs effect.
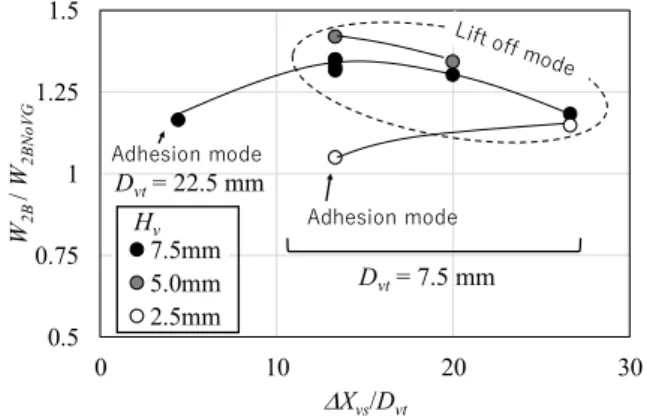
Figure 16 shows the influence of VG location on W2B/W2BNoVG for all cases except for the case with zero interval.
Here, W2B is normalized with the value in the no VG case, W2BNoVG. The oil flow visualizations suggest that the
separation mode changes from the adhesion mode to the lift off mode when the location parameter Xvs/Dvt increases.
The lift off mode is observed when the VG height is greater than or equal to the boundary layer thickness, and the parameter Xvs/Dvt is higher than thirteen. In the lift off mode, the value W2B/W2BNoVG decreases with increasing
distance Xvs between the shock wave and the VGs. It seems that the decrease is a consequence of the boundary layer
development after the vortex passes through the corner region. When the height of the VGs is lower than the boundary layer thickness, W2B/W2BNoVG is lower than in the other cases. Figure 16 clearly shows the influence of the VG size.
To summarize the influence of the size and location of the VGs on W2B/W2BNoVG and the separation mode, we
normalized the location parameter Xvs/Dvt with the second power of the non-dimensional VG size Hv/ as seen in Fig.
17. This seems to successfully collapse the influence of the VGs size. The boundary between the two separation modes Shockwave
Corner flow separation
z = 0 mm (Center) Sidewall W1B W2B x = -60 mm z = 47 mm 6 7 8 9 10 11 12 13 14 15 16 17 18 19 20 21 22 23 24 25 26 27 28 29 30 31 32 33 34 35 36 37 38 39 40 41 42 43 44 45 46 47 48 49 50 51 52 53 54 55 56 57
For Peer Review
is at about (Xvs/Dvt)(Hv/)2 = 14. Below this value, W2B/W2BNoVG increases dramatically. After that, W2B/W2BNoVG
decreases gradually.
Fig. 16 Relation between the evaluation W2B/W2BNoVG and the VGs location parameter, Xvs/Dvt, (Lv/Hv = 4, Av=
20deg).
Fig. 17 Relation between the evaluation W2B/W2BNoVG and the location parameter corrected by the VG scale,
(Xvs/Dvt)(Hv/)2, (Lv/Hv = 4, Av = 20 deg).
It seems that the location of the sidewall separation is determined by the upper edge of the vortex. Hence, we hypothesize that the separation mode becomes the lift off mode when the upper edge of the vortex penetrates the corner boundary layer in the region upstream of the shock wave. In addition, we hypothesize that the separation condition is similar for the bottom wall when the vortex upper edge is the same location even if the VG’s parameters are different. Therefore, we non-dimensionalize the location parameter Xvs/Dvt with the second power of the
non-dimensional VG size Hv/. The normalization with the second power of the scale parameter is based on the ideas
shown in Fig. 18 relating both vortex size and trajectory to VG height. In the flow field, the vortex scale and the vortex trajectory are influenced by the scale parameter Hv/. When the height of the VG increases, the size of the vortex
0.5 0.75 1 1.25 1.5 0 10 20 30 W2B / W2B N oV G Xvs/Dvt Adhesion mode Hv Dvt= 22.5 mm Adhesion mode Dvt= 7.5 mm 7.5mm 5.0mm 2.5mm 0.5 0.75 1 1.25 1.5 0 20 40 60 80 100 120 140 W2B / W2B N oV G (Xvs/Dvt)(Hv/)2 Hv 7.5mm 5.0mm 2.5mm Adhesion mode
Lift off mode
6 7 8 9 10 11 12 13 14 15 16 17 18 19 20 21 22 23 24 25 26 27 28 29 30 31 32 33 34 35 36 37 38 39 40 41 42 43 44 45 46 47 48 49 50 51 52 53 54 55 56 57 58
For Peer Review
increases almost proportionally. However, a scale correction of the trajectory is not so obvious because the trajectory is influenced by both the strength of the vortex and the distance between it and its mirror vortex. The vortex strength increases as the VG size increases. However, the distance between the real and the mirror vortex also increases as the VG size increases and therefore both effects contradict each other. Thus, we investigated the trajectory of two single vortex cases, for two heights of VGs.
(a) Vortex scale correction (b) Vortex trajectory correction
Fig. 18 Concept of VG scale correction for the non-dimensional parameter (Xvs/Dvt)(Hv/)2.
Figure 19 shows the trajectories of the vortex footprint. The height of the small VG and the large VG are 2.5 mm and 7.5 mm, respectively. As shown in Fig. 19, the trajectory of the small VG is in good agreement with that of the large VG when they are both normalized with Hv/. Hence, it seems that the idea in Fig. 18(b) is appropriate. As the
result, the normalization works quite well as shown in Fig. 17.
(a) Without correction (b) With correction
Fig. 19 Vortex trajectory and corrected trajectory with the non-dimensional VG size Hv/.
Vortex scale in yzplane (original) Large VG Small VG Upper edge (Small VG) Upper edge (Large VG)
Vortex scale in yzplane (after correction)
Upper edge
Small VG and Large VG Scale correction by Hv/ Trajectory in xzplane (original) Large VG Small VG Trajectory in xzplane (after correction)
Small VG and Large VG Scale correction by Hv/ 0 25 50 0 50 100 150 200 250 300 350 400 zv /( Hv / ) , mm xv /(Hv /), mm 7.5 mm 2.5 mm 6 7 8 9 10 11 12 13 14 15 16 17 18 19 20 21 22 23 24 25 26 27 28 29 30 31 32 33 34 35 36 37 38 39 40 41 42 43 44 45 46 47 48 49 50 51 52 53 54 55 56 57
For Peer Review
Figure 20 shows the relationship between the parameters in Fig. 17 and a typical wing-body junction problem. An ideal vortex trajectory is also shown in Fig. 20, where vortex interacts with the corner flow just upstream of the shock wave. In order to avoid a detrimental interaction between the VG and the boundary layer on the body, the interval Dvt
should be larger than the boundary layer thickness on the body. If the aspect ratio and the VG angle are in the range tested in this research, an optimum height and location of VGs can be determined based on the boundary of the separation modes in Fig. 17. Because, in the lift off mode, the sensitivity of the VG effect is low to the normalized location parameter, it seems that the parameter should be selected conservatively. For example, we propose to start practical tests at a value, (Xvs/Dvt)(Hv/)2 ≅ 40.
Fig. 20 Application of a corner VG for wing-body junction problem.
IV.Conclusion
Wind tunnel experiments were conducted to investigate the effect of vortex generators (VGs) on a corner flow separation caused by an interaction between a normal shock wave and a turbulent boundary layer in a Mach 1.4 flow. We defined VGs whose leading edge turns towards the corner as “toe-in VG”, and VGs whose leading edge points in the opposite direction as “toe-out VG”. The VGs were attached on the bottom wall of the test section. The influence of the VG direction, the size, and the location on the corner flow separation was investigated mainly based on surface oil flow visualization.
It was found that toe-in VGs whose height was about 1.5 times the boundary layer thickness reduced the corner flow separation when the interval between the VG and the sidewall was the same as the VGs height. However, at the
Corner flow separation Flow Toe-out VGs Midspan separation Toe-out VG Dvt Xvs
Ideal vortex trajectory
Hv Lv Flow Boundary Layer Shock wave 6 7 8 9 10 11 12 13 14 15 16 17 18 19 20 21 22 23 24 25 26 27 28 29 30 31 32 33 34 35 36 37 38 39 40 41 42 43 44 45 46 47 48 49 50 51 52 53 54 55 56 57 58
For Peer Review
same time, a large separation appeared in the center region on the bottom wall. The influence of the toe-in VGs monotonically decreased as the VGs size reduced.
The effect of the toe-out VGs was categorized into three ‘modes’ namely, the “lift off mode”, the “adhesion mode”, and the “no influence mode”. The lift off mode was effective at reducing the corner flow separation. However, in this mode, a large additional sidewall separation was also observed. The effect of the VGs decreased in the lift off mode with increasing distance from the shock wave. The area of the corner flow separation clearly increased in the adhesion mode.
We defined the ratio of the distance from the shock wave to the distance from the side wall as the location parameter. We also defined that the ratio of the VG height to the boundary layer thickness as the scale parameter. The effect of the toe-out VGs and the separation modes were successfully collapsed with the location parameter normalized by the second power of the scale parameter. Based on these results, we proposed optimum parameters for toe-out VGs to reduce the corner flow separation.
Acknowledgments
The authors would like to thank David Martin, Sam Flint and Anthony Luckett for their operation of the CUED blow-down wind tunnel. We also thank to Andrea Coschignano, Elise X. Xiang, Kshitij Sabnis, and Charlotte Coles for their cooperation in the experiment. Finally, we are grateful to Kazuyuki Nakakita and Daisuke Yorita for their advices in the PSP measurement.
References
[1] Giannelis, N. F., Vio, G. A., and Levinski, O.,"A review of recent developments in the understanding of transonic shock buffet,"
Progress in Aerospace Sciences, Volume 92, 2017, pp. 39-84, doi: 10.1016/j.paerosci.2017.05.004.
[2] Rudnik, R., Sitzmann, M., Godard, J.-L., and Lebrun, F., “Experimental Investigation of the Wing-Body Juncture Flow on the DLR-F6 Configuration in the ONERA S2MA Facility,” AIAA paper 2009-4113, 27th AIAA Applied Aerodynamics Conference, 2009, doi:10.2514/6.2009-4113.
[3] Bruce, P. J. K., Burton, B. M. F., Titchener, N. A., and Babinsky, H., “Corner Effect and Separation in Transonic Channel Flows,” Journal of Fluid Mechanics, Vol. 679, 2011, pp. 247-262, doi:10.1017/jfm.2011.135.
[4] Ito, Y., Yamamoto, K., Kusunose, K., Koike, S., Nakakita, K., Murayama, M., and Tanaka, K., "Effect of Vortex Generators on Transonic Swept Wings," Journal of Aircraft, vol. 53, no. 6, 2016, pp. 1890-1904, doi: 10.2514/1.C033737.
6 7 8 9 10 11 12 13 14 15 16 17 18 19 20 21 22 23 24 25 26 27 28 29 30 31 32 33 34 35 36 37 38 39 40 41 42 43 44 45 46 47 48 49 50 51 52 53 54 55 56 57
For Peer Review
[5] Koike, S., Nakakita, K., Nakajima, T., Koga, S., Sato, M., Kanda, H., Kusunose, K., Murayama, M., Ito, Y., and Yamamoto, K., "Experimental Investigation of Vortex Generator Effect on Two- and Three-Dimensional NASA Common Research Models," AIAA paper 2015-1237, 53rd AIAA Aerospace Sciences Meeting, AIAA SciTech Forum, 2015, doi:10.2514/6.2015-1237. [6] Pearcey, H. H., "Shock-Induced Separation and Its Prevention by Design and Boundary Layer Control," Boundary Layer and Flow Control, Edited by Lachmann, G. V., Vol. 2, Pergamon Press, pp. 1166-1344, 1961, doi: 10.1002/zamm.19620420616. [7] Hideaki Ogawa and Holger Babinsky, “Wind-Tunnel Setup for Investigations of Normal Shock Wave/Boundary Layer Interaction Control,” AIAA Journal, Vol. 44, No. 11, 2006, pp. 2803-2805, doi: 10.2514/1.24370.
[8] Titchener, N., “An Experimental Investigation of Flow Control for Supersonic Inlets,” Ph.D. Thesis, the University of Cambridge, 2013, doi: 10.17863/CAM.14077.
[9] Coschignano, A., Babinsky, H., Sheaf, C., and Platt, E., “Infuence of near-leading edge curvature on the performance of aero-engine intake lips at high-incidence,” AIAA paper 2016-3559, 34th AIAA Applied Aerodynamics Conference, AIAA AVIATION Forum, 2016, doi:10.2514/6.2016-3559.
[10] Liu, T. and Sullivan, J. P., Pressure and Temperature Sensitive Paints, Springer-Verlag Berlin Heidelberg, 2005, doi: 10.1007/b137841. 6 7 8 9 10 11 12 13 14 15 16 17 18 19 20 21 22 23 24 25 26 27 28 29 30 31 32 33 34 35 36 37 38 39 40 41 42 43 44 45 46 47 48 49 50 51 52 53 54 55 56 57 58
![Table 2 and 3 show the parameters of all test cases. In the baseline VG tests, the VG parameters were equivalent to those used in previous research [4,5]](https://thumb-us.123doks.com/thumbv2/123dok_us/9768134.2468452/7.892.211.683.144.815/table-parameters-cases-baseline-parameters-equivalent-previous-research.webp)