Int. J. Food System Dynamics 9 (1), 2018, 67-78
DOI:http://dx.doi.org/10.18461/ijfsd.v9i1.915
Future Developments in German Fish Market – Integration
of Market Expert Knowledge into a Modelling System
Laura Angulo*, Petra Salamon*, Martin Banse*, Ralf Döring**, Matthias
Keller***, and Myrna van Leeuwen****
* Thünen Institute of Market Analysis, Braunschweig, Germany ** Thünen Institute of Sea Fisheries, Hamburg, Germany
***Bundesverband der deutschen Fischindustrie und des Fischgroßhandels e.V., Hamburg, Germany ****Wageningen Economic Research, International Policy, The Hague, The Netherlands
[email protected], [email protected], [email protected]; [email protected]; : [email protected]; [email protected]
Received March 2017, accepted December 2017, available online January 2018
ABSTRACT
Globally, fish has become more important in human nutrition, thus global consumption is expected to highly increase in the future years. Business-as-usual projections for fish market are limited by availability of reliable data at fish category level that hinders the differentiation in more detail on supply and demand as well as across EU member states. The new fish module in AGMEMOD provides midterm projections for the fish category markets in EU member states. For this, a status-quo simulation to the year 2030 is developed in AGMEMOD. In order to deal with the poor data availability, the model employs expert opinions about the German market, obtained through an elaborate questionnaire. Thus, expertise knowledge provides more detailed and accurate information on the German fish sector that helps to improve the insights in future German market developments. Based on this, AGMEMOD shows somewhat higher production development up to 2030, than in the original projections.
Keywords: Fish model, AGMEMOD, partial –equilibrium model, baseline projections, market expert knowledge
1
Introduction
Fish* serves as an important component in human consumption. According to the FAO (2016b), fish
represented about 17 percent of the animal protein consumed globally in 2013. Fish consumption is still increasing. In the same year, global per capita fish consumption reached 19.7 kg (FAO, 2016b) and 24.4 kg in the European Union (EU). One year later, in 2014, the average per capita consumption in the EU increased by 4 percent and globally by one kilogram (EUMOFA, 2016).
The World Bank expects that the global population will reach 9 billion by 2050. This, together with a growing standard of living and an increasing demand for animal protein, will lead to an even more
* In the following, the term ‘fish’ is used as a short form for all fish, crustaceans, mollusc and other aquatic animals which
are either captured by fisheries or are produced by aquaculture in marine, coastal and inland areas. “Aquaculture is the farming of aquatic organisms, including fish, mollusc, crustaceans and aquatic plants. Farming implies some form of intervention in the rearing process to enhance production, such as regular stocking, feeding, protection from predators, etc.” (FAO, 1998).
significant rise in fish consumption (Msangi, S., Kobayashi, M., Batka, M., Vannuccini, S., Dey, M. M., and Anderson, 2013). However, the output of the world´s wild fisheries has stagnated. By 2013, about 58.1 percent of world marine fish resources were fully exploited and 31.4 percent already over exploited. This fact led to reduced overall landings† over the last years (FAO, 2016b). In this context, aquaculture could
play an important role in pushing global fish supply. In 2014, aquaculture contributed to total world fish production by about 44 percent (FAO, 2016b). With respect to the EU member states; for example, statistics show that imports cover 73 percent of their total fish demand in volumes (FAOSTAT, 2016). But currently, only around 10 percent of the EU’s domestic production arises from aquaculture (Fishstat, 2016). An anticipated growth in aquaculture production will significantly influence price formation in fish markets and substitution between wild fish and aquaculture. Moreover, fish production and consumption trends differ highly across categories and among countries, influencing price dynamics as well. Thus, business-as-usual projections for fish supply and demand are needed to derive ex-ante impacts of, e.g., policy reforms, innovations in products and production systems, and consumer preferences.
Models such as the IMPACT Model (Delgado, Wada, Rosegrant, Meijer, and Ahmed, 2003), the AsiaFish Model (Dey et al., 2008) or the Aglink-Cosimo model (OECD-FAO, 2016) are applied to generate future changes in supply and demand of fish products. Although those models may partly disaggregate in supply at category level, they do not spell out prospects across different EU member states and fish categories. This fact is driven by data availability, which allows a differentiation mostly on the supply side. At a more disaggregated level a differentiation between wild and aquaculture fish becomes even more desirable as future trends are quite diverse across all the different segments. In contrast with the other models, AGMEMOD (AGricultural Member States MODelling, details see Chantreuil, Hanrahan, and von Leeuwen, 2012, Salamon et al., 2008), a partial equilibrium model framework, provides significant detail at EU MS levels and includes fish market information on top of its initial agricultural orientation. The fish module market has been implemented in AGMEMOD based on a database with annual data for different fish categories in member states. It covers seven fish categories (cephalopods; crustaceans; demersal marine fish; pelagic marine fish; molluscs excl. cephalopods; other marine fish species; freshwater and diadromous fish) for EU member states and other selected countries developed under the SUCCESS‡
project and is to be extended by four subcategories. The modelling system will allow the implementation of interactions with agriculture at a later stage. A differentiation between the two production systems: aquaculture and capture fishery, is possible only on the supply side but not on the demand side due to data limitations.
To cope with the lack of data, the model integrates expert knowledge for adjusting model parameters and to validate results. Expert opinions have been extensively used in different branches regarding this matter (Goulet, Jacques, and Pigeon, 2009; Krueger, Page, Hubacek, Smith, and Hiscock, 2012; Kuhnert, Hayes, Martin, and Mcbride, 2009). The incorporation of and rely on expert knowledge in modelling helps: to deal with the limited available data (Leal, Wordsworth, Legood, and Blair, 2007); to improve experimental data and prior estimations, and to adjust parameter values, according variable relationships (Kuhnert et al., 2009). Additionally, it also provides a better insight into the subject (Kuhnert et al., 2009), especially in cases on complex systems (Martin, Beshears, Milkman, Bazerman, and Sutherland, 2009). Experts may also explain impact mechanisms of policies and their implementation. With respect to technical progress along the supply chain experts can detail on effectiveness and likely implementation. Expert knowledge varies according to the depth of their work experience regarding to the subject. Therefore, it can be incorporated on different stages of the modelling process: since the design, data collection, design and discussion of scenarios, analysis of results, and for validation and verification of results (Voinov and Bousquet, 2010).
This paper deals with a differentiation of markets for a number of fish categories across member states integrating additional information provided by market experts to compensate for data gaps and to conduct validations of model outcomes to improve results. Thus the paper aims to explore possibilities 1) to further disaggregate fish categories and 2) to improve production and demand projections based on the opinion of market experts. The remainder of this paper is structured as follows: Section 2 presents the data sources and methodology for the fish modelling and for implementing the expert knowledge into the model. Section 3 describes the projection results and discussion. Section 4 concludes the outcomes of the empirical analysis.
† Only a limited amount of fish is regulated by fishing rights.
‡ Strategic Use of Competitiveness towards Consolidating the Economic Sustainability of the European Seafood Sector,
2
Methodology and Data Source
MODEL
Capture fisheries and aquaculture species are arranged following the group classification defined by (FAOSTAT, 2016)§. Hence, in the paper and AGMEMOD fish module, only seven fish categories are considered. Although some of the categories do not cover “fish” in a biological sense we follow the FAO approach to comprise water-based animals species used as food (seafood) into the group “fish”:
• Cephalopods: This category includes i.e. octopuses, squids, cuttlefish, and nautiluses.
• Molluscs excluding cephalopods: This category comprises i.e. mussels, oysters and non-penaeid prawn.
• Crustaceans: This category covers i.e. shrimp, prawn, lobster and crab.
• Freshwater and diadromous fish: This category groups fish that live in freshwater and/or migrate between freshwater and saltwater such as carp, salmonids, tilapia, bream, etc.
• Demersal marine fish: This category refers to species that live and feed on or near the bottom of seas such as Plaice, angler, flounder, grouper, soles, etc.
• Pelagic marine fish: This category refers to species that inhabit the pelagic zone of the ocean such as Mackerel, tuna, anchovy, sprat, etc.
• Other marine fish: This category comprises other marine fish not included in pelagic or demersal marine fish category.
Currently, the AGMEMOD fish module includes endogenous variables describing the supply, demand, and price formation for each of the seven fish categories. Separate prices describe market outcomes which reflect the varying supply and demand conditions for both production systems, capture and aquaculture fishery. As the composition of trade within the fish categories varies significantly across countries, the applied unit values as price proxies lead to significant differences across the EU member states. Unfortunately, on the demand side a differentiation between capture and aquaculture is impossible due to insufficient information. In addition, consumers can often not differentiate between the different sources as their knowledge on fish and fish products is quite limited. Therefore, the demand is only expressed by one aggregate commodity, without distinguishing its source of supply. Trade is implemented as net-export (NETEXP), calculated within the model as the difference between total supply and total domestic use. Table 1 describes the endogenous variables defined in the AGMEMOD fishery module.
Table 1.
Variables defined in AGMEMOD fishery markets
Supply Variables Description
(1) SUPPLYcc,comm Total supply for category COMM in country CC
(2) PROD_TYPEcc,comm,"SPRa" Production of aquaculture fish category COMM in country CC (3) PROD_TYPEcc,comm,"SPRc" Production of caught fish category COMM in country CC
Demand Variables
(4) HDEMcc,comm Total human demand for total fish category COMM in country CC
(5) TUSEcc,comm Total domestic use for total of category COMM in country CC
Price Variables
(6) PDcc,comm Domestic market prices for category COMM in country CC
(7) PCcc,comm Domestic consumer prices for category COMM in country CC
(8) PIcc,comm,fishprods Producer incentive price (fishery price and caught fish category COMM in country plus any premium) of aquaculture CC (9) PWcomm World market price for tradeable category COMM
Other Market Variables
(10) NETEXPcc,comm Net exports (supply minus domestic use) of category COMM in country CC
Source: Own compilation.
The endogenous variables on the demand side are directly influenced by the variation on prices, population, consumption trends and income. The supply side variables are affected by technological changes in production, prices, capital and labour costs (see Table 2 and Table 3). Note that the model template does not yet capture any policy measure or any fish stock representation, which are currently implemented.
Table 2.
Parameters defined in AGMEMOD fishery markets
Parameters Description
Consumption trend hdem_trcc,comm Trends in private consumption of category COMM in country CC Population pop_grcc Population growth rate in country CC
Income inc_grcc Income growth rate in country CC
Technical progress tp_grcc,comm Technical progress in supply of category COMM in country CC Capital Cost Index cap_indcc,comm Capital Cost Index by production system for category COMM in country CC Labour Cost Index lab_indcc,comm Labour Cost Index by production system for category COMM in country CC
Demand Elasticities
Own price elasthdcc,i,j Elasticity of demand with respect to price in country CC Income elastincc,I Elasticity of demand with respect to income in country CC
Supply Elasticities
Aquaculture fishery elastsp_acc,i,j Elasticity of aquaculture production with respect to producer price in country CC Caught fishery elastsp_ccc,i,j Elasticity of capture production with respect to producer price in country CC
Source: Own compilation.
Table 3.
Supply and demand equations in AGMEMOD fishery market
Supply equations
(1) Caught fish production PROD_TYPEindCntr,com,SPRc = ƒ (PIindCntr,comm, SPRc, tp_grindCntr,comm, lab_indindCntr,comm, SPRc,
cap_indindCntr,comm, SPRc) (2) Aquaculture fish
production PROD_TYPEindCntrc,com,SPRa = ƒ (PI lab_indindCntr,comm, SPRaindCntr,comm, SPRc, , tp_grindCntr,comm, cap_indindCntr,comm, SPRc)
(3) Total fish
production SUPPLYindCntr,comm = PROD_TYPE PROD_TYPEcc,com,SPRc + cc,com,SPRa
Demand equations
(4) Human demand HDEMindCntr,comm = ƒ (PCindCntr,comm, pop_grindCntr, inc_grindCntr, hdem_trindCntr,comm) (5) Total domestic use TUSEindCntr,comm = HDEMindCntr,comm
Source: Own compilation.
Elasticities are applied to cover the effects of change in prices, income and cost on production and consumption for each country and commodity represented in the model. For each country and fish category, elasticities taken from the literature (Asche, Bjørndal, and Gordon, 2005; Asche and Bjorndal, 1999; M. M. Dey et al., 2008; Fousekis and Revell, 2004) are incorporated in order to get an initial starting base for the calibration procedure.
DATA
The model requires significant amount of historical data, ranging from endogenous variables (supply by production system, domestic use, trade, prices for different levels) to exogenous variables (income, population, Gdp, inflation, taxes, technical progress). Time series for the different fish categories are mainly compiled from two sources: FAO FishstatJ (Fishstat, 2016) and FAO Food Balance Sheets (FAO, 2016a). Both sources provide country level data on production, demand, and trade. Data on both production systems - capture and aquaculture fishery - is collected from the FAO FishstatJ (updated until 2014), while demand and trade data is obtained from the FAO FBS (available until 2011**). Supply,
** This year 2017, the FAO FBS database has been updated until 2013. Based hereon, an update of the model database is
demand, and trade are expressed in volume terms (thousand tons), while prices are expressed in value terms (US$/100Kg). As prices by fish categories are not available in any of the FAO sources, the study uses proxies derived from production unit values for aquaculture and capture fisheries, and import unit values as a price proxy for domestic demand. Other exogenous variables, such as income and population growth, are incorporated from the U.S. Census Bureau, International Data Base (Bureau, 2015). Driver coefficients, relevant elasticities, and parameters are obtained from literature review and other models for the fish. Several studies highlight difficulties with respect to available and reliable data for fish. In the case of agricultural and environmental modelling, specialised knowledge is included to improve models and provide more accurate outcomes. Through knowledge-based systems (KBS), professional knowledge on farmer practices is formalized in order to build advisory tools (Girard and Hubert, 1999). Krueger et al. (2012) present an extensive literature review focused on incorporating expertise of stakeholders and experts, into environmental modelling. In their study, they point to the importance of stakeholder´s expertise for discussing the scope of the model and for creating new and extended knowledge. Expertise is considered as qualitative information integrated into mathematical models for, e.g., parameters. Likewise, the inclusion of expert knowledge on fish markets to project future trends is of considerable significance. Lamans (2003), for example, estimates a future increase of processed seafood demand in Greece but a decrease in marinated and canned products, based on expertise from the industry. Avdelas and Papaharisis (2006), with the help of a questionnaire, collect market experts´ opinions on past and future trends especially for organic and labelled products. Additionally, they request the validation of the historical development of the fishery market in Greece. Although there are some opposing views when validating the historical statistics and projections, experts agree on past and future production and consumption trends in general. They expect a rise in aquaculture products consumption and a preference for labelled products. Further, the FAO (2012) sets-up an expert panel to validate a baseline in the aquaculture and fishery sector, obtaining information to be included in their modelling parameters and modelling system. Likewise, Dey et al. (2004) implement exogenous variables trends and drivers in the AsiaFish model based on an literature review and opinion of market experts. In the same manner, Rab, Dey, and Ahmed (2002) calibrate elasticities of various groups of fish species. Expert opinions are used to analyse and develop fishery management policies aiming to figure values of key parameters. Tse and Khilnani (1989) develop the Fisheries System Management Model (FISYS) to integrate interaction among agents of the fish sector. Data not available in statistics or literature is obtained through consultations with experts. Also a range of values for parameters is collected to develop a base case and to establish later different scenarios as counterfactual to compare to the base with respect to parameter variations (Tse and Khilnani, 1989a).
Different approaches are used to elicit expert opinions about parameter values and to validate projections. One approach used in modelling is to contact directly and individually experts to derive values for key parameters (Leal et al., 2007). Under the FISYS, for example, knowledge of experts from different disciplines is collected via personal contacts from important fishery institutions, as well as through private communications (Tse and Khilnani, 1989b). Another widely applied method uses questionnaires whereas questionnaires depict, at first, the purpose of the model and the variables involved and then they try to deduct the corresponding parameters where data is not available (Martin et al., 2009). In these cases, experts receive instructions about how to answer the questions and are informed how their results will be implemented on the model. An alternative method is to present initial model outputs with their respective historical data. Experts have to compare the path of the projection and state the expectations of the future development of the key variables (Krueger et al., 2012). In this manner, feedback of experts is used to validate the initial projections. Another widely used approach is to establish workshops where draft results are presented to a group of selected experts with different backgrounds and perspectives to comment on the draft outcomes which, afterwards, will be reconsidered and revised respectively. The approach is mostly applied by big organisations like the EU Commission (Chatzopoulos, Fellmann, and Jensen, 2016) or the OECD in their medium-term outlook. Such an approach requires significant efforts and resources.
For this study, as data disaggregated by fish categories is not easily available, an explorative approach is tested in which market expert knowledge is exploited with the help of a questionnaire on one hand and on the other with an guided expert interview. The objective of the questionnaire is: first, to identify the fish sub-categories to be split from the initial categories, and second to validate the evolution path of fish demand and supply in Germany in order to adjust the estimates of the key parameters. This questionnaire is provided to market experts from the private sector and research institutions within the fishery sector involved in the SUCCESS Project which allowed a relatively easy access and a willingness to contribute. In the questionnaire, they are asked to state their opinion on the expected market development for four main variables:
• Demand side: included total use fish, such as feed use, food use, seed use and other uses, and is expressed in live weight (thousand tons).
• Aquaculture and capture production: included total production of fish, for aquaculture or under capture production, expressed in live weight (thousand tons).
• Import unit value: calculated as value of each unit imported, expressed in USD$/100 Kg.
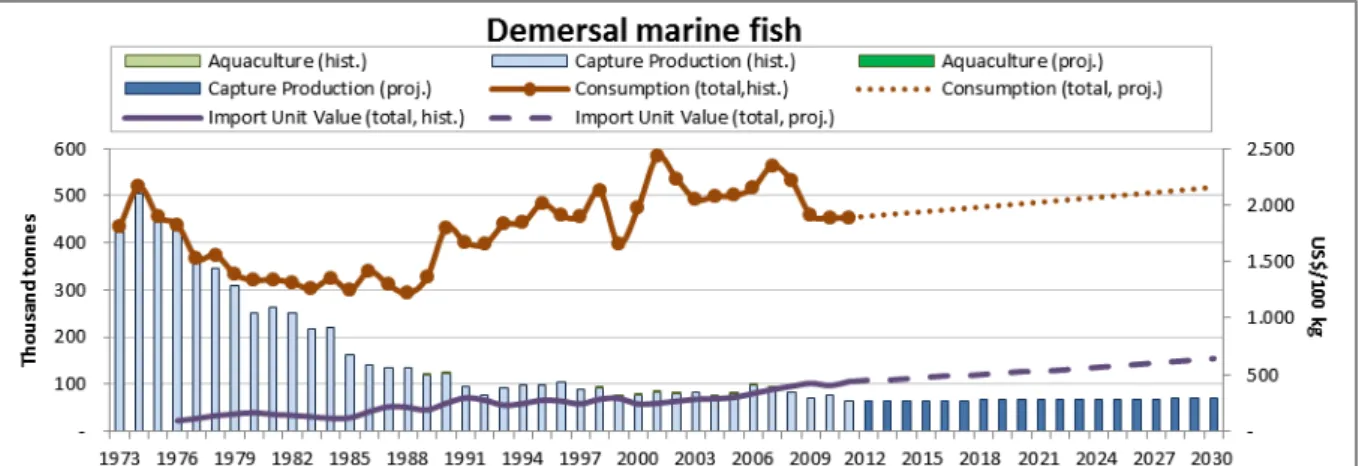
In the first section of the questionnaire the seven fish categories in the model are described: Cephalopods, mollusc exc. cephalopods, crustaceans, demersal marine fish, pelagic marine fish, other marine fish, and freshwater fish. Experts are requested to indicate, based on their work field and experience, species within each group which highly influence the price dynamics of the respective category. A second section displays figures of historical data and initial baseline projections for the four main variables for each of the seven fish categories. They comprise developments of the fish production, demand and import unit values from 1973 until 2011; followed by the baseline projections of each variable from 2012 until 2030 (see Figure 1).
Source: Based on FAOSTAT( 2016a, 2016b) and own projection results.
Figure 1. Development and baseline projection for demersal marine fish production and consumption (thousand tons) and
import unit value (US$/kg) in Germany.
Market experts are asked to review and assess prior model results of each fish category. They were requested to provide their opinion regarding the behaviour of projected variables considering the historical data and the respective expected future trends. Besides, country specific or European wide sources for better data or estimates for, e.g., income elasticity of demand, own price elasticity of demand, and supply were collected.
To elicit information, two individual interviews are carried out, one with a fishery expert of a national institution and the second one with an expert of the private sector. The interviews help to clarify possible misinterpretation of the figures exposed, to resolve doubts, to add more detailed information to adapt the graphs in order to be more comprehensible for other interviewee. After revising and adapting the questionnaire, this was send via email, due to time and geographic constraints, to the other experts. Finally, expert judgements are collected and compared across each other in order to determine a range of values of parameters with respect to the different variables.
3
Results and Discussion
Questionnaires reveal that a splitting of two categories: demersal marine fish, and freshwater and diadromous fish would be very helpful for further analysis of the fish market in the EU. Experts recommend evaluating flatfish, whitefish, and salmonidae separately as single categories. They state that
salmonidae as a global commodity with an increasing aquaculture production, has a remarkable influence
on the dynamics of the European market. Thus, it would be necessary to split salmonidae off from freshwater and diadromous fish category. In the same manner, the category demersal marine fish has to be first subdivided into flatfish and whitefish, and second, plaice (Pleuronectesplatessa) has to be broken off from the subcategory flatfish. The expert views, thus, lead in an improved fish module of AGMEMOD.
Flatfish is a general term for marine species including plaice (P.platessa), sole, turbot, brill, dab, lemon sole, Greenland halibut, megrim, and flounder. Its production has been increased over the years. Most trade in flatfish occurs across European countries. Although most flatfish is consumed in southern EU countries, Germany is an important consumer of flatfish as well. Within this group, plaice (P.platessa) is
one of the most important species. As it is considered a low-value flatfish††, plaice (P.platessa) competes
with other low-value species. In addition, capturing of plaice has been subject in significant innovation in some European countries (the Netherlands) allowing to study impacts of innovation and of changed competitiveness among European fishery industry. Similarly, whitefish is a group which comprises fish species with dry and white flesh including cod, haddock, hake and ling. Because of its use for processed seafood products, whitefish is considered the most important fish group with respect to value, and the most important trade item across fish categories. Therefore, it has to be considered separately from the category demersal and marine fish‡‡
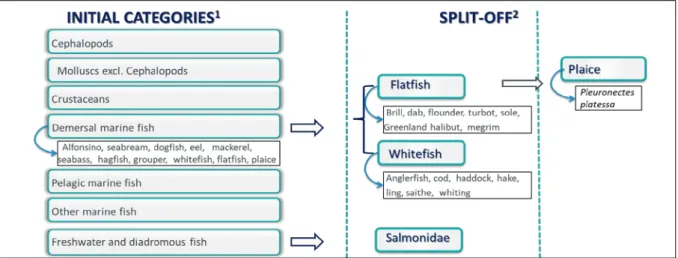
. Figure 2 presents the new species groups integrated into the modelling system, which cover whitefish, flatfish and salmonidae.
Source: 1.FAOSTAT (2016b), 2. based on own results including experts opinions
Figure 2. Disaggregation of fish groups after interviews with market experts.
Germany is a net-importer with respect to seafood and the main importer among the EU Member States. In 2011, about 16% of total seafood imports within the EU are designated to Germany, followed by Spain with 12% and France with 11% (FAOSTAT, 2016). Main traded fish categories in Germany are pelagic marine fish, demersal marine fish, and freshwater and diadromous fish. Together they represented 83% of total seafood net import in 2011. Fish production in Germany depicts some fluctuation during the last decade. Again, pelagic marine fish together with demersal marine fish and, freshwater fish and diadromous fish covers 86% of total German fish production in 2011. In the case of pelagic and demersal marine fish, total production comes from capture fishery, while in the case of freshwater and diadromous fish 54% is provided by aquaculture.
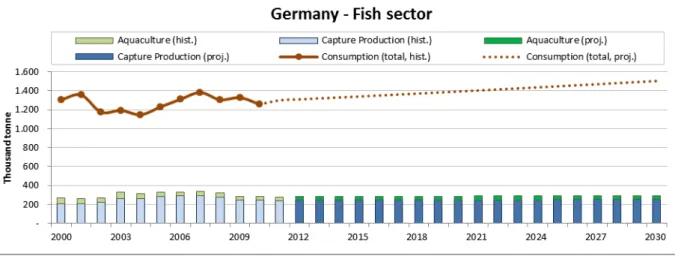
Projections on fish production in Germany are conducted under three scenarios. The first scenario includes the initial seven fish categories (Proj. 1). Initial baseline projection considers an improvement of production technology for both production systems: aquaculture und capture fisheries; as well as an increase in consumer preferences for fish. Thus, production and demand reflect technical progress, consumer trends, price, cost and income developments, respectively. For this purpose, parameters values were taken from literature (EUMOFA, 2016; STECF, 2014). As result, total fish production in Germany is expected to increase 8% from 2011 to 2030, while demand will rise by 20% (see Figure 3).
†† According to experts, average prices by flatfish species vary widely. The lowest price is observed for plaice (P.platessa), 1
euro per kg, while the highest price is observed for Sole, 12 €/ kg.
Source: Based on FAOSTAT (2016a, 2016b), and own projection results.
Figure 3. Development and baseline projection for fish production and consumption (thousand tons) in Germany.
Figure 4 depicts observed production levels for the main fish categories in Germany between 2001 and 2011, and first baseline projections for 2020 and 2030. Concerning capture production, draft projection results for the period 2011 to 2030 show a major production increase for demersal marine fish by 21%. In other categories, growth is quite limited, with an increase by 6% for freshwater fish production and 5% for pelagic marine fish production. In contrast, crustacean’s production declines by 20%. Although other marine fish and cephalopods production sore up in projection period by 90% and 51% respectively, their production for 2030 is still negligible, under 280 tons for the first and 20 tons for the latter. In aquaculture systems, Germany produces mainly freshwater fish and other molluscs except cephalopods. The first displays an increase by 69% while other molluscs except cephalopods declines and will reach only half of the current level by 2030.
Source: Based on Fishstat (2016) for year 2001 and 2011, and own projection results for year 2020 and 2030. Note: There is no capture production of other mollusc excl. cephalopods.
Figure 4. Production of main fish categories in Germany (thousands tons).
Experts confirmed the historical path for Germany, as it has been extracted from the statistics. However, they divert from the draft baseline for crustaceans, demersal marine fish, pelagic marine fish, and freshwater fish production. They agree that the production projection presented in the drafts results for all fish categories were very discreet. Therefore, a second baseline was established covering expert statements and responses to questionnaires (Proj. 2). Expert validation is especially on recent developments in production, consumption and trade, new regulations in the sector and expectations on future fish stocks and their developments.
Regarding crustacean production projection, experts point out that current fishing gears for shrimp fishery are gradually replaced by more sustainable ones, slowing down the declining crustaceans capture production (Figure 5). In the case of freshwater and diadromous fish, experts confirm an increasing preference for regional fish. This highly influences aquaculture production of freshwater and diadromous fish. However, an increasing demand of freshwater and diadromous fish will stimulate capture production as well, although in a lesser degree. Therefore, capture production will increase slightly more than the results presented under the baseline 1 (Figure 5).
Based on the status of the Maximal Sustainable Yield (MSY) of pelagic marine fish, experts render a slow increase in production during the first years followed by a more explicit growth during the last years of the period. Also, capture production of demersal marine fish is directly linked to MSY. Experts assume recovery fish stocks during the first decade leading to an important increase for the next years until the end of the period (Figure 5).
Source: Based on Fishstat (2016) for year 2011, and own projection results.
Figure 5.Capture production of crustaceans, freshwater fish, demersal marine fish, and pelagic marine fish under baseline
projection 1 and baseline projection 2 (thousand tons).
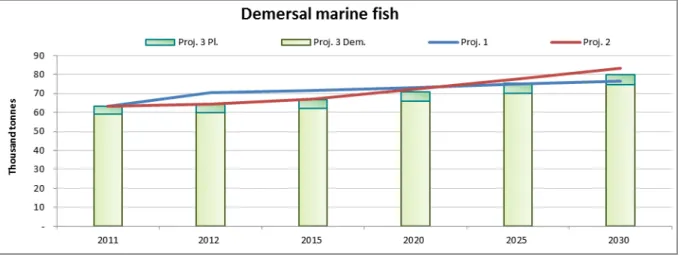
Demersal marine fish is given a special consideration, as it is later split in two fish categories: flatfish and
whitefish, and an additional subcategory: plaice (P.platessa). Therefore, using the model including expert knowledge, a third scenario displays the baseline projection of demersal marine fish excluding plaice (P. platessa) production (Proj. 3).
Source: Based on own projection results. Note: Proj. 1: initial baseline projection.
Proj. 2: baseline projection including expert opinions.
Proj. 3: baseline projection including expert opinions and excluding plaice (P. platessa) from the demersal marine fish.
New parameters were considered for this new category based on literature review and again adjusted according expert knowledge collected from the questionnaires. Results under baseline proj. 2 and baseline proj. 3 with respect to demersal marine fish capture production depict a similar development over the projected period. However, after 2015, the gap between both becomes wider (Figure 6). Exclusion of plaice (P. platessa) reduces projection levels of capture production of demersal marine fish, affecting as well its development. Thus, it reaches similar levels to those under the first baseline projection (Figure 7). Although, plaice (P. platessa) evolution will push the growth within demersal capture production, final capture production levels will stay lower than under proj. 2.
Source: Based on own projection results. Note: Proj. 1: initial baseline projection.
Proj. 2: baseline projection including expert opinions.
Proj. 3 Dem.: baseline projection including expert opinions for demersal marine fish without plaice (P. platessa). Proj. 3 Pl.: baseline projection including expert opinions for plaice (P. platessa).
Figure 7. Comparison of capture production of demersal marine fish with and without production of plaice „Pleuronectes
Platessa“ in Germany (thousand tons).
4
Summary and Conclusion
Fish and fish products are important food items in Europe, especially in demand and trade whereas production mostly lags significantly behind demand. Innovation and fish stocks are relevant in future market dynamics, so that detailed projections on future developments of different fish categories will help to frame policies and technologies to increase sustainability and competitiveness of the sector. Therefore, the AGMEMOD model has been extended by the European country specific models for the markets of different categories. However, lack of appropriate available data is one of the main obstacles in modelling fish sectors. One option to overcome involved problems is to set-up a validation workshop which requires significant resources. In the paper, we pursue a different approach and try to apply questionnaires (written and oral) to achieve the same and examine their impacts on the outcomes. Integration of different sources of knowledge may improve modelling results, as experts may have access to specific and critical information and additional data sources regarding the studied sector.
In the paper, expert knowledge with respect to market developments and technical innovations are considered in order to improve baseline projections of the fish market up to 2030 in Germany. Assessments of questionnaire lead to implement four additional categories to the seven prior ones, established by FAO, reflecting better the European situation. Experts suggested breaking up these categories: flatfish and whitefish from demersal marine fish category and salmonidae from freshwater and diadromous fish category, due to their significance for price dynamics, while the eleventh category represents the specie Plaice “Pleuronectes Platessa”. Based on the recommendation fishery and aquaculture sectors develop in different ways depending on the included knowledge. The initial model projection reflects slight increase in German capture production of demersal marine fish and freshwater and diadromous fish by 2030, and a higher growth in capture production of pelagic marine fish. In contrast, crustacean capture production will face a steep decrease. Experts’ expectations on recuperation of fish stocks, changes in regulation and productivity improvement will alter the development of production of those fish groups. The new baseline projections show an even smoother increase at the beginning of the period, but a higher production level by the end of the period until 2030.
apply more evidence based assumptions in models. Oral (guideline based) interviews are more suitable to improve model set-up and model structure as the interviewer can shape the process to fill existing gaps in data and knowledge on processes and technologies and on certain market outcomes. In addition, modellers can clarify open topics by further enquiries. However, trade-offs may exist with respect to the accuracy of parameter’s calculation based on expert opinion and the simplicity of the model. To elicit expert knowledge and incorporate it in models may, in general, be subject to biases which, in consequence, may induce shortcoming into re-adjusting parameters. To minimize the risk, employment of a number of experts in expert discussion groups may be of advantages, especially if the experts have some different foci and perspectives and will achieve consensus. However, to extent the number of involved experts may require the additional resources on one hand and on the other the existence of a broader group of experts. A likely setup will be shaped by the questions on hand.
When it comes to the validation of market developments a written or online questionnaire may provide some advantage in favour of an oral interview. Although the written questionnaire does not allow to detail and to enquire further open topics, biases in the opinion of a single expert or a small group of experts can be cancelled out. Efforts and resources required in the process are limited and the process can even be automated. That does not indicate at all, that results are better. And this approach also calls for a bigger group of available experts. Hence, whether the expert knowledge really improves the model outcome needs further considerations., but the Fish module in AGMEMOD captures important inputs from experts of the German fishery market, so far as possible.
References
Asche, F., Bjorndal, T. (1999). Demand elasticities for fish and seafood: A review, 94.
Asche, F., Bjørndal, T., and Gordon, D. V. (2005). Demand structure for fish. SNF Working Paper, (37): 1–44. Avdelas, L., Papaharisis, L. (2006). The Market for Fishery Products in Greece: Recent Trends and Future
Speculation. In AQUAMEDIT 2006.
Bureau, U. S. C. (2015). International Data Base. Retrieved from http://www.census.gov/ipc/www/idb/
Chantreuil, F., Hanrahan, K. F., and von Leeuwen, M. (2012). The Future of EU Agricultural Markets by
AGMEMOD. Springer Science and Business Media.
Chatzopoulos, T., Fellmann, T., and Jensen, H. (2016). EU commodity market development: Medium-term agricultural outlook. In Proceedings of the October 2016 workshop. JRC Conference and Workshop Reports, European Commission, JRC104101. http://doi.org/10.2791/157002
Delgado, C. L., Wada, N., Rosegrant, M. W., Meijer, S., and Ahmed, M. (2003). Fish To 2020 Supply and Demand in Changing Global Markets (Vol. 62). WorldFish.
Dey, M. M., Garcia, Y. T., Kumar, P., Piumsombun, S., Haque, M. S., Li, L., and Koeshendrajana, S. (2008). Demand for fish in Asia: A cross-country analysis. Australian Journal of Agricultural and Resource Economics, 52(3): 321–338. http://doi.org/10.1111/j.1467-8489.2008.00418.x
Dey, M., Rodriguez, U.-P., Briones, R., Li, C., Haque, M., Li, L., and Ahmed, M. (2004). Disaggregated projections on supply, demand, and trade for developing Asia: Preliminary results from the AsiaFish model. IIFET 2004 Japan Proceedings, (5945): 1–10.
EUMOFA. (2016). The EU Fish Market 2016 Edition. European Union, Brussels.
FAO. (1998). Rural Aquaculture: Overview and Framework for Coutry Reviews Definitions. Retrieved September 15, 2017, from http://www.fao.org/docrep/003/x6941e/x6941e04.htm
FAO. (2012). The State of World Fisheries and Aquaculture 2012. Rome, Italy: Food and Agriculture Organisation. http://doi.org/10.5860/CHOICE.50-5350
FAO. (2016a). Food Balance Sheets. Retrieved from http://www.fao.org/faostat/en/#data/FBS
FAO. (2016b). The state of world fisheries and aquaculture 2016. Contributing to food security and nutrition for all. Rome.
FAOSTAT. (2016). FAOSTAT Online Database. Retrieved June 20, 2008, from http://www.fao.org/faostat/en/ Fishstat. (2016). FishstatJ. Retrieved June 20, 2008, from
http://www.fao.org/fishery/statistics/software/-fishstatj/en
Fousekis, P., Revell, B. J. (2004). Retail Fish Demand in Great Britain and Its Fisheries Management Implications.
Girard, N., Hubert, B. (1999). Modelling expert knowledge with knowledge-based systems to design decision aids The example of a knowledge-based model on grazing management. Agricultural Systems, 59: 123–144. http://doi.org/10.1016/S0308-521X(98)00085-7
Goulet, V., Jacques, M., and Pigeon, M. (2009). Expert: Modeling without data using expert opinion. R Journal,
1(May): 31–36.
Krueger, T., Page, T., Hubacek, K., Smith, L., and Hiscock, K. (2012). The role of expert opinion in environmental modelling. Environmental Modelling and Software, 36: 4–18. http://doi.org/10.1016/j.envsoft.2012.01.011 Kuhnert, P. M., Hayes, K., Martin, T. G., and Mcbride, M. F. (2009). Expert opinion in statistical models. In 18th
World IMACS / MODSIM Congress (pp. pp. 4262–4268). Cairns, Australia: Modelling and Simulation Society
of Australia and New Zealand and International Association for Mathematics and Computers in Simulation. Lamans. (2003). Study of the processing seafood industry in Greece. Athens.
Leal, J., Wordsworth, S., Legood, R., and Blair, E. (2007). Eliciting expert opinion for economic models: An applied example. Value in Health, 10(3): 195–203. http://doi.org/10.1111/j.1524-4733.2007.00169.x Martin, J. M., Beshears, J., Milkman, K. L., Bazerman, M. H., and Sutherland, L. A. (2009). Modeling Expert
Opinions on Food Healthfulness: A Nutrition Metric. Journal of the American Dietetic Association, 109(6): 1088–1091. http://doi.org/10.1016/j.jada.2009.03.009
Msangi, S., Kobayashi, M., Batka, M., Vannuccini, S., Dey, M. M., Anderson, J. L. (2013). Fish to 2030: Prospects for fisheries and aquaculture. World Bank Report Number 83177-GLB (Vol. 3).
OECD-FAO. (2016). The Aglink-Cosimo Model Agricultural Outlook. Retrieved February 8, 2016, from http://www.agri-outlook.org/about/
Rab, M., Dey, M. M., and Ahmed, M. (2002). Sustaining Fisheries and Aquaculture Production To Benefit Poor
Households in Asia March-August 2002 Semi-annual progress report. Penang, Malaysia.
Salamon, P., Chantreuil, F., Donnellan, T., Erjavec, E., Esposti, R., Hanrahan, K. F., and Salputra, G. (2008). How to deal with challenges of linking a large number of individual national models: the case of the AGMEMOD partnership (No. Agrarwirtschaft 57 (8)).
STECF. (2014). Summary of the 2014 Annual Economic Report on the EU Fish Processing Industry (STECF-14-21). (R. Döring and A. Borrello, Eds.) (EUR 27029 ). Luxembourg: Publications Office of the European Union. http://doi.org/10.2788/968527
Tse, E., Khilnani, A. (1989a). An integrated system model for a fishery management process—I. Model structure. Computers and Mathematics with Applications, 17(8/9): 1329–1343.
Tse, E., Khilnani, A. (1989b). An integrated system model for a fishery management process-II. A case study.
Computers and Mathematics with Applications, Volume 18(6-7): 675–690.
Voinov, A., Bousquet, F. (2010). Modelling with stakeholders. Environmental Modelling and Software, 25(11): 1268–1281. http://doi.org/10.1016/j.envsoft.2010.03.007